Mira Road Memorable Call Grls Number-9833754194-Bhayandar Speciallty Call Gir...
Exxon Mobil Corporation 1Q'06 IR Supplement and Charts
1. EXXON MOBIL CORPORATION
1Q06 INVESTOR RELATIONS DATA SUMMARY (PAGE 1 of 6)
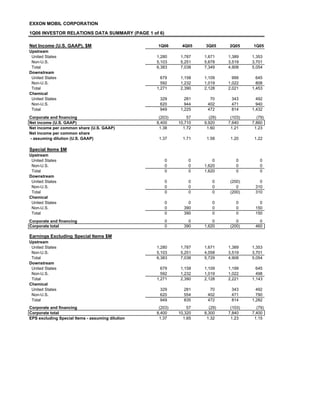
Net Income (U.S. GAAP), $M 1Q06 4Q05 3Q05 2Q05 1Q05
Upstream
United States 1,280 1,787 1,671 1,389 1,353
Non-U.S. 5,103 5,251 5,678 3,519 3,701
Total 6,383 7,038 7,349 4,908 5,054
Downstream
United States 679 1,158 1,109 999 645
Non-U.S. 592 1,232 1,019 1,022 808
Total 1,271 2,390 2,128 2,021 1,453
Chemical
United States 329 281 70 343 492
Non-U.S. 620 944 402 471 940
Total 949 1,225 472 814 1,432
Corporate and financing (203) 57 (29) (103) (79)
Net income (U.S. GAAP) 8,400 10,710 9,920 7,640 7,860
Net income per common share (U.S. GAAP) 1.38 1.72 1.60 1.21 1.23
Net income per common share
- assuming dilution (U.S. GAAP) 1.37 1.71 1.58 1.20 1.22
Special Items $M
Upstream
United States 0 0 0 0 0
Non-U.S. 0 0 1,620 0 0
Total 0 0 1,620 0 0
Downstream
United States 0 0 0 (200) 0
Non-U.S. 0 0 0 0 310
Total 0 0 0 (200) 310
Chemical
United States 0 0 0 0 0
Non-U.S. 0 390 0 0 150
Total 0 390 0 0 150
Corporate and financing 0 0 0 0 0
Corporate total 0 390 1,620 (200) 460
Earnings Excluding Special Items $M
Upstream
United States 1,280 1,787 1,671 1,389 1,353
Non-U.S. 5,103 5,251 4,058 3,519 3,701
Total 6,383 7,038 5,729 4,908 5,054
Downstream
United States 679 1,158 1,109 1,199 645
Non-U.S. 592 1,232 1,019 1,022 498
Total 1,271 2,390 2,128 2,221 1,143
Chemical
United States 329 281 70 343 492
Non-U.S. 620 554 402 471 790
Total 949 835 472 814 1,282
Corporate and financing (203) 57 (29) (103) (79)
Corporate total 8,400 10,320 8,300 7,840 7,400
EPS excluding Special Items - assuming dilution 1.37 1.65 1.32 1.23 1.15
2. EXXON MOBIL CORPORATION
1Q06 INVESTOR RELATIONS DATA SUMMARY (PAGE 2 of 6)
Supplemental Information (continued)
Net production of crude oil and 1Q06 4Q05 3Q05 2Q05 1Q05
natural gas liquids, kbd
United States 440 431 439 500 540
Canada 332 356 317 355 358
Europe 563 539 516 554 575
Africa 741 795 688 583 596
Asia Pacific/Middle East 467 330 337 328 329
Russia/Caspian 114 131 106 98 95
Other 39 47 48 50 51
Total liquids production 2,696 2,629 2,451 2,468 2,544
Natural gas production available for sale, mcfd
United States 1,707 1,620 1,609 1,835 1,897
Canada 882 912 926 913 923
Europe 5,977 4,804 2,930 3,787 5,767
Asia Pacific/Middle East 2,462 2,303 2,096 2,020 2,036
Russia/Caspian 82 98 70 67 74
Other 89 85 85 87 88
Total natural gas production available for sale 11,199 9,822 7,716 8,709 10,785
Total worldwide liquids and gas production, koebd 4,562 4,266 3,737 3,919 4,341
Refinery throughput, kbd
United States 1,716 1,669 1,744 1,906 1,860
Canada 486 479 439 467 481
Europe 1,645 1,717 1,735 1,668 1,566
Asia Pacific 1,465 1,484 1,530 1,413 1,533
Other Non-U.S. 236 303 316 273 309
Total refinery throughput 5,548 5,652 5,764 5,727 5,749
Petroleum product sales, kbd1
United States 2,714 2,900 2,903 2,986 2,870
Canada 591 641 613 608 620
Europe 2,101 2,155 2,121 2,128 2,055
Asia Pacific 1,735 1,837 1,744 1,722 1,844
Other Non-U.S. 724 789 836 815 840
Total petroleum product sales 7,865 8,322 8,217 8,259 8,229
Gasolines, naphthas 3,008 3,274 3,335 3,343 3,144
Heating oils, kerosene, diesel 2,601 2,632 2,460 2,461 2,690
Aviation fuels 655 649 739 720 691
Heavy fuels 689 754 694 675 718
Specialty products 912 1,013 989 1,060 986
Total petroleum product sales 7,865 8,322 8,217 8,259 8,229
Chemical prime product sales, kt
United States 2,620 2,228 2,639 2,664 2,838
Non-U.S. 4,296 4,064 4,316 3,928 4,100
Total chemical prime product sales 6,916 6,292 6,955 6,592 6,938
1
Petroleum product sales include 689 kbd for first quarter 2006 and 735 kbd for first quarter 2005 for
purchases/sales contracts with the same counterparty.
3. EXXON MOBIL CORPORATION
1Q06 INVESTOR RELATIONS DATA SUMMARY (PAGE 3 of 6)
Supplemental Information (continued)
Average Realization Data 1Q06 4Q05 3Q05 2Q05 1Q05
United States
ExxonMobil
Crude ($/b) 55.99 52.23 56.97 45.58 42.70
Natural Gas ($/kcf) 8.31 11.34 7.88 6.45 6.18
Benchmarks
WTI ($/b) 63.28 59.99 63.05 53.03 49.70
ANS-WC ($/b) 60.87 57.87 60.79 50.04 44.86
Henry Hub ($/mbtu) 9.01 13.00 8.53 6.74 6.27
Non-U.S.
ExxonMobil
Crude ($/b) 57.14 53.02 58.24 47.55 42.57
Natural Gas ($/kcf) 7.43 6.99 5.61 5.25 5.45
European NG ($/kcf) 8.05 7.11 5.61 5.58 5.85
Benchmarks
Brent ($/b) 61.75 56.90 61.54 51.59 47.50
Capital and Exploration Expenditures, $M
Upstream
United States 548 542 628 531 441
Non-U.S. 3,539 3,852 2,958 3,147 2,371
Total 4,087 4,394 3,586 3,678 2,812
Downstream
United States 162 213 191 201 148
Non-U.S. 419 535 455 448 304
Total 581 748 646 649 452
Chemical
United States 63 61 54 73 55
Non-U.S. 81 108 108 102 93
Total 144 169 162 175 148
Other 12 20 20 35 5
Total Capital and Exploration Expenditures 4,824 5,331 4,414 4,537 3,417
Exploration Expense Charged to Income, $M
Consolidated - United States 63 54 29 53 21
- Non-U.S. 214 278 215 155 147
Non-consolidated - ExxonMobil share - United States 0 0 0 0 0
- Non-U.S. 3 0 5 7 5
Total Exploration Expense Charged to Income 280 332 249 215 173
Effective Income Tax Rate, % 47.4% 41.1% 41.8% 41.4% 41.3%
Common Shares Outstanding (millions)
At quarter end 6,050 6,133 6,222 6,305 6,366
Average - assuming dilution 6,126 6,211 6,303 6,370 6,421
Cash Flows from Operations and Asset Sales ($G)
Net cash provided by operating activities 14.6 10.5 15.7 9.0 13.0
Sales of subsidiaries, investments and PP&E 0.4 1.4 0.8 2.0 1.8
Cash flows from operations and asset sales 15.0 11.9 16.5 11.0 14.8
The above numbers reflect ExxonMobil's current estimate of volumes and realizations given data available as of the end of the
first quarter of 2006. Volumes and realizations may be adjusted when full statements on joint venture operations are
received from outside operators. ExxonMobil management assumes no duty to update these estimates.
4. Upstream Earnings
Upstream 1Q06 vs. 4Q05
Upstream 1Q06 vs. 1Q05
$M $M
8000
8000 2,180 (400) 7,038 (10) (40) (605)
(450)
7000
7000 6,383
6,383
6000
6000
5,054
5000 5000
4000 4000
3000 3000
2000 2000
1000 1000
0 0
1Q05 Realization Vol/Mix Other 1Q06 4Q05 Realization Vol/Mix Other 1Q06
1Q06 vs. 1Q06 vs.
$M 1Q05 $M 4Q05
1Q05 1Q06 4Q05 1Q06
U.S. 1,353 1,280 -73 U.S. 1,787 1,280 -507
Non-U.S. 3,701 5,103 +1,402 Non-U.S. 5,251 5,103 -148
Total 5,054 6,383 +1,329 Total 7,038 6,383 -655
Note: Earnings exclude special items
5. Downstream Earnings
Downstream 1Q06 vs. 4Q05
Downstream 1Q06 vs. 1Q05
$M $M
3000 3000
2,390 (1,110)
2500 2500
2000
2000
1500
1500 1,271 1,271
50 20 (70) 60
60
1,143
1000
1000
500
500
0
0
4Q05 Margin Vol/Mix Other 1Q06
1Q05 Margin Vol/Mix Other 1Q06
1Q06 vs. 1Q06 vs.
$M 1Q05 $M 4Q05
1Q05 1Q06 4Q05 1Q06
U.S. 645 679 +34 U.S. 1,158 679 -479
Non-U.S. 498 592 +94 Non-U.S. 1,232 592 -640
Total 1,143 1,271 +128 Total 2,390 1,271 -1,119
Note: Earnings exclude special items
6. Chemical Earnings
Chemical 1Q06 vs. 1Q05 Chemical 1Q06 vs. 4Q05
$M $M
1500 1500
(410)
1,282
(20)
100 949 160 949
1000 1000 (50)
835
500 500
0 0
1Q05 Margin Vol/Mix Other 1Q06 4Q05 Margin Vol/Mix Other 1Q06
1Q06 vs. 1Q06 vs.
$M 1Q05 $M 4Q05
1Q05 1Q06 4Q05 1Q06
U.S. 492 329 -163 U.S. 281 329 +48
Non-U.S. 790 620 -170 Non-U.S. 554 620 +66
Total 1,282 949 -333 Total 835 949 +114
Note: Earnings exclude special items