VIP Independent Call Girls in Mumbai 🌹 9920725232 ( Call Me ) Mumbai Escorts ...
conoco phillips 2006Third Quarter
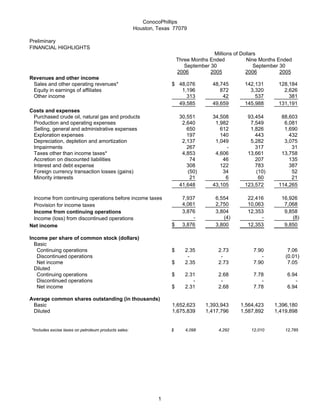
1. ConocoPhillips
Houston, Texas 77079
Preliminary
FINANCIAL HIGHLIGHTS
Millions of Dollars
Three Months Ended Nine Months Ended
September 30 September 30
2006 2005 2006 2005
Revenues and other income
Sales and other operating revenues* $ 48,076 48,745 142,131 128,184
Equity in earnings of affiliates 1,196 872 3,320 2,626
Other income 313 42 537 381
49,585 49,659 145,988 131,191
Costs and expenses
Purchased crude oil, natural gas and products 30,551 34,508 93,454 88,603
Production and operating expenses 2,640 1,982 7,549 6,081
Selling, general and administrative expenses 650 612 1,826 1,690
Exploration expenses 197 140 443 432
Depreciation, depletion and amortization 2,137 1,049 5,282 3,075
Impairments 267 - 317 31
Taxes other than income taxes* 4,853 4,606 13,661 13,758
Accretion on discounted liabilities 74 46 207 135
Interest and debt expense 308 122 783 387
Foreign currency transaction losses (gains) (50) 34 (10) 52
Minority interests 21 6 60 21
41,648 43,105 123,572 114,265
Income from continuing operations before income taxes 7,937 6,554 22,416 16,926
4,061 2,750 10,063 7,068
Provision for income taxes
3,876 3,804 12,353 9,858
Income from continuing operations
- (4) - (8)
Income (loss) from discontinued operations
$ 3,876 3,800 12,353 9,850
Net income
Income per share of common stock (dollars)
Basic
Continuing operations $ 2.35 2.73 7.90 7.06
Discontinued operations - - - (0.01)
Net income $ 2.35 2.73 7.90 7.05
Diluted
Continuing operations $ 2.31 2.68 7.78 6.94
Discontinued operations - - - -
Net income $ 2.31 2.68 7.78 6.94
Average common shares outstanding (in thousands)
Basic 1,652,623 1,393,943 1,564,423 1,396,180
Diluted 1,675,839 1,417,796 1,587,892 1,419,898
*Includes excise taxes on petroleum products sales: $ 4,098 4,292 12,010 12,785
1
2. ConocoPhillips
Houston, Texas 77079
Preliminary
SELECTED FINANCIAL DATA
Millions of Dollars
Three Months Ended Nine Months Ended
September 30 September 30
2006 2005 2006 2005
INCOME (LOSS) FROM CONTINUING OPERATIONS
E&P
United States $ 995 1,107 3,476 2,965
International 909 1,181 4,285 3,039
Total E&P 1,904 2,288 7,761 6,004
Midstream 169 88 387 541
R&M
United States 1,444 1,096 3,174 2,602
International 20 294 388 598
Total R&M 1,464 1,390 3,562 3,200
LUKOIL Investment 487 267 1,123 525
Chemicals 142 13 394 209
Emerging Businesses 11 - 7 (16)
Corporate and other (301) (242) (881) (605)
Consolidated $ 3,876 3,804 12,353 9,858
INCOME (LOSS) FROM DISCONTINUED OPERATIONS
Corporate and other $ - (4) - (8)
SUMMARY OF NET INCOME (LOSS)
E&P
United States $ 995 1,107 3,476 2,965
International 909 1,181 4,285 3,039
Total E&P 1,904 2,288 7,761 6,004
Midstream 169 88 387 541
R&M
United States 1,444 1,096 3,174 2,602
International 20 294 388 598
Total R&M 1,464 1,390 3,562 3,200
LUKOIL Investment 487 267 1,123 525
Chemicals 142 13 394 209
Emerging Businesses 11 - 7 (16)
Corporate and other (301) (246) (881) (613)
Net Income $ 3,876 3,800 12,353 9,850
2
3. ConocoPhillips
Houston, Texas 77079
Preliminary
SELECTED FINANCIAL DATA
Three Months Ended Nine Months Ended
September 30 September 30
2006 2005 2006 2005
INCOME FROM CONTINUING OPERATIONS
Effective tax rate % 51.2 % 42.0 44.9 41.8
Millions of Dollars
FOREIGN CURRENCY GAINS (LOSSES)
AFTER-TAX
E&P $ (20) 2 (47) 6
Midstream - - - 7
R&M (6) (13) 25 (49)
LUKOIL Investment 1 (1) 2 (1)
Chemicals - - - -
Emerging Businesses - - - -
Corporate and other 48 (23) 4 (27)
$ 23 (35) (16) (64)
CASH FLOWS FROM OPERATING ACTIVITIES
Income from continuing operations $ 3,876 3,804 12,353 9,858
Depreciation, depletion and amortization 2,137 1,049 5,282 3,075
Impairments 267 - 317 31
Dry hole costs and leasehold impairments 56 55 141 211
Accretion on discounted liabilities 74 46 207 135
Deferred taxes 495 261 273 753
Undistributed equity earnings (253) (463) (1,007) (1,682)
Net gain on asset dispositions (8) (22) (64) (264)
Other (282) 192 (296) 1
Working capital adjustments (127) 1,177 (1,327) 841
Net cash provided by continuing operations 6,235 6,099 15,879 12,959
Net cash provided by discontinued operations - (3) - (6)
Net cash provided by operating activities $ 6,235 6,096 15,879 12,953
CAPITAL EXPENDITURES AND INVESTMENTS
E&P
United States $ 828 323 2,003 1,221
International 1,626 1,152 4,829 3,797
2,454 1,475 6,832 5,018
Midstream - 838 2 839
R&M 374 440 2,484 1,075
LUKOIL Investment 702 815 1,962 1,523
Chemicals - - - -
Emerging Businesses 6 2 46 5
Corporate and other 61 56 187 113
$ 3,597 3,626 11,513 8,573
OTHER
At September 30, 2006 At December 31, 2005
Total debt $27,807 12,516
Common stockholders' equity $80,477 52,731
3
4. ConocoPhillips
Houston, Texas 77079
Preliminary
OPERATING HIGHLIGHTS
BY SEGMENT
Three Months Ended Nine Months Ended
September 30 September 30
2006 2005 2006 2005
Thousands of Barrels Daily
E&P
Crude oil produced
United States
Alaska 234 281 265 296
Lower 48 119 56 101 60
353 337 366 356
Norway 190 198 190 200
United Kingdom 50 56 56 59
Canada 26 22 25 23
China 36 22 32 23
Indonesia 11 10 13 16
Vietnam 24 30 25 27
Timor Sea 40 38 39 32
Libya 71 - 49 -
Other 64 53 60 54
Total consolidated 865 766 855 790
Equity affiliates 104 124 117 122
Total Worldwide 969 890 972 912
Syncrude 23 21 20 19
Natural gas liquids produced
United States
Alaska* 11 18 18 19
Lower 48 75 30 58 30
86 48 76 49
Norway 9 10 9 9
Canada 28 10 23 10
Timor Sea 20 20 20 15
Other 3 4 4 5
Total Worldwide 146 92 132 88
7 8 11 7
*Includes reinjected volumes sold lease-to-lease.
Millions of Cubic Feet Daily
Natural gas produced*
United States
Alaska 123 173 150 169
Lower 48 2,320 1,218 1,953 1,194
2,443 1,391 2,103 1,363
Norway 260 259 263 275
United Kingdom 665 588 770 717
Canada 1,154 429 930 422
China 8 - 6 -
Timor Sea 300 35 232 35
Indonesia 342 303 320 288
Vietnam 20 20 21 17
Other 187 74 173 77
Total consolidated 5,379 3,099 4,818 3,194
Equity affiliates 8 10 9 8
Total Worldwide 5,387 3,109 4,827 3,202
*Represents quantities available for sale. Excludes
gas equivalent of NGL shown above.
Liquefied natural gas sales 522 123 407 117
LUKOIL Investment
Production (MBOE/D)* 436 266 388 231
Refinery crude oil throughput (MB/D)* 164 138 165 110
*Represents our estimated net share of LUKOIL.
4
5. ConocoPhillips
Houston, Texas 77079
Preliminary
OPERATING HIGHLIGHTS
Three Months Ended Nine Months Ended
September 30 September 30
2006 2005 2006 2005
E&P
Per Unit
Average sales prices
Crude oil (per barrel)
United States
Alaska $ 69.66 58.70 64.48 50.54
Lower 48 62.45 50.00 59.21 44.83
Total U.S. 67.25 57.31 63.05 49.59
International 67.45 59.52 65.27 51.46
Total consolidated 67.37 58.49 64.30 50.61
Equity affiliates* 46.98 45.25 47.36 37.45
Total Worldwide 65.04 56.64 62.18 48.80
Natural gas-lease (per MCF)
United States
Alaska 3.36 2.57 3.47 2.66
Lower 48 6.00 7.67 6.25 6.53
Total U.S. 5.98 7.48 6.21 6.40
International 5.87 5.60 6.23 5.25
Total consolidated 5.92 6.40 6.22 5.71
Equity affiliates* 0.32 0.20 0.30 0.25
Total Worldwide 5.91 6.38 6.21 5.70
*Excludes our equity share of LUKOIL reported in the LUKOIL Investment segment.
Midstream
Thousands of Barrels Daily
Natural gas liquids extracted
Consolidated
United States 23 23 23 22
International - 5 - 34
Equity affiliates
United States** 180 171 180 131
International 7 6 6 6
210 205 209 193
**Represents 30.3 percent interest in Duke Energy Field Services LLC (DEFS), through June 30, 2005, and 50 percent
interest beginning in July 2005.
Per Barrel
U.S. product prices
Weighted average NGL**
Consolidated $ 44.10 39.60 41.16 34.68
DEFS 43.00 38.31 40.49 33.42
**Prices are based on index prices from the Mont Belvieu and Conway market hubs that are weighted by naural-gas-liquids
component and location mix.
5
6. ConocoPhillips
Houston, Texas 77079
Three Months Ended Nine Months Ended
September 30 September 30
2006 2005 2006 2005
Thousands of Barrels Daily
R&M
United States
Crude oil capacity 2,208 2,182 2,208 2,179
Crude oil runs 2,127 2,040 1,990 2,044
Refinery production 2,334 2,223 2,173 2,238
International*
Crude oil capacity 693 428 637 428
Crude oil runs 617 431 586 420
Refinery production 643 448 613 434
U.S. Petroleum products outside sales
Automotive gasoline 1,369 1,397 1,309 1,376
Distillates 668 725 638 683
Aviation fuels 180 203 189 205
Other products 519 526 530 518
2,736 2,851 2,666 2,782
International 749 470 772 481
3,485 3,321 3,438 3,263
Per Gallon
U.S. Average sales prices**
Automotive gasoline-wholesale $ 2.27 2.00 2.13 1.71
Automotive gasoline-retail 2.46 2.14 2.28 1.86
Distillates-wholesale 2.31 1.97 2.15 1.71
*Includes ConocoPhillips' share of equity affiliates, except for our share of LUKOIL, which is reported in
the LUKOIL Investment segment.
**Excludes excise taxes.
6