
Recommended
More Related Content
What's hot
Viewers also liked
Viewers also liked (20)
Similar to Filtergraph AAS poster
Similar to Filtergraph AAS poster (20)
Recently uploaded
Recently uploaded (20)
Filtergraph AAS poster
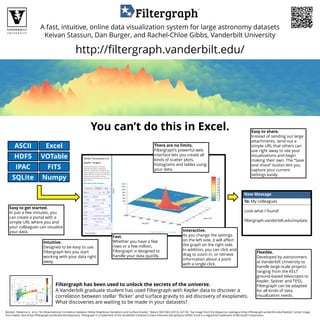
- 1. A fast, intuitive, online data visualization system for large astronomy datasets Keivan Stassun, Dan Burger, and Rachel-Chloe Gibbs, Vanderbilt University http://filtergraph.vanderbilt.edu/ You can’t do this in Excel. ASCII Excel HDF5 VOTable IPAC FITS SQLite Easy to share. Instead of sending out large attachments, send out a simple URL that others can use right away to see your visualizations and begin making their own. The “Save and share” button lets you capture your current settings easily. Numpy There are no limits. Filtergraph’s powerful web interface lets you create all kinds of scatter plots, histograms and tables using your data. New Message To: My colleagues Easy to get started. In just a few minutes, you can create a portal with a simple URL where you and your colleagues can visualize your data. Intuitive. Designed to be easy to use, Filtergraph lets you start working with your data right away. Look what I found! filtergraph.vanderbilt.edu/mydata Fast. Whether you have a few rows or a few million, Filtergraph is designed to handle your data quickly. Interactive. As you change the settings on the left side, it will affect the graph on the right side. In addition, you can click and drag to zoom in, or retrieve information about a point with a single click. Filtergraph has been used to unlock the secrets of the universe. A Vanderbilt graduate student has used Filtergraph with Kepler data to discover a correlation between stellar 'flicker' and surface gravity to aid discovery of exoplanets. What discoveries are waiting to be made in your datasets? Flexible. Developed by astronomers at Vanderbilt University to handle large-scale projects ranging from the KELT ground-based telescopes to Kepler, Spitzer and TESS, Filtergraph can be adapted for all kinds of data visualization needs. Bastien, Fabienne A. et al. "An Observational Correlation between Stellar Brightness Variations and Surface Gravity." Nature 500.7463 (2013): 427-30. Top image from the Hipparcos catalogue (http://filtergraph.vanderbilt.edu/hiptest). Center image from Kepler data (http://filtergraph.vanderbilt.edu/kepstars). Filtergraph is a trademark of the Vanderbilt Initiative in Data-intensive Astrophysics (VIDA). Excel is a registered trademark of Microsoft Corporation.