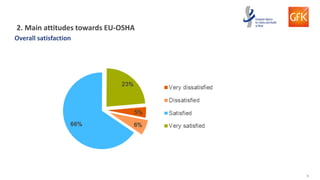
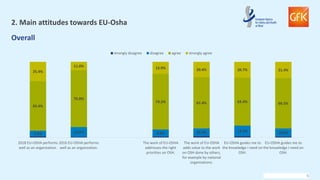
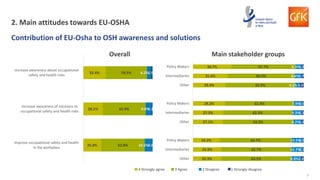
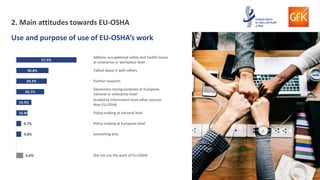
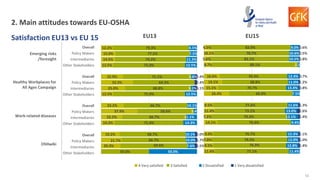
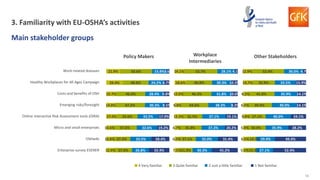
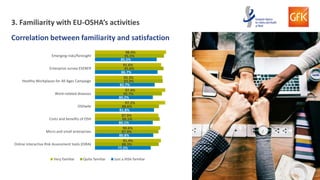
1
EU-OSHA Stakeholder Satisfaction Survey
2018 results
Prepared on behalf of EU-OSHA by GfK Social & Strategic Research
© GfK SSR February 18, 2019 | EU-OSHA Stakeholder Satisfaction Survey 2018
2
Residence of respondents (with at least 20
respondents per country)
1. Survey respondent profiles
265
192
168
106
96 93
73
58 57
40 40 36
27 26 23 21 20
86%
14%
EU Member States Other countries
Residence of respondents (EU
vs. Non-EU)
3
10%
1%
1%
1%
1%
2%
2%
2%
2%
2%
3%
5%
12%
13%
15%
20%
22%
Other
Employers Association (European)
Statutory Insurance Organisation
Journalist/media organisation
Trade Union (European)
International public body
Employers Association (national)
EU institution or body
EU-level network, NGO or association
National NGO (non-governmental organisation)
National policy-making organisation
Trade Union (national)
University/research or expert institute
OSH Service Provider, e.g. consultant
National public body (incl. labour inspectorate)
Private company (SME)
Private company (large enterprise)
84%
47%
10%
workplace
intermediaries
policy makers
other
Note: some stakeholder subcategories are considered both workplace intermediaries and policy makers.
Stakeholder subcategories included in the group “policy makers” are: international public bodies, EU Institutions or bodies, national policy-making organisations, national public bodies, EU-level networks/NGOs/associations, European employer associations,
European trade unions, national trade unions and national employer associations.
Stakeholder subcategories included in the group “workplace intermediaries” are: national NGOs, EU-level networks/NGOs/associations, national public bodies, European employers associations, European trade unions, national trade unions, national employers
associations, statutory insurance organisations, OSH Service providers, Journalist/media organisations, large private companies and small or micro companies.
1. Survey respondent profiles
Broad stakeholder groups Stakeholder categories
4
2. Main attitudes towards EU-OSHA
Overall satisfaction
5
Overall
2. Main attitudes towards EU-Osha
7.5% 13.0% 9.4% 10.2% 13.9% 10.6%
65.4%
75.0%
73.2% 67.4% 63.4% 66.5%
25.4%
11.0% 15.9% 20.4% 20.7% 21.4%
2018 EU-OSHA performs
well as an organization.
2016 EU-OSHA performs
well as an organization.
The work of EU-OSHA
addresses the right
priorities on OSH.
The work of EU-OSHA
adds value to the work
on OSH done by others,
for example by national
organisations.
EU-OSHA guides me to
the knowledge I need on
OSH.
EU-OSHA guides me to
the knowledge I need on
OSH.
strongly disagree disagree agree strongly agree
6
6.6% 7.6% 7.6% 8.7% 10.1% 7.1% 9.2% 10.5% 12.9% 14.3% 15.0%
8.2% 10.8% 11.5% 8.2%
63.7% 66.5% 66.9% 70.1%
73.8% 78.8%
65.7% 67.8% 67.6% 61.5% 63.9%
65.3% 64.2% 67.1% 70.0%
28.1% 24.2% 24.8% 19.9% 14.6% 11.8%
23.3% 19.4% 18.8% 22.5% 19.2% 24.7% 23.6% 20.0% 20.6%
PolicyMakers
Intermediaries
Other
PolicyMakers
Intermediaries
OtherStakeholders
PolicyMakers
Intermediaries
Other
PolicyMakers
Intermediaries
Other
PolicyMakers
Intermediaries
Other
EU-OSHA performs well as an
organization.
The work of EU-OSHA addresses
the right priorities on OSH.
The work of EU-OSHA adds value
to the work on OSH done by
others, for example by national
organisations.
EU-OSHA guides me to the
knowledge I need on OSH.
EU-OSHA provides access to
relevant research based
knowledge on OSH.
strongly disagree disagree agree strongly agree
Main stakeholder groups
2. Main attitudes towards EU-OSHA
7
2. Main attitudes towards EU-OSHA
Contribution of EU-Osha to OSH awareness and solutions
32.4%
28.1%
25.8%
59.5%
61.9%
62.8%
6.2%
9.0%
10.5%
1.9%
1.1%
0.8%
Increase awareness about occupational
safety and health risks
Increase awareness of solutions to
occupational safety and health risks
Improve occupational safety and health
in the workplace
34.7%
31.4%
29.4%
29.2%
27.3%
27.1%
24.2%
25.9%
25.3%
57.7%
60.3%
62.9%
61.9%
62.3%
63.5%
64.7%
62.7%
63.5%
6.3%
6.6%
4.1%
7.9%
9.3%
8.2%
10.5%
10.7%
8.8%
1.2%
1.7%
3.5%
0.9%
1.1%
1.2%
0.5%
0.7%
2.4%
Policy Makers
Intermediaries
Other
Policy Makers
Intermediaries
Other
Policy Makers
Intermediaries
Other
Main stakeholder groupsOverall
4 Strongly agree 3 Agree 2 Disagree 1 Strongly disagree
8
2. Main attitudes towards EU-OSHA
Use and purpose of use of EU-OSHA’s work
57.5%
30.8%
29.2%
26.7%
14.5%
10.8%
4.7%
4.8%
6.6%
Address occupational safety and health issues
at enterprise or workplace level
Talked about it with others
Further research
Awareness raising purposes at European,
national or enterprise level
Guided to information from other sources
than EU-OSHA
Policy-making at national level
Policy-making at European level
Something else
Did not use the work of EU-OSHA
9
Board
Members
EU15EU13
39.6%
32.7% 31.9%
20.4%
54.7%
53.1% 57.3%
67.7%
5.3%
3.9% 7.6%
5.7% 8.8% 6.9% 4.2%
4 Very satisfied 3 Satisfied 2 Dissatisfied 1 Very dissatisfied
Focal Point
Members
2. Main attitudes towards EU-Osha
Satisfaction among Board/Focal Points members and EU13vs EU15
10
Overall
Policy Makers
Intermediaries
Other Stakeholders
Emerging risks
/foresight
Overall
Policy Makers
Intermediaries
Other Stakeholders
Overall
Policy Makers
Intermediaries
Other Stakeholders
Overall
Policy Makers
Intermediaries
Other Stakeholders
Healthy Workplaces for
All Ages Campaign
Work-related diseases
OSHwiki
2. Main attitudes towards EU-OSHA
Satisfaction EU13 vs EU 15
4 Very satisfied 3 Satisfied 2 Dissatisfied 1 Very dissatisfied
EU13 EU15
20.3%
21.7%
19.2%
14.3%
22.2%
37.9%
23.2%
12.5%
25.0%
33.3%
22.9%
12.5%
14.5%
15.0%
12.2%
50.0%
69.6%
66.7%
68.7%
71.4%
66.7%
58.6%
66.7%
75.0%
68.8%
64.3%
71.1%
75.0%
74.2%
77.5%
79.3%
50.0%
7.6%
10.0%
10.1%
14.3%
11.1%
3.4%
10.1%
12.5%
3.1%
3.6%
12.5%
11.3%
7.5%
8.5%
2.5%
1.7%
2.0%
3.1%
2.4%
2.4%
11.4%
9.5%
7.8%
9.9%
14.1%
7.2%
11.4%
9.5%
26.4%
15.1%
19.1%
16.6%
8.7%
5.6%
10.1%
6.5%
77.1%
76.3%
79.2%
76.7%
76.6%
79.3%
73.1%
77.6%
66.0%
70.7%
68.8%
70.3%
89.1%
83.1%
78.7%
83.9%
11.4%
12.8%
12.0%
12.3%
9.4%
12.1%
13.0%
11.6%
7.5%
13.4%
11.0%
12.4%
2.2%
10.5%
10.6%
9.0%
1.4%
1.0%
1.1%
1.4%
2.6%
1.3%
0.8%
1.2%
0.7%
0.8%
0.5%
0.6%
11
Overall
Policy Makers
Intermediaries
Other Stakeholders
Costs and benefits of
OSH
Overall
Policy Makers
Intermediaries
Other Stakeholders
Overall
Policy Makers
Intermediaries
Other Stakeholders
Overall
Policy Makers
Intermediaries
Other Stakeholders
Micro and small
enterprises
Online interactive Risk
Assessment tools
(OiRA)
Enterprise survey
ESENER 19.8%
26.2%
20.0%
9.9%
11.1%
8.3%
14.3%
14.3%
16.9%
15.4%
11.5%
11.4%
9.7%
75.0%
75.3%
67.7%
72.4%
100.0%
76.1%
75.6%
77.4%
71.4%
73.8%
69.5%
73.1%
100.0%
71.2%
77.1%
75.8%
25.0%
3.7%
4.6%
5.7%
11.3%
6.7%
10.7%
14.3%
10.7%
11.9%
10.6%
15.4%
8.6%
12.9%
1.2%
1.5%
1.9%
2.8%
6.7%
3.6%
1.2%
1.7%
1.0%
1.9%
2.9%
1.6%
7.5%
9.8%
12.6%
10.7%
6.8%
6.1%
7.4%
6.5%
6.4%
6.2%
8.1%
6.4%
14.0%
5.5%
8.4%
7.4%
87.5%
77.7%
77.7%
78.3%
79.5%
75.3%
76.6%
75.9%
74.5%
76.2%
73.3%
75.9%
72.0%
77.3%
75.7%
76.9%
5.0%
9.2%
6.3%
8.2%
13.6%
15.4%
13.8%
15.0%
14.9%
16.5%
18.0%
16.4%
14.0%
15.9%
14.9%
14.5%
3.3%
3.4%
2.8%
3.2%
2.1%
2.7%
4.3%
1.1%
0.6%
1.4%
1.3%
1.0%
1.2%
2. Main attitudes towards EU-OSHA
Satisfaction EU13 vs EU15
4 Very satisfied 3 Satisfied 2 Dissatisfied 1 Very dissatisfied
EU13 EU15
12
Satisfaction Board members vs Focal Point members
Emerging risks/foresight
Healthy Workplaces for All Ages Campaign
Work-related diseases
OSHwiki
Costs and benefits of OSH
Micro and small enterprises
Online interactive Risk Assessment tools (OiRA)
Enterprise survey ESENER 15.8%
7.5%
17.1%
10.8%
10.6%
15.6%
30.6%
10.6%
75.4%
75.0%
75.6%
89.2%
72.3%
78.1%
63.9%
83.0%
5.3%
10.0%
7.3%
12.8%
6.3%
2.8%
6.4%
3.5%
7.5%
4.3%
2.8%
30.0%
5.0%
12.0%
5.6%
44.4%
14.3%
22.7%
60.0%
85.0%
68.0%
72.2%
86.4%
44.4%
81.0%
72.7%
10.0%
5.0%
20.0%
16.7%
13.6%
11.1%
4.8%
4.5%
5.0%
5.6%
4 Very satisfied 3 Satisfied 2 Dissatisfied 1 Very dissatisfied
Board
Members
Focal Point
Members
2. Main attitudes towards EU-OSHA
13
3. Familiarity with EU-OSHA’s activities
8.2%
7.8%
7.5%
12.8%
9.9%
12.3%
19.1%
15.9%
21.5%
25.5%
34.8%
31.0%
44.1%
46.0%
39.9%
52.5%
29.1%
34.3%
37.0%
36.9%
36.7%
31.1%
29.9%
27.3%
41.2%
32.4%
20.7%
19.2%
9.3%
10.5%
11.1%
4.3%
Enterprise survey ESENER
OSHwiki
Micro and small enterprises
Online interactive Risk Assessment tools (OiRA)
Emerging risks/foresight
Costs and benefits of OSH
Healthy Workplaces for All Ages Campaign
Work-related diseases
6.0%
6.0%
30.0%
17.0%
8.0%
21.0%
15.0%
20.0%
37.0%
35.0%
30.0%
38.0%
26.0%
33.0%
24.0%
39.0%
38.0%
29.0%
52.0%
41.0%
8.0%
9.0%
24.0%
11.0%
20162018
Overall
4 Very familiar 3 Quite familiar 2 Just a little familiar 1 Not familiar
14
12.9%
10.8%
10.6%
17.0%
14.0%
15.7%
26.4%
21.9%
27.9%
27.3%
37.6%
32.6%
47.2%
46.0%
40.6%
50.6%
26.8%
33.5%
32.6%
33.5%
30.3%
28.4%
24.2%
23.8%
32.4%
28.4%
19.2%
17.0%
8.5%
9.8%
8.7%
3.6%
Policy Makers
Work-related diseases
Healthy Workplaces for All Ages Campaign
Costs and benefits of OSH
Emerging risks/foresight
Online interactive Risk Assessment tools (OiRA)
Micro and small enterprises
OSHwiki
Enterprise survey ESENER 7.2%
6.5%
6.7%
12.3%
8.8%
12.0%
18.6%
14.1%
21.3%
27.1%
35.8%
31.5%
44.6%
46.3%
40.8%
53.7%
30.3%
35.0%
37.3%
37.1%
38.3%
31.8%
30.3%
28.1%
41.2%
31.4%
20.2%
19.1%
8.3%
10.0%
10.3%
4.1%
Workplace
Intermediaries
5.3%
6.5%
5.9%
8.8%
6.5%
8.2%
14.7%
12.9%
15.3%
14.7%
30.0%
27.1%
39.4%
41.8%
35.9%
52.4%
27.1%
29.4%
35.9%
40.0%
40.0%
35.9%
33.5%
30.0%
52.4%
49.4%
28.2%
24.1%
14.1%
14.1%
15.9%
4.7%
Other Stakeholders
4 Very familiar 3 Quite familiar 2 Just a little familiar 1 Not familiar
3. Familiarity with EU-OSHA’s activities
Main stakeholder groups
15
Overall
Policy Makers
Intermediaries
Other Stakeholders
3. Familiarity with EU-OSHA activities
EU13 vs EU15
Work-related diseases
Overall
Policy Makers
Intermediaries
Other Stakeholders
Overall
Policy Makers
Intermediaries
Other Stakeholders
Overall
Policy Makers
Intermediaries
Other Stakeholders
Healthy Workplaces for
All Ages Campaign
Costs and benefits of
OSH
Emerging risks
/foresight 10.8%
15.2%
12.1%
7.1%
16.8%
19.2%
15.5%
21.4%
31.4%
44.0%
32.8%
14.3%
20.5%
29.6%
22.4%
57.1%
56.2%
59.2%
56.5%
35.7%
47.0%
51.2%
48.7%
21.4%
44.3%
40.0%
43.1%
42.9%
52.4%
51.2%
52.2%
42.9%
26.5%
20.8%
25.9%
28.6%
28.1%
25.6%
28.0%
57.1%
18.9%
14.4%
19.8%
42.9%
23.2%
17.6%
22.4%
6.5%
4.8%
5.6%
28.6%
8.1%
4.0%
7.8%
5.4%
1.6%
4.3%
3.8%
1.6%
3.0%
7.6%
8.7%
13.9%
9.8%
9.1%
10.7%
15.2%
11.6%
16.7%
18.3%
24.7%
18.6%
13.6%
12.9%
20.8%
14.8%
40.9%
44.3%
46.4%
43.8%
43.2%
45.6%
44.7%
44.8%
37.1%
40.7%
41.0%
39.9%
50.8%
52.4%
49.3%
51.0%
36.4%
38.8%
30.6%
36.8%
35.6%
33.0%
28.7%
32.1%
30.3%
30.4%
24.1%
29.6%
31.1%
30.5%
25.6%
29.7%
15.2%
8.2%
9.1%
9.6%
12.1%
10.8%
11.4%
11.5%
15.9%
10.6%
10.2%
11.8%
4.5%
4.2%
4.2%
4.5%
4 Very familiar 3 Quite familiar 2 Just a little familiar 1 Not familiar
EU13 EU15
16
Overall
Policy Makers
Intermediaries
Other Stakeholders
Online interactive Risk
Assessment tools
(OiRA)
Overall
Policy Makers
Intermediaries
Other Stakeholders
Overall
Policy Makers
Intermediaries
Other Stakeholders
Overall
Policy Makers
Intermediaries
Other Stakeholders
Micro and small
enterprises
OSHwiki
Enterprise survey
ESENER 13.0%
22.4%
13.8%
14.3%
14.6%
20.8%
16.4%
7.1%
14.6%
20.8%
15.9%
21.4%
25.4%
28.0%
25.9%
21.4%
38.9%
40.8%
38.8%
7.1%
37.8%
34.4%
34.9%
42.9%
44.3%
42.4%
43.5%
28.6%
37.8%
45.6%
37.9%
35.7%
27.6%
27.2%
28.4%
35.7%
30.8%
30.4%
31.5%
35.7%
33.0%
32.0%
32.8%
35.7%
28.1%
17.6%
26.7%
42.9%
20.5%
9.6%
19.0%
42.9%
16.8%
14.4%
17.2%
14.3%
8.1%
4.8%
7.8%
14.3%
8.6%
8.8%
9.5%
6.8%
6.8%
11.9%
7.9%
6.8%
5.5%
9.2%
6.9%
6.8%
5.8%
9.1%
6.6%
9.1%
10.6%
15.2%
11.4%
15.9%
18.7%
26.2%
19.3%
17.4%
26.1%
26.8%
24.8%
31.1%
34.5%
37.0%
33.6%
27.3%
30.3%
29.1%
29.4%
25.0%
29.5%
24.7%
27.6%
25.0%
34.2%
32.2%
33.0%
34.8%
37.2%
31.4%
36.7%
39.4%
37.6%
35.5%
37.6%
52.3%
45.0%
37.2%
45.2%
50.8%
34.2%
31.8%
35.4%
27.3%
22.5%
22.5%
23.1%
24.2%
21.5%
20.2%
21.6%
3. Familiarity with EU-OSHA activities
EU 13 vs EU 15 EU13 EU15
4 Very familiar 3 Quite familiar 2 Just a little familiar 1 Not familiar
17
Board members and Focal Point members
Emerging risks/foresight
Healthy Workplaces for All Ages Campaign
Work-related diseases
OSHwiki
Costs and benefits of OSH
Micro and small enterprises
Online interactive Risk Assessment tools (OiRA)
Enterprise survey ESENER 19.5%
27.4%
15.0%
19.5%
16.8%
23.9%
37.2%
22.1%
37.2%
35.4%
50.4%
49.6%
33.6%
54.0%
39.8%
50.4%
22.1%
25.7%
23.9%
23.9%
22.1%
19.5%
17.7%
23.0%
21.2%
11.5%
10.6%
7.1%
27.4%
2.7%
5.3%
4.4%
30.2%
34.0%
22.6%
22.6%
15.1%
28.3%
50.9%
22.6%
41.5%
34.0%
41.5%
43.4%
37.7%
52.8%
34.0%
58.5%
15.1%
26.4%
30.2%
26.4%
34.0%
17.0%
13.2%
17.0%
13.2%
5.7%
5.7%
7.5%
13.2%
1.9%
1.9%
1.9%
4 Very familiar 3 Quite familiar 2 Just a little familiar 1 Not familiar
Board
Members
Focal Point
Members
3. Familiarity with EU-OSHA’s activities
18
77.2%
80.8%
80.1%
81.8%
80.2%
82.7%
86.7%
85.5%
88.3%
87.9%
89.5%
88.6%
92.7%
93.9%
95.0%
95.5%
91.4%
90.6%
87.9%
97.2%
97.4%
93.3%
91.6%
98.4%
Online interactive Risk Assessment tools (OiRA)
Micro and small enterprises
Costs and benefits of OSH
OSHwiki
Work-related diseases
Healthy Workplaces for All Ages Campaign
Enterprise survey ESENER
Emerging risks/foresight
Very familiar Quite familiar Just a little familiar
3. Familiarity with EU-OSHA’s activities
Correlation between familiarity and satisfaction
19
87.0%
84.5%
75.9%
91.3%
92.1%
90.1%
85.3%
97.6%
90.5%
94.6%
95.8%
96.8%
Micro and small enterprises
Online interactive Risk Assessment tools
(OiRA)
OSHwiki
Emerging risks/foresight
Very familiar Quite familiar Just a little familiar
3. Familiarity with EU-OSHA’s activities
Correlation between familiarity …
69.7%
62.0%
82.5%
86.3%
84.3%
85.7%
82.4%
87.1%
97.2%
Costs and benefits of OSH
Emerging risks/foresight
OSHwiki
Very familiar Quite familiar Just a little familiar
Relevance Reliability
20
63.0%
52.5%
73.5%
62.2%
55.3%
85.1%
66.7%
67.7%
90.3%
OSHwiki
Emerging risks/foresight
Online interactive Risk Assessment tools
(OiRA)
Very familiar Quite familiar Just a little familiar
3. Familiarity with EU-OSHA’s activities
Correlation between familiarity …
Uniqueness Added value
61.0%
81.8%
80.2%
74.0%
89.5%
88.3%
81.4%
88.9%
90.6%
Healthy Workplaces for All Ages
Campaign
Online interactive Risk Assessment
tools (OiRA)
Micro and small enterprises
Very familiar Quite familiar Just a little familiar
21
82.8%
93.6%
81.2%
93.3%
73.9%
91.2%
67.3%
88.0%
No
Yes
No
Yes
No
Yes
No
Yes
Enterprise
surveyESENER
Emerging
risks/foresight
Work-related
diseases
Microand
small
enterprises
Use
4. Satisfaction and use
Correlation between satisfaction and use
22

EU-OSHA Stakeholder Satisfaction Survey 2018

  • 1.
    1 EU-OSHA Stakeholder SatisfactionSurvey 2018 results Prepared on behalf of EU-OSHA by GfK Social & Strategic Research © GfK SSR February 18, 2019 | EU-OSHA Stakeholder Satisfaction Survey 2018
  • 2.
    2 Residence of respondents(with at least 20 respondents per country) 1. Survey respondent profiles 265 192 168 106 96 93 73 58 57 40 40 36 27 26 23 21 20 86% 14% EU Member States Other countries Residence of respondents (EU vs. Non-EU)
  • 3.
    3 10% 1% 1% 1% 1% 2% 2% 2% 2% 2% 3% 5% 12% 13% 15% 20% 22% Other Employers Association (European) StatutoryInsurance Organisation Journalist/media organisation Trade Union (European) International public body Employers Association (national) EU institution or body EU-level network, NGO or association National NGO (non-governmental organisation) National policy-making organisation Trade Union (national) University/research or expert institute OSH Service Provider, e.g. consultant National public body (incl. labour inspectorate) Private company (SME) Private company (large enterprise) 84% 47% 10% workplace intermediaries policy makers other Note: some stakeholder subcategories are considered both workplace intermediaries and policy makers. Stakeholder subcategories included in the group “policy makers” are: international public bodies, EU Institutions or bodies, national policy-making organisations, national public bodies, EU-level networks/NGOs/associations, European employer associations, European trade unions, national trade unions and national employer associations. Stakeholder subcategories included in the group “workplace intermediaries” are: national NGOs, EU-level networks/NGOs/associations, national public bodies, European employers associations, European trade unions, national trade unions, national employers associations, statutory insurance organisations, OSH Service providers, Journalist/media organisations, large private companies and small or micro companies. 1. Survey respondent profiles Broad stakeholder groups Stakeholder categories
  • 4.
    4 2. Main attitudestowards EU-OSHA Overall satisfaction
  • 5.
    5 Overall 2. Main attitudestowards EU-Osha 7.5% 13.0% 9.4% 10.2% 13.9% 10.6% 65.4% 75.0% 73.2% 67.4% 63.4% 66.5% 25.4% 11.0% 15.9% 20.4% 20.7% 21.4% 2018 EU-OSHA performs well as an organization. 2016 EU-OSHA performs well as an organization. The work of EU-OSHA addresses the right priorities on OSH. The work of EU-OSHA adds value to the work on OSH done by others, for example by national organisations. EU-OSHA guides me to the knowledge I need on OSH. EU-OSHA guides me to the knowledge I need on OSH. strongly disagree disagree agree strongly agree
  • 6.
    6 6.6% 7.6% 7.6%8.7% 10.1% 7.1% 9.2% 10.5% 12.9% 14.3% 15.0% 8.2% 10.8% 11.5% 8.2% 63.7% 66.5% 66.9% 70.1% 73.8% 78.8% 65.7% 67.8% 67.6% 61.5% 63.9% 65.3% 64.2% 67.1% 70.0% 28.1% 24.2% 24.8% 19.9% 14.6% 11.8% 23.3% 19.4% 18.8% 22.5% 19.2% 24.7% 23.6% 20.0% 20.6% PolicyMakers Intermediaries Other PolicyMakers Intermediaries OtherStakeholders PolicyMakers Intermediaries Other PolicyMakers Intermediaries Other PolicyMakers Intermediaries Other EU-OSHA performs well as an organization. The work of EU-OSHA addresses the right priorities on OSH. The work of EU-OSHA adds value to the work on OSH done by others, for example by national organisations. EU-OSHA guides me to the knowledge I need on OSH. EU-OSHA provides access to relevant research based knowledge on OSH. strongly disagree disagree agree strongly agree Main stakeholder groups 2. Main attitudes towards EU-OSHA
  • 7.
    7 2. Main attitudestowards EU-OSHA Contribution of EU-Osha to OSH awareness and solutions 32.4% 28.1% 25.8% 59.5% 61.9% 62.8% 6.2% 9.0% 10.5% 1.9% 1.1% 0.8% Increase awareness about occupational safety and health risks Increase awareness of solutions to occupational safety and health risks Improve occupational safety and health in the workplace 34.7% 31.4% 29.4% 29.2% 27.3% 27.1% 24.2% 25.9% 25.3% 57.7% 60.3% 62.9% 61.9% 62.3% 63.5% 64.7% 62.7% 63.5% 6.3% 6.6% 4.1% 7.9% 9.3% 8.2% 10.5% 10.7% 8.8% 1.2% 1.7% 3.5% 0.9% 1.1% 1.2% 0.5% 0.7% 2.4% Policy Makers Intermediaries Other Policy Makers Intermediaries Other Policy Makers Intermediaries Other Main stakeholder groupsOverall 4 Strongly agree 3 Agree 2 Disagree 1 Strongly disagree
  • 8.
    8 2. Main attitudestowards EU-OSHA Use and purpose of use of EU-OSHA’s work 57.5% 30.8% 29.2% 26.7% 14.5% 10.8% 4.7% 4.8% 6.6% Address occupational safety and health issues at enterprise or workplace level Talked about it with others Further research Awareness raising purposes at European, national or enterprise level Guided to information from other sources than EU-OSHA Policy-making at national level Policy-making at European level Something else Did not use the work of EU-OSHA
  • 9.
    9 Board Members EU15EU13 39.6% 32.7% 31.9% 20.4% 54.7% 53.1% 57.3% 67.7% 5.3% 3.9%7.6% 5.7% 8.8% 6.9% 4.2% 4 Very satisfied 3 Satisfied 2 Dissatisfied 1 Very dissatisfied Focal Point Members 2. Main attitudes towards EU-Osha Satisfaction among Board/Focal Points members and EU13vs EU15
  • 10.
    10 Overall Policy Makers Intermediaries Other Stakeholders Emergingrisks /foresight Overall Policy Makers Intermediaries Other Stakeholders Overall Policy Makers Intermediaries Other Stakeholders Overall Policy Makers Intermediaries Other Stakeholders Healthy Workplaces for All Ages Campaign Work-related diseases OSHwiki 2. Main attitudes towards EU-OSHA Satisfaction EU13 vs EU 15 4 Very satisfied 3 Satisfied 2 Dissatisfied 1 Very dissatisfied EU13 EU15 20.3% 21.7% 19.2% 14.3% 22.2% 37.9% 23.2% 12.5% 25.0% 33.3% 22.9% 12.5% 14.5% 15.0% 12.2% 50.0% 69.6% 66.7% 68.7% 71.4% 66.7% 58.6% 66.7% 75.0% 68.8% 64.3% 71.1% 75.0% 74.2% 77.5% 79.3% 50.0% 7.6% 10.0% 10.1% 14.3% 11.1% 3.4% 10.1% 12.5% 3.1% 3.6% 12.5% 11.3% 7.5% 8.5% 2.5% 1.7% 2.0% 3.1% 2.4% 2.4% 11.4% 9.5% 7.8% 9.9% 14.1% 7.2% 11.4% 9.5% 26.4% 15.1% 19.1% 16.6% 8.7% 5.6% 10.1% 6.5% 77.1% 76.3% 79.2% 76.7% 76.6% 79.3% 73.1% 77.6% 66.0% 70.7% 68.8% 70.3% 89.1% 83.1% 78.7% 83.9% 11.4% 12.8% 12.0% 12.3% 9.4% 12.1% 13.0% 11.6% 7.5% 13.4% 11.0% 12.4% 2.2% 10.5% 10.6% 9.0% 1.4% 1.0% 1.1% 1.4% 2.6% 1.3% 0.8% 1.2% 0.7% 0.8% 0.5% 0.6%
  • 11.
    11 Overall Policy Makers Intermediaries Other Stakeholders Costsand benefits of OSH Overall Policy Makers Intermediaries Other Stakeholders Overall Policy Makers Intermediaries Other Stakeholders Overall Policy Makers Intermediaries Other Stakeholders Micro and small enterprises Online interactive Risk Assessment tools (OiRA) Enterprise survey ESENER 19.8% 26.2% 20.0% 9.9% 11.1% 8.3% 14.3% 14.3% 16.9% 15.4% 11.5% 11.4% 9.7% 75.0% 75.3% 67.7% 72.4% 100.0% 76.1% 75.6% 77.4% 71.4% 73.8% 69.5% 73.1% 100.0% 71.2% 77.1% 75.8% 25.0% 3.7% 4.6% 5.7% 11.3% 6.7% 10.7% 14.3% 10.7% 11.9% 10.6% 15.4% 8.6% 12.9% 1.2% 1.5% 1.9% 2.8% 6.7% 3.6% 1.2% 1.7% 1.0% 1.9% 2.9% 1.6% 7.5% 9.8% 12.6% 10.7% 6.8% 6.1% 7.4% 6.5% 6.4% 6.2% 8.1% 6.4% 14.0% 5.5% 8.4% 7.4% 87.5% 77.7% 77.7% 78.3% 79.5% 75.3% 76.6% 75.9% 74.5% 76.2% 73.3% 75.9% 72.0% 77.3% 75.7% 76.9% 5.0% 9.2% 6.3% 8.2% 13.6% 15.4% 13.8% 15.0% 14.9% 16.5% 18.0% 16.4% 14.0% 15.9% 14.9% 14.5% 3.3% 3.4% 2.8% 3.2% 2.1% 2.7% 4.3% 1.1% 0.6% 1.4% 1.3% 1.0% 1.2% 2. Main attitudes towards EU-OSHA Satisfaction EU13 vs EU15 4 Very satisfied 3 Satisfied 2 Dissatisfied 1 Very dissatisfied EU13 EU15
  • 12.
    12 Satisfaction Board membersvs Focal Point members Emerging risks/foresight Healthy Workplaces for All Ages Campaign Work-related diseases OSHwiki Costs and benefits of OSH Micro and small enterprises Online interactive Risk Assessment tools (OiRA) Enterprise survey ESENER 15.8% 7.5% 17.1% 10.8% 10.6% 15.6% 30.6% 10.6% 75.4% 75.0% 75.6% 89.2% 72.3% 78.1% 63.9% 83.0% 5.3% 10.0% 7.3% 12.8% 6.3% 2.8% 6.4% 3.5% 7.5% 4.3% 2.8% 30.0% 5.0% 12.0% 5.6% 44.4% 14.3% 22.7% 60.0% 85.0% 68.0% 72.2% 86.4% 44.4% 81.0% 72.7% 10.0% 5.0% 20.0% 16.7% 13.6% 11.1% 4.8% 4.5% 5.0% 5.6% 4 Very satisfied 3 Satisfied 2 Dissatisfied 1 Very dissatisfied Board Members Focal Point Members 2. Main attitudes towards EU-OSHA
  • 13.
    13 3. Familiarity withEU-OSHA’s activities 8.2% 7.8% 7.5% 12.8% 9.9% 12.3% 19.1% 15.9% 21.5% 25.5% 34.8% 31.0% 44.1% 46.0% 39.9% 52.5% 29.1% 34.3% 37.0% 36.9% 36.7% 31.1% 29.9% 27.3% 41.2% 32.4% 20.7% 19.2% 9.3% 10.5% 11.1% 4.3% Enterprise survey ESENER OSHwiki Micro and small enterprises Online interactive Risk Assessment tools (OiRA) Emerging risks/foresight Costs and benefits of OSH Healthy Workplaces for All Ages Campaign Work-related diseases 6.0% 6.0% 30.0% 17.0% 8.0% 21.0% 15.0% 20.0% 37.0% 35.0% 30.0% 38.0% 26.0% 33.0% 24.0% 39.0% 38.0% 29.0% 52.0% 41.0% 8.0% 9.0% 24.0% 11.0% 20162018 Overall 4 Very familiar 3 Quite familiar 2 Just a little familiar 1 Not familiar
  • 14.
    14 12.9% 10.8% 10.6% 17.0% 14.0% 15.7% 26.4% 21.9% 27.9% 27.3% 37.6% 32.6% 47.2% 46.0% 40.6% 50.6% 26.8% 33.5% 32.6% 33.5% 30.3% 28.4% 24.2% 23.8% 32.4% 28.4% 19.2% 17.0% 8.5% 9.8% 8.7% 3.6% Policy Makers Work-related diseases HealthyWorkplaces for All Ages Campaign Costs and benefits of OSH Emerging risks/foresight Online interactive Risk Assessment tools (OiRA) Micro and small enterprises OSHwiki Enterprise survey ESENER 7.2% 6.5% 6.7% 12.3% 8.8% 12.0% 18.6% 14.1% 21.3% 27.1% 35.8% 31.5% 44.6% 46.3% 40.8% 53.7% 30.3% 35.0% 37.3% 37.1% 38.3% 31.8% 30.3% 28.1% 41.2% 31.4% 20.2% 19.1% 8.3% 10.0% 10.3% 4.1% Workplace Intermediaries 5.3% 6.5% 5.9% 8.8% 6.5% 8.2% 14.7% 12.9% 15.3% 14.7% 30.0% 27.1% 39.4% 41.8% 35.9% 52.4% 27.1% 29.4% 35.9% 40.0% 40.0% 35.9% 33.5% 30.0% 52.4% 49.4% 28.2% 24.1% 14.1% 14.1% 15.9% 4.7% Other Stakeholders 4 Very familiar 3 Quite familiar 2 Just a little familiar 1 Not familiar 3. Familiarity with EU-OSHA’s activities Main stakeholder groups
  • 15.
    15 Overall Policy Makers Intermediaries Other Stakeholders 3.Familiarity with EU-OSHA activities EU13 vs EU15 Work-related diseases Overall Policy Makers Intermediaries Other Stakeholders Overall Policy Makers Intermediaries Other Stakeholders Overall Policy Makers Intermediaries Other Stakeholders Healthy Workplaces for All Ages Campaign Costs and benefits of OSH Emerging risks /foresight 10.8% 15.2% 12.1% 7.1% 16.8% 19.2% 15.5% 21.4% 31.4% 44.0% 32.8% 14.3% 20.5% 29.6% 22.4% 57.1% 56.2% 59.2% 56.5% 35.7% 47.0% 51.2% 48.7% 21.4% 44.3% 40.0% 43.1% 42.9% 52.4% 51.2% 52.2% 42.9% 26.5% 20.8% 25.9% 28.6% 28.1% 25.6% 28.0% 57.1% 18.9% 14.4% 19.8% 42.9% 23.2% 17.6% 22.4% 6.5% 4.8% 5.6% 28.6% 8.1% 4.0% 7.8% 5.4% 1.6% 4.3% 3.8% 1.6% 3.0% 7.6% 8.7% 13.9% 9.8% 9.1% 10.7% 15.2% 11.6% 16.7% 18.3% 24.7% 18.6% 13.6% 12.9% 20.8% 14.8% 40.9% 44.3% 46.4% 43.8% 43.2% 45.6% 44.7% 44.8% 37.1% 40.7% 41.0% 39.9% 50.8% 52.4% 49.3% 51.0% 36.4% 38.8% 30.6% 36.8% 35.6% 33.0% 28.7% 32.1% 30.3% 30.4% 24.1% 29.6% 31.1% 30.5% 25.6% 29.7% 15.2% 8.2% 9.1% 9.6% 12.1% 10.8% 11.4% 11.5% 15.9% 10.6% 10.2% 11.8% 4.5% 4.2% 4.2% 4.5% 4 Very familiar 3 Quite familiar 2 Just a little familiar 1 Not familiar EU13 EU15
  • 16.
    16 Overall Policy Makers Intermediaries Other Stakeholders Onlineinteractive Risk Assessment tools (OiRA) Overall Policy Makers Intermediaries Other Stakeholders Overall Policy Makers Intermediaries Other Stakeholders Overall Policy Makers Intermediaries Other Stakeholders Micro and small enterprises OSHwiki Enterprise survey ESENER 13.0% 22.4% 13.8% 14.3% 14.6% 20.8% 16.4% 7.1% 14.6% 20.8% 15.9% 21.4% 25.4% 28.0% 25.9% 21.4% 38.9% 40.8% 38.8% 7.1% 37.8% 34.4% 34.9% 42.9% 44.3% 42.4% 43.5% 28.6% 37.8% 45.6% 37.9% 35.7% 27.6% 27.2% 28.4% 35.7% 30.8% 30.4% 31.5% 35.7% 33.0% 32.0% 32.8% 35.7% 28.1% 17.6% 26.7% 42.9% 20.5% 9.6% 19.0% 42.9% 16.8% 14.4% 17.2% 14.3% 8.1% 4.8% 7.8% 14.3% 8.6% 8.8% 9.5% 6.8% 6.8% 11.9% 7.9% 6.8% 5.5% 9.2% 6.9% 6.8% 5.8% 9.1% 6.6% 9.1% 10.6% 15.2% 11.4% 15.9% 18.7% 26.2% 19.3% 17.4% 26.1% 26.8% 24.8% 31.1% 34.5% 37.0% 33.6% 27.3% 30.3% 29.1% 29.4% 25.0% 29.5% 24.7% 27.6% 25.0% 34.2% 32.2% 33.0% 34.8% 37.2% 31.4% 36.7% 39.4% 37.6% 35.5% 37.6% 52.3% 45.0% 37.2% 45.2% 50.8% 34.2% 31.8% 35.4% 27.3% 22.5% 22.5% 23.1% 24.2% 21.5% 20.2% 21.6% 3. Familiarity with EU-OSHA activities EU 13 vs EU 15 EU13 EU15 4 Very familiar 3 Quite familiar 2 Just a little familiar 1 Not familiar
  • 17.
    17 Board members andFocal Point members Emerging risks/foresight Healthy Workplaces for All Ages Campaign Work-related diseases OSHwiki Costs and benefits of OSH Micro and small enterprises Online interactive Risk Assessment tools (OiRA) Enterprise survey ESENER 19.5% 27.4% 15.0% 19.5% 16.8% 23.9% 37.2% 22.1% 37.2% 35.4% 50.4% 49.6% 33.6% 54.0% 39.8% 50.4% 22.1% 25.7% 23.9% 23.9% 22.1% 19.5% 17.7% 23.0% 21.2% 11.5% 10.6% 7.1% 27.4% 2.7% 5.3% 4.4% 30.2% 34.0% 22.6% 22.6% 15.1% 28.3% 50.9% 22.6% 41.5% 34.0% 41.5% 43.4% 37.7% 52.8% 34.0% 58.5% 15.1% 26.4% 30.2% 26.4% 34.0% 17.0% 13.2% 17.0% 13.2% 5.7% 5.7% 7.5% 13.2% 1.9% 1.9% 1.9% 4 Very familiar 3 Quite familiar 2 Just a little familiar 1 Not familiar Board Members Focal Point Members 3. Familiarity with EU-OSHA’s activities
  • 18.
    18 77.2% 80.8% 80.1% 81.8% 80.2% 82.7% 86.7% 85.5% 88.3% 87.9% 89.5% 88.6% 92.7% 93.9% 95.0% 95.5% 91.4% 90.6% 87.9% 97.2% 97.4% 93.3% 91.6% 98.4% Online interactive RiskAssessment tools (OiRA) Micro and small enterprises Costs and benefits of OSH OSHwiki Work-related diseases Healthy Workplaces for All Ages Campaign Enterprise survey ESENER Emerging risks/foresight Very familiar Quite familiar Just a little familiar 3. Familiarity with EU-OSHA’s activities Correlation between familiarity and satisfaction
  • 19.
    19 87.0% 84.5% 75.9% 91.3% 92.1% 90.1% 85.3% 97.6% 90.5% 94.6% 95.8% 96.8% Micro and smallenterprises Online interactive Risk Assessment tools (OiRA) OSHwiki Emerging risks/foresight Very familiar Quite familiar Just a little familiar 3. Familiarity with EU-OSHA’s activities Correlation between familiarity … 69.7% 62.0% 82.5% 86.3% 84.3% 85.7% 82.4% 87.1% 97.2% Costs and benefits of OSH Emerging risks/foresight OSHwiki Very familiar Quite familiar Just a little familiar Relevance Reliability
  • 20.
    20 63.0% 52.5% 73.5% 62.2% 55.3% 85.1% 66.7% 67.7% 90.3% OSHwiki Emerging risks/foresight Online interactiveRisk Assessment tools (OiRA) Very familiar Quite familiar Just a little familiar 3. Familiarity with EU-OSHA’s activities Correlation between familiarity … Uniqueness Added value 61.0% 81.8% 80.2% 74.0% 89.5% 88.3% 81.4% 88.9% 90.6% Healthy Workplaces for All Ages Campaign Online interactive Risk Assessment tools (OiRA) Micro and small enterprises Very familiar Quite familiar Just a little familiar
  • 21.
  • 22.