This document analyzes changes in the teff value chain in Ethiopia based on survey data. It finds that over the past 10 years:
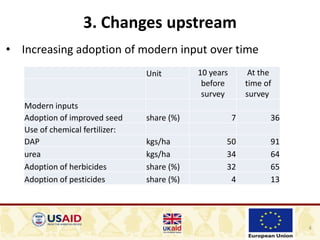
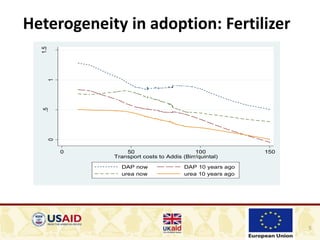
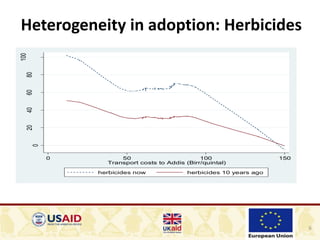
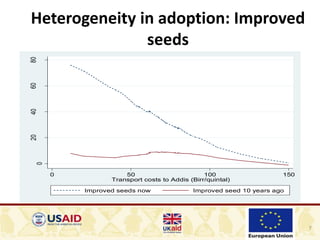
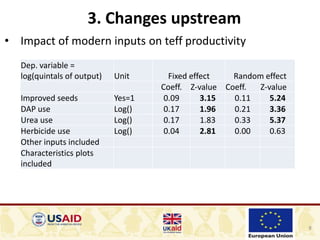
1) Adoption of modern inputs like improved seeds, fertilizers, herbicides and pesticides by farmers has increased, leading to higher productivity, though adoption remains low in remote areas.
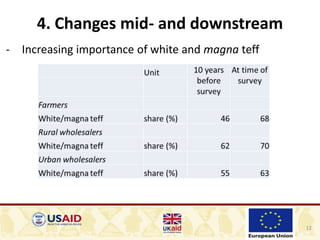
2) Demand for higher quality white and magna teff varieties has grown in urban areas.
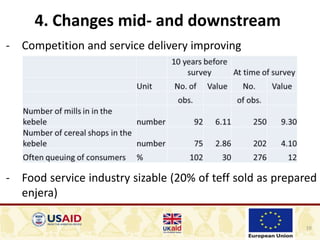
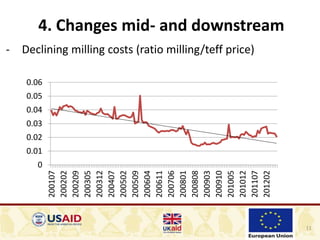
3) Processing and retail have transformed, with the emergence of one-stop shops providing milling, cleaning and prepared food, and declining milling costs.
However, the transformation of teff production and marketing remains at an early stage, with opportunities remaining to further increase yields