Telenor Group customer data strategy under 40 chars
•
2 likes•1,091 views

Telenor is a major mobile operator with over 150 million subscribers across Europe and Asia. It holds a 35.66% stake in VimpelCom Ltd, which operates in various markets in Europe, Asia, Africa, and North America, serving a total of 1.6 billion people. The document discusses Telenor's use of customer data for marketing activities, billing analysis, and gaining customer insights to better understand customer behavior and network usage. It also examines the evolution of adoption networks for various mobile devices and platforms like the iPhone and how social influences affect their diffusion over time.

Recommended
More Related Content
Featured
Featured (20)
Telenor Group customer data strategy under 40 chars
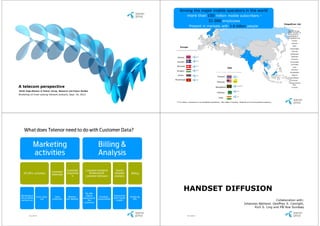
- 1. Among the major mobile operators in the world more than 150 million mobile subscribers * 31 000 employees VimpelCom Ltd. Present in markets with 1.6 billion people Telenor Group holds 35,66% of the economic ownership in VimpelCom Ltd. Russia Ukraine Italy Europe Kazakhstan Georgia Uzbekistan Tajikistan Norway Armenia Sweden Kyrgyzstan C ambodia Denmark Laos Asia Pakistan Hungary Bangladesh Serbia Algeria Thailand Zimbabwe Montenegro Burundi Malaysia C entral African Rep. A telecom perspective Bangladesh C anada Kenth Engø-Monsen @ Telenor Group, Research and Future Studies Pakistan Workshop on time-varying network analysis, Sept. 19, 2012 India *151 million customers in consolidated operations ; 360 million including VimpelCom Ltd (associated company) What does Telenor need to do with Customer Data? Marketing Billing & activities Analysis Customer Customer Insight & Social Customer ATL/BTL-activities acquisitio Prediction of network Billing retention n customer behavior analysis The 360- HANDSET DIFFUSION Marketing of degree Context/net Cross- & Up- Churn Member- Attribute- Producing new products dissection of work-based sell prediction Get-Member based insight bills and services the insight! Collaboration with: customers Johannes Bjelland, Geoffrey S. Canright, Rich S. Ling and Pål Roe Sundsøy 2 0 1 2.09.1 9 2 0 1 2.09.1 9
- 2. Anonymized CDR data—our starting point It is practical to define the adoption network A number - Caller 1 2 3 Date & time B number – Receiving party Type: Call, SMS, Data volume Data, etc Cell_ID: Location IMSI: SIM card Social network Social network + Adoption network adoption history TAC: Handset 5 2 0 1 2.09.1 9 The iPhone adoption network evolution The iPhone adoption network evolution Q307 Q407 Q108 Q208 Q308 Q408 Q109 Q209 Q309 2G release 3G release 3GS release in US 39% 28% 50% 27% 38% 39% 0.1% 29% 27% Mass advertising NI: 36.7% NI: 36.9% NI: 44.7% NI: 51.3% NI: 18%% NI: 45% NI: 52% NI: 50% NI: 37% iPhone not yet available in specific market: “Cracked iPhones” bought in the 2 0 1 2.09.1 9 US. 2G 3G 3GS 2 0 1 2.09.1 9 2G 3G 3GS Much traffic in US
- 3. =iPad user with iPhone The DORO adoption network evolution =iPad user with other handset Links are social relations based on SMS+Voice Q407 Q108 Q208 Q308 Q408 Q109 Q209 Q309 “The Apple Tribe” Age distribution 5,00% 4,00% 3,00% 2,00% 1,00% 0,00% • 54% of the iPad users also uses iPhone (5% market penetration of iphone) Non-Isolates 3.5% 4% 4% 4.9% 5.1% 6% 6.8% 10% • If the iPad user is connected to another iPad user the chance of having an iPhone is 72% Adoption of the Doro handset; an individual choice? Or the choice of the user’s children who wish to be in contact with their elderly parents? Doro HandleEasy 326,328 Doro PhoneEasy 410 <25 25-55 2 0 1 2.09.1 9 2 0 1 2.09.1 9 Age: Doro HandleEasy 330 Other Doro (338,345,409) 55-70 >70 The Mobile Video Telephony network evolution iPhone users have high EVC Q307 Q407 Q108 Q208 Q308 LCC: 4.7% LCC: 5.2% LCC: 2.6% LCC: <0.01% Q408 Q109 Q209 Q309 2 0 1 2.09.1 9 2012.09.19
- 4. Apple vs. Android You do what your friends do If you have one friend with iPad, your propensity to also buy iPad will be 14 times higher. Exploit the social circle to target customers with high social product Connected Connected Connected Connected Connected Connected pressure Apple users Android users Apple users Android users Apple users Android users Q1 = launch Q2 Q3 Apple users form a ‘dense core’ of highly social users 2012.09.19 2 0 1 2.09.1 9 Building new weighted clustering measures ∑ Three factors: wt ,1 wt , 2 3 wt ,1 wt , 2 wt , 3 Geometric Connectedness C= t mean Strength of T1/2 ∑ t wt ,1 wt , 2 Relative strength of T3 to T1/2 1 wt ,1 + wt , 2 wt ,1 + wt , 2 + wt , 3 ∑ 2 t 2 + 3 at ,1at , 2 at ,3 Property: C= wt ,1 + wt , 2 Reduce to the classical unweighted version for ∑t 2 Arithmetic Mean identical weights 1 w2 + w 2 2 2 w2 + w2 + w2 ∑t 2 t,1 2 t ,2 + t ,1 t ,2 t ,3 at ,1at , 2 at , 3 3 CLUSTERING C= wt2,1 + wt2, 2 Quadratic ∑ t 2 Mean Collaboration with: T. Binh Phan and Øystein D. Fjeldstad ‘Problem’: Do we need more weighted clustering measures? 2 0 1 2.09.1 9 We need to figure out their properties! 2 0 1 2.09.1 9
- 5. The social network among customers - On-net & Off-net On-net customers Off-net customers ON-NET AND OFF-NET …. MISSING DATA Who is an attractive customer? 2 0 1 2.09.1 9 2 0 1 2.09.1 9 Challenges / questions • The ‘BIG’ question: When does a service take off? Diffusion • Who will adopt? • Time-averaging over dynamic network data (current approach) vs. true dynamic measures – Benefits / Time-evolving value? networks • The problem of missing data (on-net vs. off-net) • Multi-SIM behavior: ‘Identifying’ the same customer • What are valuable structural properties of the network (customer base)?: Structure of • Centrality of customer set social network: • Different roles: Originating and terminating CHALLENGES • Which clustering measures are important? • Competition with other network providers 2 0 1 2.09.1 9 2 0 1 2.09.1 9