
Recommended
More Related Content
Featured
Featured (20)
CSM Poster
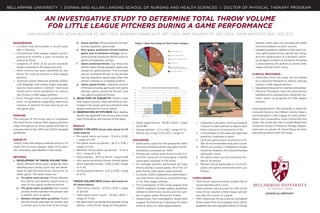
- 1. BELLARMINE UNIVERSITY | DONNA AND ALLAN LANSING SCHOOL OF NURSING AND HEALTH SCIENCES | DOCTOR OF PHYSICAL THERAPY PROGRAM AN INVESTIGATIVE STUDY TO DETERMINE TOTAL THROW VOLUME FOR LITTLE LEAGUE PITCHERS DURING A GAME PERFORMANCE JOSH BIXLER PT, DPT, KEVIN BOOTHE PT, DPT, CSCS, EDWARD FORING III PT, DPT, CSCS, MIKE FOGARTY PT, DPT, CSCS, DAVID BOYCE PT, EDD, OCS, ECS BACKGROUND d. Game pitches: Mound pitches thrown Figure 1. Mean Percentage for Each Throw Category pitched, which does not correlate with ASMI • 2 million kids participate in youth base during regulation game play. recommendations on pitch volume. ball in America. e. Non-game positional throws before 5% Pre-Game Warmup Toss • Updated guidelines related to total pitch vol- 11% • Competitive little league players partici game and in-between innings: All in- 27% ume, game speed throws, pitches per inning, Pre-Game Warmup Pitches pating 8-9 months a year increases ex field/outfield positional throws prior to and the replacement of a dynamic warm- Between Inning Warmup Pitches posure to injury. game and between innings. up program instead of excessive throwing • Upwards of 40% of all youth baseball f. Game positional throws: Any throw the Game Pitches is advocated by the authors to protect little 34% 13% players experience throwing arm pain. pitcher makes during regulation game play Non-Game Positional Throws: Before Game & In Between Innings league pitchers from injury. • Pitch volume has been identified as risk except for game pitches. This includes Game Positional Throws 10% factor for overuse injuries in little league pitcher positional throws or any throws CLINICAL RELEVANCE pitchers. during regulation game play when the • Information from this study can be utilized • American Sports Medicine Institute (ASMI), pitcher switches to a fielding position. by a physical therapist to reduce overuse USA Baseball, and United States Specialty g. Game speed throws: Collective amount injuries in little league pitchers. Sports Association (USSSA) have pub of throws including game and non-game Figure 2. Mean Game Pitches Compared to Throw Volumes • Educational resource for coaches and parents. 180 lished pitch count guidelines to reduce pitches, game positional throws, and 160 • Physical Therapists have the educational risk of injury in little league pitchers. non-game positional throws. 140 background to develop and implement dy- • Even though pitch count guidelines do 2. SELECTION OF SUBJECTS: Twenty male 120 namic warm up programs for little league 100 exist, no guidelines regarding maximum little league pitchers were identified to par- 80 pitchers. volume of pitches thrown during an en ticipate in this study and recruited from little 60 tire game exist. league traveling and house teams. 40 Acknowledgements: We would like to thank the 20 3. OBSERVATION OF PITCHERS: Each starting 0 43.07 74.98 93.95 127.53 Louisville Hornet’s, the Oldham County Viper’s, PURPOSE pitcher was observed from an hour prior to the Game Pitches Game Speed Throws Total Game Pitch Count Total Throw Volume and Owensboro Little League for their partici- The purpose of this study was to investigate start of the game until the end of the game. pation and cooperation while conducting this the total throw volume little league pitchers • Game speed throws - 93.95 ± 36.87 / range 1. Implement a dynamic warm up program study. We would also like to thank Bellarmine make throughout an entire game and then to RESULTS of 29-185. in place of warm pitches to reduce total University Doctor of Physical Therapy Depart- compare that to the ASMI and USSSA baseball THROW TYPE DATA (mean data based on 43 • Innings pitched - 2.71 ± 1.86 / range of 1-6. throw volume to a maximum of 125. ment and our advisor Dr. David Boyce for their guidelines. observations) • Pitches per inning 17.51 ± 8.12 / range 41. 2. Limit pitchers to first base and right field help and guidance with this study. • Pre-game warm-up tosses - 33.44 ± 20.85 positions if planned to pitch. SUBJECTS / range of 0-76 DISCUSSION 3. Limit pre-game warm-up pitches to 10- Twenty male little league baseball pitchers (14 • Pre-game warm-up pitches - 18.47 ± 9.56 / • Game pitch counts for this sample fell within 15% of recommended total pitch count. travel and 6 house league); ages 10-12 years range of 0-42 the recommended pitches per game recom- 4. Warm-up pitches in-between innings old, voluntarily participated in this study. • Between inning warm-up pitches - 13.44 ± mendations provided by ASMI. should be limited to 5% of recommended 9.12 / range of 4-39 • Pitches per inning were found to be 17.5. total pitch count. METHODS • Game pitches - 43.07 ± 26.00 / range 8-86 Over the course of a 6 inning game, a pitcher 5. Pre-game warm-up toss should be lim- 1. DEVELOPMENT OF THROW VOLUME TOOL: • Non-game positional throws before game could pitch upwards of 105 times. ited to 25 throws. Seven different throw type categories were and in-between innings - 12.60 ± 11.89 / range • On average, pitchers performed 127 total 6. Pitchers should participate in 1/3 of non- identified and a throw count tool was devel- of 0-45. throws during a typical game, 95 of the 127 game and game positional warm ups oped to tally the total throw volume for an • Game positional throws - 6.37 ± 12.06 / range total throws were game speed pitches throws. entire game. The seven areas are: of 0-72. • Currently USSSA baseball and ASMI doesn’t a. Pre-game warm-up toss: Throws between use total throw volume as a threshold met- CONCLUSIONS the pitcher and another player prior to THROW VOLUME DATA (mean data based on ric for little league pitchers. • Total throw volume is nearly double that of start of non-game positional throws. 43 observations) • The investigators of this study suggest that recommended pitch count. b. Pre-game warm up pitches: Non-mound • Total throw volume - 127.53 ± 43.16 / range USSSA baseball consider adding guidelines • Game pitches only account for 34% of the pitches thrown between the pitcher and of 39-255. related to total throw volume and the num- total throw volume a little league pitcher LOUISVILLE, KENTUCKY a catcher prior to game. • Total game pitch count - 74.98 ± 39.01 / ber of game speed throws be limited. has over the course of a game. c. Between innings warm up pitches: Mound range of 17-160. • Additionally, the investigators would also • Pitch volume per inning could be considered pitches thrown between the pitcher and • Pre-game warm-up pitches and between inning suggest the following to decrease the likely at the upper limits of acceptable since USSSA a catcher prior to the start of the inning. pitches - 31.91 ± 15.92/ range of 4-65 pitches. hood of injury for little league players: baseball rules and regulations allots 6 innings