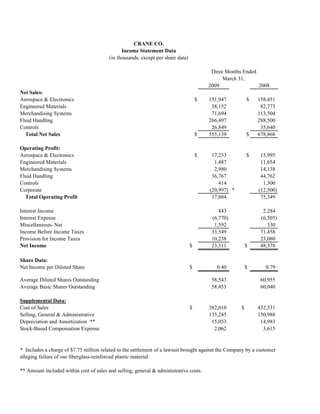
SlideShare a Scribd company logo
1 of 6
Download to read offline
CRANE CO.
                                               Income Statement Data
                                         (in thousands, except per share data)

                                                                                          Three Months Ended
                                                                                               March 31,
                                                                                         2009                2008
Net Sales:
Aerospace & Electronics                                                              $   151,947          $   158,451
Engineered Materials                                                                      38,152               82,773
Merchandising Systems                                                                     71,694              113,504
Fluid Handling                                                                           266,497              288,500
Controls                                                                                  26,849               35,640
  Total Net Sales                                                                    $   555,139          $   678,868

Operating Profit:
Aerospace & Electronics                                                              $    17,233          $    15,995
Engineered Materials                                                                       1,487               11,654
Merchandising Systems                                                                      2,980               14,138
Fluid Handling                                                                            36,767               44,762
Controls                                                                                     414                1,300
Corporate                                                                                (20,997) *           (12,500)
  Total Operating Profit                                                                  37,884               75,349

Interest Income                                                                              843                2,284
Interest Expense                                                                          (6,770)              (6,505)
Miscellaneous- Net                                                                         1,592                  330
Income Before Income Taxes                                                                33,549               71,458
Provision for Income Taxes                                                                10,238               23,080
Net Income                                                                       $        23,311          $    48,378

Share Data:
Net Income per Diluted Share                                                     $          0.40          $      0.79

Average Diluted Shares Outstanding                                                        58,543               60,955
Average Basic Shares Outstanding                                                          58,453               60,040

Supplemental Data:
Cost of Sales                                                                    $       382,010      $       452,531
Selling, General & Administrative                                                        135,245              150,988
Depreciation and Amortization **                                                          15,053               14,983
Stock-Based Compensation Expense                                                           2,062                3,615


* Includes a charge of $7.75 million related to the settlement of a lawsuit brought against the Company by a customer
alleging failure of our fiberglass-reinforced plastic material.

** Amount included within cost of sales and selling, general & administrative costs.
CRANE CO.
                                 Condensed Balance Sheets
                                      (in thousands)

                                                                March 31,       December 31,
                                                                 2009              2008

ASSETS
 Current Assets
   Cash and Cash Equivalents                                $     210,315   $       231,840
   Accounts Receivable, net                                       324,596           334,263
   Current Insurance Receivable - Asbestos                         35,300            41,300
   Inventories, net                                               352,056           349,926
   Other Current Assets                                            67,320            63,911
     Total Current Assets                                         989,587         1,021,240

 Property, Plant and Equipment, net                               287,798           290,814
 Long-Term Insurance Receivable - Asbestos                        244,956           260,660
 Other Assets                                                     412,601           420,542
 Goodwill                                                         765,125           781,232

 Total Assets                                               $   2,700,067   $     2,774,488

LIABILITIES AND SHAREHOLDERS' EQUITY
 Current Liabilities
   Notes Payable and Current Maturities of Long-Term Debt   $       7,507   $        16,622
   Accounts Payable                                               156,917           182,147
   Current Asbestos Liability                                      91,000            91,000
   Accrued Liabilities                                            243,164           246,915
   Income Taxes                                                       228             1,980
     Total Current Liabilities                                    498,816           538,664

 Long-Term Debt                                                   398,523           398,479
 Long-Term Deferred Tax Liability                                  22,533            22,971
 Long-Term Asbestos Liability                                     820,447           839,496
 Other Liabilities                                                221,526           229,057

 Shareholders' Equity                                             738,222           745,821

 Total Liabilities and Shareholders' Equity                 $   2,700,067   $     2,774,488
CRANE CO.
                                 Condensed Statements of Cash Flows
                                           (in thousands)

                                                                            Three Months Ended
                                                                                 March 31,
                                                                          2009             2008
Operating Activities:
    Net income                                                        $    23,311        $ 48,378
    Depreciation and amortization                                          15,053           14,983
    Stock-based compensation expense                                        2,062            3,615
    Deferred income taxes                                                   8,694            6,097
    Cash used for operating working capital                               (27,619)         (29,834)
    Other                                                                  (8,773)           2,951
      Subtotal                                                             12,728           46,190
    Asbestos related payments, net of insurance recoveries                  2,656 *         (2,061)
      Total provided by operating activities                               15,384           44,129

Investing Activities:
      Capital expenditures                                                 (9,974)              (9,080)
      Proceeds from disposition of capital assets                           1,703                  676
      Payment for acquisition, net of cash acquired                           -                    (85)
      Proceeds from divestiture                                               -                    506
      Total used for investing activities                                  (8,271)              (7,983)

Financing Activities:
     Dividends paid                                                       (11,688)         (10,795)
     Reacquisition of shares on open market                                   -            (40,000)
     Stock options exercised - net of shares reacquired                      (637)           3,556
     Excess tax benefit from stock-based compensation                         -                107
     Change in short-term debt                                             (9,316)           9,037
     Total used for financing activities                                  (21,641)         (38,095)

Effect of exchange rate on cash and cash equivalents                     (6,997)            13,307
(Decrease) increase in cash and cash equivalents                        (21,525)            11,358
Cash and cash equivalents at beginning of period                        231,840            283,370
Cash and cash equivalents at end of period                            $ 210,315          $ 294,728


* Includes a $14.5 million insurance settlement receipt from the Highlands Insurance Company.
CRANE CO.
                                            Order Backlog
                                            (in thousands)

                                                March 31,         December 31,                March 31,
                                                 2009                 2008                     2008

Aerospace & Electronics                     $      396,393         $     418,382          $      407,398
Engineered Materials                                 6,924                 6,942                  15,941
Merchandising Systems                               18,822                23,407                  42,551
Fluid Handling*                                    275,660               302,653                 268,302
Controls                                            26,667                30,509                  34,464
  Total Backlog                             $      724,466         $     781,893          $      768,656


* Includes Order Backlog of $46.5 million in March 2009 and $57.0 million in December 2008 pertaining to
2008 acquisitions of Delta and Krombach.
CRANE CO.
                                                               Non-GAAP Financial Measures
                                                                     (in thousands)

                                                                           Three Months Ended                 Percent Change
                                                                                March 31,                     March 31, 2009
                                                                         2009              2008                Three Months
                                INCOME ITEMS

Net Sales                                                            $    555,139          $    678,868               -18.2%

Operating Profit                                                           37,884                75,349

Special Items impacting Operating Profit:
Lawsuit Settlement - Pre-Tax (a)                                            7,750                    -

Restructuring Charges (Gains)                                                (448)                   -                                                              (b)

Operating Profit before Special Items                                $     45,186          $     75,349               -40.0%
Percentage of Sales                                                          8.1%                 11.1%                            #DIV/0!             #DIV/0!
                                                                                                                                     2009 Full Year Guidance
                                                                                                                                    Low                 High


Net Income                                                           $     23,311          $     48,378                        $      118,862      $     136,562
Per Share                                                            $       0.40          $       0.79                        $         2.01      $        2.31

Special Items impacting Net Income:

Lawsuit Settlement - Net of Tax (a)                                         5,038                    -                                  5,038               5,038
Per Share                                                            $       0.09                    -                         $         0.09      $         0.09

Restructuring Charges (Gains) - Net of Tax                                    (291)                  -                                  8,850 (b)           8,850 (b)
Per Share                                                            $       (0.00)                  -                         $         0.15     $          0.15

Net Income before Special Items                                      $     28,058          $     48,378               -42.0%   $      132,750      $     150,450
Per Share                                                            $       0.48          $       0.79                        $         2.25      $        2.55


(a) During the three months ended March 31, 2009, the Company recorded a charge for the settlement of a lawsuit brought
against the Company by a customer alleging failure or our fiberglass-reinforced plastic material.

(b) Amounts represent $15 million of pre-tax restructuring charges ($8.85 million after-tax) in connection with the
Restructuring Program and integration expenses related to the acquisition of Krombach.
March 31,       December 31,
                                                                        2009              2008

                   BALANCE SHEET ITEMS
Notes Payable and Current Maturities of Long-Term Debt            $         7,507      $       16,622
Long-Term Debt                                                            398,523             398,479
      Total Debt                                                          406,030             415,101
Less: Cash and Cash Equivalents                                          (210,315)           (231,840)
Net Debt                                                                  195,715             183,261
Shareholders' Equity                                                      738,222             745,821
Net Capitalization                                                $       933,937      $      929,082
Percentage of Net Debt to Net Capitalization                                21.0%               19.7%


                                                                           Three Months Ended
                                                                                March 31,
                                                                         2009              2008

                     CASH FLOW ITEMS
Cash Provided from Operating Activities
 before Asbestos - Related Payments                               $        12,728       $       46,190
Asbestos Related Payments, Net of Insurance Recoveries                      2,656 *             (2,061)
Cash Provided from Operating Activities                                    15,384               44,129
Less: Capital Expenditures                                                 (9,974)              (9,080)
Free Cash Flow                                                     $        5,410       $       35,049

* Includes a $14.5 million insurance settlement receipt from the Highlands Insurance Company.


Certain non-GAAP measures have been provided to facilitate comparison with the prior year.


The Company reports its financial results in accordance with U.S. generally accepted accounting principles (GAAP). However, management believes that
non-GAAP financial measures which exclude certain non-recurring items present additional useful comparisons between current results and results in
prior operating periods, providing investors with a clearer view of the underlying trends of the business. Management also uses these non-GAAP
financial measures in making financial, operating, planning and compensation decisions and in evaluating the Company's performance. In addition, Free
Cash Flow provides supplemental information to assist management and investors in analyzing the Companyโ€™s ability to generate positive cash flow. Non-
GAAP financial measures, which may be inconsistent with similarly captioned measures presented by other companies, should be viewed in addition to,
and not as a substitute for, the Companyโ€™s reported results prepared in accordance with GAAP.

More Related Content

What's hot

xcel energy 10q 2q03
xcel energy 10q 2q03xcel energy 10q 2q03
xcel energy 10q 2q03
finance26
ย 
whole food market fr08_scf
whole food market  fr08_scfwhole food market  fr08_scf
whole food market fr08_scf
finance44
ย 
xcel energy Q1 08_10Q
xcel energy Q1 08_10Qxcel energy Q1 08_10Q
xcel energy Q1 08_10Q
finance26
ย 
xcel energy NSP-WI_Q210-Q2008
xcel energy NSP-WI_Q210-Q2008xcel energy NSP-WI_Q210-Q2008
xcel energy NSP-WI_Q210-Q2008
finance26
ย 
advanced micro devices Q106Results
advanced micro devices Q106Resultsadvanced micro devices Q106Results
advanced micro devices Q106Results
finance34
ย 
United Health Group Form 8-K Related to Earnings Release
United Health Group Form 8-K Related to Earnings ReleaseUnited Health Group Form 8-K Related to Earnings Release
United Health Group Form 8-K Related to Earnings Release
finance3
ย 
xcel energy 10q_3q04b
xcel energy 10q_3q04bxcel energy 10q_3q04b
xcel energy 10q_3q04b
finance26
ย 
energy east Q32007ER
energy east Q32007ERenergy east Q32007ER
energy east Q32007ER
finance40
ย 
Q1 2009 Financial Report of Steel Dynamics Inc.
Q1 2009 Financial Report of Steel Dynamics Inc.Q1 2009 Financial Report of Steel Dynamics Inc.
Q1 2009 Financial Report of Steel Dynamics Inc.
earningreport earningreport
ย 
conoco phillips 2004Fourth Quarter
conoco phillips 2004Fourth Quarterconoco phillips 2004Fourth Quarter
conoco phillips 2004Fourth Quarter
finance1
ย 

What's hot (10)

xcel energy 10q 2q03
xcel energy 10q 2q03xcel energy 10q 2q03
xcel energy 10q 2q03
ย 
whole food market fr08_scf
whole food market  fr08_scfwhole food market  fr08_scf
whole food market fr08_scf
ย 
xcel energy Q1 08_10Q
xcel energy Q1 08_10Qxcel energy Q1 08_10Q
xcel energy Q1 08_10Q
ย 
xcel energy NSP-WI_Q210-Q2008
xcel energy NSP-WI_Q210-Q2008xcel energy NSP-WI_Q210-Q2008
xcel energy NSP-WI_Q210-Q2008
ย 
advanced micro devices Q106Results
advanced micro devices Q106Resultsadvanced micro devices Q106Results
advanced micro devices Q106Results
ย 
United Health Group Form 8-K Related to Earnings Release
United Health Group Form 8-K Related to Earnings ReleaseUnited Health Group Form 8-K Related to Earnings Release
United Health Group Form 8-K Related to Earnings Release
ย 
xcel energy 10q_3q04b
xcel energy 10q_3q04bxcel energy 10q_3q04b
xcel energy 10q_3q04b
ย 
energy east Q32007ER
energy east Q32007ERenergy east Q32007ER
energy east Q32007ER
ย 
Q1 2009 Financial Report of Steel Dynamics Inc.
Q1 2009 Financial Report of Steel Dynamics Inc.Q1 2009 Financial Report of Steel Dynamics Inc.
Q1 2009 Financial Report of Steel Dynamics Inc.
ย 
conoco phillips 2004Fourth Quarter
conoco phillips 2004Fourth Quarterconoco phillips 2004Fourth Quarter
conoco phillips 2004Fourth Quarter
ย 

Viewers also liked (8)

Top 6 reasons why businesses should use Facebook
Top 6 reasons why businesses should use FacebookTop 6 reasons why businesses should use Facebook
Top 6 reasons why businesses should use Facebook
ย 
Q1 2009 Earning Report of First Cash Financial Services Inc.
Q1 2009 Earning Report of First Cash Financial Services Inc.Q1 2009 Earning Report of First Cash Financial Services Inc.
Q1 2009 Earning Report of First Cash Financial Services Inc.
ย 
Q1 2009 Earning Report of Texas Capital Bancshares, Inc.
Q1 2009 Earning Report of Texas Capital Bancshares, Inc.Q1 2009 Earning Report of Texas Capital Bancshares, Inc.
Q1 2009 Earning Report of Texas Capital Bancshares, Inc.
ย 
Q1 2009 Earning Report of Weatherford International
Q1 2009 Earning Report of Weatherford InternationalQ1 2009 Earning Report of Weatherford International
Q1 2009 Earning Report of Weatherford International
ย 
Q1 2009 Earning Report of Intel Corp
 Q1 2009 Earning Report of Intel Corp Q1 2009 Earning Report of Intel Corp
Q1 2009 Earning Report of Intel Corp
ย 
Q1 2009 Earning Report of Zions Bancorporation
Q1 2009 Earning Report of Zions BancorporationQ1 2009 Earning Report of Zions Bancorporation
Q1 2009 Earning Report of Zions Bancorporation
ย 
Q3 2009 Earning Report of Quidel Corporation
Q3 2009 Earning Report of Quidel CorporationQ3 2009 Earning Report of Quidel Corporation
Q3 2009 Earning Report of Quidel Corporation
ย 
Q3 2009 Earning Report of Chevron Corp.
Q3 2009 Earning Report of Chevron Corp.Q3 2009 Earning Report of Chevron Corp.
Q3 2009 Earning Report of Chevron Corp.
ย 

Similar to Q1 2009 Financial Report of Crane Co.

advanced micro devices Q308Financials
advanced micro devices Q308Financialsadvanced micro devices Q308Financials
advanced micro devices Q308Financials
finance34
ย 
xel_05/16/03b
xel_05/16/03bxel_05/16/03b
xel_05/16/03b
finance26
ย 
emerson electricl Proxy Statement for 2009 Annual Shareholders Meeting
emerson electricl Proxy Statement for 2009 Annual Shareholders Meeting  emerson electricl Proxy Statement for 2009 Annual Shareholders Meeting
emerson electricl Proxy Statement for 2009 Annual Shareholders Meeting
finance12
ย 
Q1 2009 Earning Report of Hittite Microwave Corp.
Q1 2009 Earning Report of Hittite Microwave Corp.Q1 2009 Earning Report of Hittite Microwave Corp.
Q1 2009 Earning Report of Hittite Microwave Corp.
earningreport earningreport
ย 
tjx Annual Reports1997
tjx Annual Reports1997tjx Annual Reports1997
tjx Annual Reports1997
finance14
ย 
Q1 2009 Earning Report of Schlumberger Ltd
Q1 2009 Earning Report of Schlumberger LtdQ1 2009 Earning Report of Schlumberger Ltd
Q1 2009 Earning Report of Schlumberger Ltd
earningreport earningreport
ย 
conoco phillips 2007Third Quarter
conoco phillips 2007Third Quarterconoco phillips 2007Third Quarter
conoco phillips 2007Third Quarter
finance1
ย 
Q1 2004 Earnings Release Financial Tables
 	Q1 2004 Earnings Release Financial Tables 	Q1 2004 Earnings Release Financial Tables
Q1 2004 Earnings Release Financial Tables
finance7
ย 
xcel energy 10q 2q03
xcel energy 10q 2q03xcel energy 10q 2q03
xcel energy 10q 2q03
finance26
ย 
advanced micro devices Q208Financials
advanced micro devices Q208Financialsadvanced micro devices Q208Financials
advanced micro devices Q208Financials
finance34
ย 
tjx Annual Reports1999
tjx Annual Reports1999tjx Annual Reports1999
tjx Annual Reports1999
finance14
ย 
fr06_scf
fr06_scffr06_scf
fr06_scf
finance44
ย 
state street corp stt_finrev02
state street corp stt_finrev02state street corp stt_finrev02
state street corp stt_finrev02
finance23
ย 
state street corp stt_finrev02
state street corp stt_finrev02state street corp stt_finrev02
state street corp stt_finrev02
finance23
ย 
ppg industries 3Q 06 Earning sTables
ppg industries 3Q 06 Earning sTables ppg industries 3Q 06 Earning sTables
ppg industries 3Q 06 Earning sTables
finance22
ย 
energy east 2Q08_EAS_release
energy east 2Q08_EAS_releaseenergy east 2Q08_EAS_release
energy east 2Q08_EAS_release
finance40
ย 
xcel energy NSP-WI_Q210-Q2008
xcel energy NSP-WI_Q210-Q2008xcel energy NSP-WI_Q210-Q2008
xcel energy NSP-WI_Q210-Q2008
finance26
ย 

Similar to Q1 2009 Financial Report of Crane Co. (20)

advanced micro devices Q308Financials
advanced micro devices Q308Financialsadvanced micro devices Q308Financials
advanced micro devices Q308Financials
ย 
xel_05/16/03b
xel_05/16/03bxel_05/16/03b
xel_05/16/03b
ย 
emerson electricl Proxy Statement for 2009 Annual Shareholders Meeting
emerson electricl Proxy Statement for 2009 Annual Shareholders Meeting  emerson electricl Proxy Statement for 2009 Annual Shareholders Meeting
emerson electricl Proxy Statement for 2009 Annual Shareholders Meeting
ย 
Q1 2009 Earning Report of Hittite Microwave Corp.
Q1 2009 Earning Report of Hittite Microwave Corp.Q1 2009 Earning Report of Hittite Microwave Corp.
Q1 2009 Earning Report of Hittite Microwave Corp.
ย 
tjx Annual Reports1997
tjx Annual Reports1997tjx Annual Reports1997
tjx Annual Reports1997
ย 
hp 2004 /2003Financial Overview
hp 2004 /2003Financial Overviewhp 2004 /2003Financial Overview
hp 2004 /2003Financial Overview
ย 
Q1 2009 Earning Report of Schlumberger Ltd
Q1 2009 Earning Report of Schlumberger LtdQ1 2009 Earning Report of Schlumberger Ltd
Q1 2009 Earning Report of Schlumberger Ltd
ย 
conoco phillips 2007Third Quarter
conoco phillips 2007Third Quarterconoco phillips 2007Third Quarter
conoco phillips 2007Third Quarter
ย 
Q1 2004 Earnings Release Financial Tables
 	Q1 2004 Earnings Release Financial Tables 	Q1 2004 Earnings Release Financial Tables
Q1 2004 Earnings Release Financial Tables
ย 
xcel energy 10q 2q03
xcel energy 10q 2q03xcel energy 10q 2q03
xcel energy 10q 2q03
ย 
advanced micro devices Q208Financials
advanced micro devices Q208Financialsadvanced micro devices Q208Financials
advanced micro devices Q208Financials
ย 
tjx Annual Reports1999
tjx Annual Reports1999tjx Annual Reports1999
tjx Annual Reports1999
ย 
fr06_scf
fr06_scffr06_scf
fr06_scf
ย 
state street corp stt_finrev02
state street corp stt_finrev02state street corp stt_finrev02
state street corp stt_finrev02
ย 
state street corp stt_finrev02
state street corp stt_finrev02state street corp stt_finrev02
state street corp stt_finrev02
ย 
ppg industries 3Q 06 Earning sTables
ppg industries 3Q 06 Earning sTables ppg industries 3Q 06 Earning sTables
ppg industries 3Q 06 Earning sTables
ย 
energy east 2Q08_EAS_release
energy east 2Q08_EAS_releaseenergy east 2Q08_EAS_release
energy east 2Q08_EAS_release
ย 
xcel energy NSP-WI_Q210-Q2008
xcel energy NSP-WI_Q210-Q2008xcel energy NSP-WI_Q210-Q2008
xcel energy NSP-WI_Q210-Q2008
ย 
Maxim 2Q FISCAL 2009 RESULTS
Maxim 2Q FISCAL 2009 RESULTSMaxim 2Q FISCAL 2009 RESULTS
Maxim 2Q FISCAL 2009 RESULTS
ย 
Q1 2009 Earning Report of Microsoft
Q1 2009 Earning Report of MicrosoftQ1 2009 Earning Report of Microsoft
Q1 2009 Earning Report of Microsoft
ย 

More from earningreport earningreport

Q3 2009 Earning Report of Banco Santander S.A.
Q3 2009 Earning Report of Banco Santander S.A.Q3 2009 Earning Report of Banco Santander S.A.
Q3 2009 Earning Report of Banco Santander S.A.
earningreport earningreport
ย 
Q3 2009 Earning Report of Brown & Brown
Q3 2009 Earning Report of Brown & BrownQ3 2009 Earning Report of Brown & Brown
Q3 2009 Earning Report of Brown & Brown
earningreport earningreport
ย 
Q3 2009 Earning Report of Boston Scientific Corporation
Q3 2009 Earning Report of Boston Scientific CorporationQ3 2009 Earning Report of Boston Scientific Corporation
Q3 2009 Earning Report of Boston Scientific Corporation
earningreport earningreport
ย 
Q3 2009 Earning Report of Boston Scientific Corporation
Q3 2009 Earning Report of Boston Scientific CorporationQ3 2009 Earning Report of Boston Scientific Corporation
Q3 2009 Earning Report of Boston Scientific Corporation
earningreport earningreport
ย 
Q3 2009 Earning Report of Atheros Communications, Inc.
Q3 2009 Earning Report of Atheros Communications, Inc.Q3 2009 Earning Report of Atheros Communications, Inc.
Q3 2009 Earning Report of Atheros Communications, Inc.
earningreport earningreport
ย 
Q3 2009 Earning Report of Hancock Holding Company
Q3 2009 Earning Report of Hancock Holding CompanyQ3 2009 Earning Report of Hancock Holding Company
Q3 2009 Earning Report of Hancock Holding Company
earningreport earningreport
ย 
Q3 2009 Earning Report of Infosys Technologies Ltd.
Q3 2009 Earning Report of Infosys Technologies Ltd.Q3 2009 Earning Report of Infosys Technologies Ltd.
Q3 2009 Earning Report of Infosys Technologies Ltd.
earningreport earningreport
ย 
Q3 2009 Earning Report of Marriott International
Q3 2009 Earning Report of Marriott InternationalQ3 2009 Earning Report of Marriott International
Q3 2009 Earning Report of Marriott International
earningreport earningreport
ย 
Q3 2009 Earning Report of Pepsi Bottling Group
Q3 2009 Earning Report of Pepsi Bottling GroupQ3 2009 Earning Report of Pepsi Bottling Group
Q3 2009 Earning Report of Pepsi Bottling Group
earningreport earningreport
ย 
Q3 2009 Earning Report of Jean Coutu Group
Q3 2009 Earning Report of Jean Coutu GroupQ3 2009 Earning Report of Jean Coutu Group
Q3 2009 Earning Report of Jean Coutu Group
earningreport earningreport
ย 
Q3 2009 Earning Report of Worthington Industries, Inc.
Q3 2009 Earning Report of Worthington Industries, Inc.Q3 2009 Earning Report of Worthington Industries, Inc.
Q3 2009 Earning Report of Worthington Industries, Inc.
earningreport earningreport
ย 

More from earningreport earningreport (20)

Q3 2009 Earning Report of Banco Santander S.A.
Q3 2009 Earning Report of Banco Santander S.A.Q3 2009 Earning Report of Banco Santander S.A.
Q3 2009 Earning Report of Banco Santander S.A.
ย 
Q3 Earning report of Daimler AG
Q3 Earning report of Daimler AGQ3 Earning report of Daimler AG
Q3 Earning report of Daimler AG
ย 
Q3 Earning Report of BB&T Corporation
Q3 Earning Report of BB&T CorporationQ3 Earning Report of BB&T Corporation
Q3 Earning Report of BB&T Corporation
ย 
Q3 Earning Report of BB&T Corporation
Q3 Earning Report of BB&T CorporationQ3 Earning Report of BB&T Corporation
Q3 Earning Report of BB&T Corporation
ย 
Q3 2009 Earning Report of Brown & Brown
Q3 2009 Earning Report of Brown & BrownQ3 2009 Earning Report of Brown & Brown
Q3 2009 Earning Report of Brown & Brown
ย 
Q3 2009 Earning Report of Boston Scientific Corporation
Q3 2009 Earning Report of Boston Scientific CorporationQ3 2009 Earning Report of Boston Scientific Corporation
Q3 2009 Earning Report of Boston Scientific Corporation
ย 
Q3 2009 Earning Report of Boston Scientific Corporation
Q3 2009 Earning Report of Boston Scientific CorporationQ3 2009 Earning Report of Boston Scientific Corporation
Q3 2009 Earning Report of Boston Scientific Corporation
ย 
Q3 2009 Earning Report of Atheros Communications, Inc.
Q3 2009 Earning Report of Atheros Communications, Inc.Q3 2009 Earning Report of Atheros Communications, Inc.
Q3 2009 Earning Report of Atheros Communications, Inc.
ย 
Q3 2009 Earning Report of Apple Inc.
Q3 2009 Earning Report of Apple Inc.Q3 2009 Earning Report of Apple Inc.
Q3 2009 Earning Report of Apple Inc.
ย 
Q3 2009 Earning Report of Hancock Holding Company
Q3 2009 Earning Report of Hancock Holding CompanyQ3 2009 Earning Report of Hancock Holding Company
Q3 2009 Earning Report of Hancock Holding Company
ย 
Q3 2009 Earning Report of Walgreen Co.
Q3 2009 Earning Report of Walgreen Co.Q3 2009 Earning Report of Walgreen Co.
Q3 2009 Earning Report of Walgreen Co.
ย 
Q3 2009 Earning Report of Infosys Technologies Ltd.
Q3 2009 Earning Report of Infosys Technologies Ltd.Q3 2009 Earning Report of Infosys Technologies Ltd.
Q3 2009 Earning Report of Infosys Technologies Ltd.
ย 
Q3 2009 Earning Report of Marriott International
Q3 2009 Earning Report of Marriott InternationalQ3 2009 Earning Report of Marriott International
Q3 2009 Earning Report of Marriott International
ย 
Q3 2009 Earning Report of PepsiCo.
Q3 2009 Earning Report of PepsiCo.Q3 2009 Earning Report of PepsiCo.
Q3 2009 Earning Report of PepsiCo.
ย 
Q3 2009 Earning Report of Alcoa, Inc.
Q3 2009 Earning Report of Alcoa, Inc.Q3 2009 Earning Report of Alcoa, Inc.
Q3 2009 Earning Report of Alcoa, Inc.
ย 
Q3 2009 Earning Report of Pepsi Bottling Group
Q3 2009 Earning Report of Pepsi Bottling GroupQ3 2009 Earning Report of Pepsi Bottling Group
Q3 2009 Earning Report of Pepsi Bottling Group
ย 
Q3 2009 Earning Report of Jean Coutu Group
Q3 2009 Earning Report of Jean Coutu GroupQ3 2009 Earning Report of Jean Coutu Group
Q3 2009 Earning Report of Jean Coutu Group
ย 
Q3 2009 Earning Report of Minerva plc
Q3 2009 Earning Report of Minerva plcQ3 2009 Earning Report of Minerva plc
Q3 2009 Earning Report of Minerva plc
ย 
Q3 2009 Earning Report of Worthington Industries, Inc.
Q3 2009 Earning Report of Worthington Industries, Inc.Q3 2009 Earning Report of Worthington Industries, Inc.
Q3 2009 Earning Report of Worthington Industries, Inc.
ย 
Q3 2009 Earning Report of Walgreen
Q3 2009 Earning Report of WalgreenQ3 2009 Earning Report of Walgreen
Q3 2009 Earning Report of Walgreen
ย 

Recently uploaded

VIP Independent Call Girls in Andheri ๐ŸŒน 9920725232 ( Call Me ) Mumbai Escorts...
VIP Independent Call Girls in Andheri ๐ŸŒน 9920725232 ( Call Me ) Mumbai Escorts...VIP Independent Call Girls in Andheri ๐ŸŒน 9920725232 ( Call Me ) Mumbai Escorts...
VIP Independent Call Girls in Andheri ๐ŸŒน 9920725232 ( Call Me ) Mumbai Escorts...
dipikadinghjn ( Why You Choose Us? ) Escorts
ย 
VIP Independent Call Girls in Bandra West ๐ŸŒน 9920725232 ( Call Me ) Mumbai Esc...
VIP Independent Call Girls in Bandra West ๐ŸŒน 9920725232 ( Call Me ) Mumbai Esc...VIP Independent Call Girls in Bandra West ๐ŸŒน 9920725232 ( Call Me ) Mumbai Esc...
VIP Independent Call Girls in Bandra West ๐ŸŒน 9920725232 ( Call Me ) Mumbai Esc...
dipikadinghjn ( Why You Choose Us? ) Escorts
ย 

Recently uploaded (20)

High Class Call Girls Nagpur Grishma Call 7001035870 Meet With Nagpur Escorts
High Class Call Girls Nagpur Grishma Call 7001035870 Meet With Nagpur EscortsHigh Class Call Girls Nagpur Grishma Call 7001035870 Meet With Nagpur Escorts
High Class Call Girls Nagpur Grishma Call 7001035870 Meet With Nagpur Escorts
ย 
(ANIKA) Budhwar Peth Call Girls Just Call 7001035870 [ Cash on Delivery ] Pun...
(ANIKA) Budhwar Peth Call Girls Just Call 7001035870 [ Cash on Delivery ] Pun...(ANIKA) Budhwar Peth Call Girls Just Call 7001035870 [ Cash on Delivery ] Pun...
(ANIKA) Budhwar Peth Call Girls Just Call 7001035870 [ Cash on Delivery ] Pun...
ย 
Top Rated Pune Call Girls Viman Nagar โŸŸ 6297143586 โŸŸ Call Me For Genuine Sex...
Top Rated  Pune Call Girls Viman Nagar โŸŸ 6297143586 โŸŸ Call Me For Genuine Sex...Top Rated  Pune Call Girls Viman Nagar โŸŸ 6297143586 โŸŸ Call Me For Genuine Sex...
Top Rated Pune Call Girls Viman Nagar โŸŸ 6297143586 โŸŸ Call Me For Genuine Sex...
ย 
00_Main ppt_MeetupDORA&CyberSecurity.pptx
00_Main ppt_MeetupDORA&CyberSecurity.pptx00_Main ppt_MeetupDORA&CyberSecurity.pptx
00_Main ppt_MeetupDORA&CyberSecurity.pptx
ย 
02_Fabio Colombo_Accenture_MeetupDora&Cybersecurity.pptx
02_Fabio Colombo_Accenture_MeetupDora&Cybersecurity.pptx02_Fabio Colombo_Accenture_MeetupDora&Cybersecurity.pptx
02_Fabio Colombo_Accenture_MeetupDora&Cybersecurity.pptx
ย 
VIP Independent Call Girls in Andheri ๐ŸŒน 9920725232 ( Call Me ) Mumbai Escorts...
VIP Independent Call Girls in Andheri ๐ŸŒน 9920725232 ( Call Me ) Mumbai Escorts...VIP Independent Call Girls in Andheri ๐ŸŒน 9920725232 ( Call Me ) Mumbai Escorts...
VIP Independent Call Girls in Andheri ๐ŸŒน 9920725232 ( Call Me ) Mumbai Escorts...
ย 
(INDIRA) Call Girl Mumbai Call Now 8250077686 Mumbai Escorts 24x7
(INDIRA) Call Girl Mumbai Call Now 8250077686 Mumbai Escorts 24x7(INDIRA) Call Girl Mumbai Call Now 8250077686 Mumbai Escorts 24x7
(INDIRA) Call Girl Mumbai Call Now 8250077686 Mumbai Escorts 24x7
ย 
Dharavi Russian callg Girls, { 09892124323 } || Call Girl In Mumbai ...
Dharavi Russian callg Girls, { 09892124323 } || Call Girl In Mumbai ...Dharavi Russian callg Girls, { 09892124323 } || Call Girl In Mumbai ...
Dharavi Russian callg Girls, { 09892124323 } || Call Girl In Mumbai ...
ย 
Booking open Available Pune Call Girls Talegaon Dabhade 6297143586 Call Hot ...
Booking open Available Pune Call Girls Talegaon Dabhade  6297143586 Call Hot ...Booking open Available Pune Call Girls Talegaon Dabhade  6297143586 Call Hot ...
Booking open Available Pune Call Girls Talegaon Dabhade 6297143586 Call Hot ...
ย 
Booking open Available Pune Call Girls Shivane 6297143586 Call Hot Indian Gi...
Booking open Available Pune Call Girls Shivane  6297143586 Call Hot Indian Gi...Booking open Available Pune Call Girls Shivane  6297143586 Call Hot Indian Gi...
Booking open Available Pune Call Girls Shivane 6297143586 Call Hot Indian Gi...
ย 
Call Girls Service Nagpur Maya Call 7001035870 Meet With Nagpur Escorts
Call Girls Service Nagpur Maya Call 7001035870 Meet With Nagpur EscortsCall Girls Service Nagpur Maya Call 7001035870 Meet With Nagpur Escorts
Call Girls Service Nagpur Maya Call 7001035870 Meet With Nagpur Escorts
ย 
Log your LOA pain with Pension Lab's brilliant campaign
Log your LOA pain with Pension Lab's brilliant campaignLog your LOA pain with Pension Lab's brilliant campaign
Log your LOA pain with Pension Lab's brilliant campaign
ย 
VIP Independent Call Girls in Bandra West ๐ŸŒน 9920725232 ( Call Me ) Mumbai Esc...
VIP Independent Call Girls in Bandra West ๐ŸŒน 9920725232 ( Call Me ) Mumbai Esc...VIP Independent Call Girls in Bandra West ๐ŸŒน 9920725232 ( Call Me ) Mumbai Esc...
VIP Independent Call Girls in Bandra West ๐ŸŒน 9920725232 ( Call Me ) Mumbai Esc...
ย 
The Economic History of the U.S. Lecture 23.pdf
The Economic History of the U.S. Lecture 23.pdfThe Economic History of the U.S. Lecture 23.pdf
The Economic History of the U.S. Lecture 23.pdf
ย 
Call Girls Koregaon Park Call Me 7737669865 Budget Friendly No Advance Booking
Call Girls Koregaon Park Call Me 7737669865 Budget Friendly No Advance BookingCall Girls Koregaon Park Call Me 7737669865 Budget Friendly No Advance Booking
Call Girls Koregaon Park Call Me 7737669865 Budget Friendly No Advance Booking
ย 
Independent Call Girl Number in Kurla Mumbai๐Ÿ“ฒ Pooja Nehwal 9892124323 ๐Ÿ’ž Full ...
Independent Call Girl Number in Kurla Mumbai๐Ÿ“ฒ Pooja Nehwal 9892124323 ๐Ÿ’ž Full ...Independent Call Girl Number in Kurla Mumbai๐Ÿ“ฒ Pooja Nehwal 9892124323 ๐Ÿ’ž Full ...
Independent Call Girl Number in Kurla Mumbai๐Ÿ“ฒ Pooja Nehwal 9892124323 ๐Ÿ’ž Full ...
ย 
TEST BANK For Corporate Finance, 13th Edition By Stephen Ross, Randolph Weste...
TEST BANK For Corporate Finance, 13th Edition By Stephen Ross, Randolph Weste...TEST BANK For Corporate Finance, 13th Edition By Stephen Ross, Randolph Weste...
TEST BANK For Corporate Finance, 13th Edition By Stephen Ross, Randolph Weste...
ย 
03_Emmanuel Ndiaye_Degroof Petercam.pptx
03_Emmanuel Ndiaye_Degroof Petercam.pptx03_Emmanuel Ndiaye_Degroof Petercam.pptx
03_Emmanuel Ndiaye_Degroof Petercam.pptx
ย 
Indore Real Estate Market Trends Report.pdf
Indore Real Estate Market Trends Report.pdfIndore Real Estate Market Trends Report.pdf
Indore Real Estate Market Trends Report.pdf
ย 
The Economic History of the U.S. Lecture 26.pdf
The Economic History of the U.S. Lecture 26.pdfThe Economic History of the U.S. Lecture 26.pdf
The Economic History of the U.S. Lecture 26.pdf
ย 

Q1 2009 Financial Report of Crane Co.

  • 1. CRANE CO. Income Statement Data (in thousands, except per share data) Three Months Ended March 31, 2009 2008 Net Sales: Aerospace & Electronics $ 151,947 $ 158,451 Engineered Materials 38,152 82,773 Merchandising Systems 71,694 113,504 Fluid Handling 266,497 288,500 Controls 26,849 35,640 Total Net Sales $ 555,139 $ 678,868 Operating Profit: Aerospace & Electronics $ 17,233 $ 15,995 Engineered Materials 1,487 11,654 Merchandising Systems 2,980 14,138 Fluid Handling 36,767 44,762 Controls 414 1,300 Corporate (20,997) * (12,500) Total Operating Profit 37,884 75,349 Interest Income 843 2,284 Interest Expense (6,770) (6,505) Miscellaneous- Net 1,592 330 Income Before Income Taxes 33,549 71,458 Provision for Income Taxes 10,238 23,080 Net Income $ 23,311 $ 48,378 Share Data: Net Income per Diluted Share $ 0.40 $ 0.79 Average Diluted Shares Outstanding 58,543 60,955 Average Basic Shares Outstanding 58,453 60,040 Supplemental Data: Cost of Sales $ 382,010 $ 452,531 Selling, General & Administrative 135,245 150,988 Depreciation and Amortization ** 15,053 14,983 Stock-Based Compensation Expense 2,062 3,615 * Includes a charge of $7.75 million related to the settlement of a lawsuit brought against the Company by a customer alleging failure of our fiberglass-reinforced plastic material. ** Amount included within cost of sales and selling, general & administrative costs.
  • 2. CRANE CO. Condensed Balance Sheets (in thousands) March 31, December 31, 2009 2008 ASSETS Current Assets Cash and Cash Equivalents $ 210,315 $ 231,840 Accounts Receivable, net 324,596 334,263 Current Insurance Receivable - Asbestos 35,300 41,300 Inventories, net 352,056 349,926 Other Current Assets 67,320 63,911 Total Current Assets 989,587 1,021,240 Property, Plant and Equipment, net 287,798 290,814 Long-Term Insurance Receivable - Asbestos 244,956 260,660 Other Assets 412,601 420,542 Goodwill 765,125 781,232 Total Assets $ 2,700,067 $ 2,774,488 LIABILITIES AND SHAREHOLDERS' EQUITY Current Liabilities Notes Payable and Current Maturities of Long-Term Debt $ 7,507 $ 16,622 Accounts Payable 156,917 182,147 Current Asbestos Liability 91,000 91,000 Accrued Liabilities 243,164 246,915 Income Taxes 228 1,980 Total Current Liabilities 498,816 538,664 Long-Term Debt 398,523 398,479 Long-Term Deferred Tax Liability 22,533 22,971 Long-Term Asbestos Liability 820,447 839,496 Other Liabilities 221,526 229,057 Shareholders' Equity 738,222 745,821 Total Liabilities and Shareholders' Equity $ 2,700,067 $ 2,774,488
  • 3. CRANE CO. Condensed Statements of Cash Flows (in thousands) Three Months Ended March 31, 2009 2008 Operating Activities: Net income $ 23,311 $ 48,378 Depreciation and amortization 15,053 14,983 Stock-based compensation expense 2,062 3,615 Deferred income taxes 8,694 6,097 Cash used for operating working capital (27,619) (29,834) Other (8,773) 2,951 Subtotal 12,728 46,190 Asbestos related payments, net of insurance recoveries 2,656 * (2,061) Total provided by operating activities 15,384 44,129 Investing Activities: Capital expenditures (9,974) (9,080) Proceeds from disposition of capital assets 1,703 676 Payment for acquisition, net of cash acquired - (85) Proceeds from divestiture - 506 Total used for investing activities (8,271) (7,983) Financing Activities: Dividends paid (11,688) (10,795) Reacquisition of shares on open market - (40,000) Stock options exercised - net of shares reacquired (637) 3,556 Excess tax benefit from stock-based compensation - 107 Change in short-term debt (9,316) 9,037 Total used for financing activities (21,641) (38,095) Effect of exchange rate on cash and cash equivalents (6,997) 13,307 (Decrease) increase in cash and cash equivalents (21,525) 11,358 Cash and cash equivalents at beginning of period 231,840 283,370 Cash and cash equivalents at end of period $ 210,315 $ 294,728 * Includes a $14.5 million insurance settlement receipt from the Highlands Insurance Company.
  • 4. CRANE CO. Order Backlog (in thousands) March 31, December 31, March 31, 2009 2008 2008 Aerospace & Electronics $ 396,393 $ 418,382 $ 407,398 Engineered Materials 6,924 6,942 15,941 Merchandising Systems 18,822 23,407 42,551 Fluid Handling* 275,660 302,653 268,302 Controls 26,667 30,509 34,464 Total Backlog $ 724,466 $ 781,893 $ 768,656 * Includes Order Backlog of $46.5 million in March 2009 and $57.0 million in December 2008 pertaining to 2008 acquisitions of Delta and Krombach.
  • 5. CRANE CO. Non-GAAP Financial Measures (in thousands) Three Months Ended Percent Change March 31, March 31, 2009 2009 2008 Three Months INCOME ITEMS Net Sales $ 555,139 $ 678,868 -18.2% Operating Profit 37,884 75,349 Special Items impacting Operating Profit: Lawsuit Settlement - Pre-Tax (a) 7,750 - Restructuring Charges (Gains) (448) - (b) Operating Profit before Special Items $ 45,186 $ 75,349 -40.0% Percentage of Sales 8.1% 11.1% #DIV/0! #DIV/0! 2009 Full Year Guidance Low High Net Income $ 23,311 $ 48,378 $ 118,862 $ 136,562 Per Share $ 0.40 $ 0.79 $ 2.01 $ 2.31 Special Items impacting Net Income: Lawsuit Settlement - Net of Tax (a) 5,038 - 5,038 5,038 Per Share $ 0.09 - $ 0.09 $ 0.09 Restructuring Charges (Gains) - Net of Tax (291) - 8,850 (b) 8,850 (b) Per Share $ (0.00) - $ 0.15 $ 0.15 Net Income before Special Items $ 28,058 $ 48,378 -42.0% $ 132,750 $ 150,450 Per Share $ 0.48 $ 0.79 $ 2.25 $ 2.55 (a) During the three months ended March 31, 2009, the Company recorded a charge for the settlement of a lawsuit brought against the Company by a customer alleging failure or our fiberglass-reinforced plastic material. (b) Amounts represent $15 million of pre-tax restructuring charges ($8.85 million after-tax) in connection with the Restructuring Program and integration expenses related to the acquisition of Krombach.
  • 6. March 31, December 31, 2009 2008 BALANCE SHEET ITEMS Notes Payable and Current Maturities of Long-Term Debt $ 7,507 $ 16,622 Long-Term Debt 398,523 398,479 Total Debt 406,030 415,101 Less: Cash and Cash Equivalents (210,315) (231,840) Net Debt 195,715 183,261 Shareholders' Equity 738,222 745,821 Net Capitalization $ 933,937 $ 929,082 Percentage of Net Debt to Net Capitalization 21.0% 19.7% Three Months Ended March 31, 2009 2008 CASH FLOW ITEMS Cash Provided from Operating Activities before Asbestos - Related Payments $ 12,728 $ 46,190 Asbestos Related Payments, Net of Insurance Recoveries 2,656 * (2,061) Cash Provided from Operating Activities 15,384 44,129 Less: Capital Expenditures (9,974) (9,080) Free Cash Flow $ 5,410 $ 35,049 * Includes a $14.5 million insurance settlement receipt from the Highlands Insurance Company. Certain non-GAAP measures have been provided to facilitate comparison with the prior year. The Company reports its financial results in accordance with U.S. generally accepted accounting principles (GAAP). However, management believes that non-GAAP financial measures which exclude certain non-recurring items present additional useful comparisons between current results and results in prior operating periods, providing investors with a clearer view of the underlying trends of the business. Management also uses these non-GAAP financial measures in making financial, operating, planning and compensation decisions and in evaluating the Company's performance. In addition, Free Cash Flow provides supplemental information to assist management and investors in analyzing the Companyโ€™s ability to generate positive cash flow. Non- GAAP financial measures, which may be inconsistent with similarly captioned measures presented by other companies, should be viewed in addition to, and not as a substitute for, the Companyโ€™s reported results prepared in accordance with GAAP.