ZenithOptimedia. Executive summary: Advertising Expenditure Forecasts December 2014
•
3 likes•1,845 views

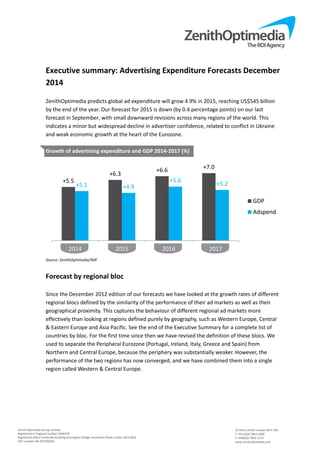
ZenithOptimedia predicts global ad expenditure will grow 4.9% in 2015, reaching US$545 billion by the end of the year. Our forecast for 2015 is down (by 0.4 percentage points) on our last forecast in September, with small downward revisions across many regions of the world. This indicates a minor but widespread decline in advertiser confidence, related to conflict in Ukraine and weak economic growth at the heart of the Eurozone.

Recommended
Recommended
More Related Content
What's hot
What's hot (19)
Viewers also liked
Similar to ZenithOptimedia. Executive summary: Advertising Expenditure Forecasts December 2014
Similar to ZenithOptimedia. Executive summary: Advertising Expenditure Forecasts December 2014 (20)
More from Dmytro Lysiuk
More from Dmytro Lysiuk (20)
Recently uploaded
Recently uploaded (20)
ZenithOptimedia. Executive summary: Advertising Expenditure Forecasts December 2014
- 1. Executive summary: Advertising Expenditure Forecasts December 2014 ZenithOptimedia predicts global ad expenditure will grow 4.9% in 2015, reaching US$545 billion by the end of the year. Our forecast for 2015 is down (by 0.4 percentage points) on our last forecast in September, with small downward revisions across many regions of the world. This indicates a minor but widespread decline in advertiser confidence, related to conflict in Ukraine and weak economic growth at the heart of the Eurozone. +5.5 +6.3 +6.6 +7.0 +5.1 +4.9 2014 2015 2016 2017 Zenith Optimedia Group Limited Registered in England number 4244479 Registered office Pembroke Building Kensington Village Avonmore Road London W14 8DG VAT number GB 707283633 GDP Adspend 24 Percy Street London W1T 2BS T +44 (0)20 7961 1000 F +44(0)20 7961 1113 www.zenithoptimedia.com Growth of advertising expenditure and GDP 2014‐2017 (%) Source: ZenithOptimedia/IMF Forecast by regional bloc +5.6 +5.2 Since the December 2012 edition of our forecasts we have looked at the growth rates of different regional blocs defined by the similarity of the performance of their ad markets as well as their geographical proximity. This captures the behaviour of different regional ad markets more effectively than looking at regions defined purely by geography, such as Western Europe, Central & Eastern Europe and Asia Pacific. See the end of the Executive Summary for a complete list of countries by bloc. For the first time since then we have revised the definition of these blocs. We used to separate the Peripheral Eurozone (Portugal, Ireland, Italy, Greece and Spain) from Northern and Central Europe, because the periphery was substantially weaker. However, the performance of the two regions has now converged, and we have combined them into a single region called Western & Central Europe.
- 2. Eastern Europe & Central Asia MENA Advanced Asia Western & Central Europe Japan North America Fast‐track Asia Latin America Zenith Optimedia Group Limited Registered in England number 4244479 Registered office Pembroke Building Kensington Village Avonmore Road London W14 8DG VAT number GB 707283633 10.1 13.0 24 Percy Street London W1T 2BS T +44 (0)20 7961 1000 F +44(0)20 7961 1113 www.zenithoptimedia.com Growth in adspend by regional bloc 2013‐2014 (%) Source: ZenithOptimedia 0.4 2.3 2.4 2.4 2.8 4.6 Western & Central Europe For the last few years the ad markets at the periphery of the Eurozone have been by far the worst‐performing in Europe, which was why we separated them out in a bloc called the Peripheral Eurozone. Between 2007 and 2013, adspend fell 28% in Italy, 41% in Ireland, 43% in Portugal, 47% in Spain and 62% in Greece. Over this period the Eurozone’s core markets remained stable: adspend shrank by just 2% in France and by 3% in Germany. However, Greece, Portugal, Spain and Ireland all began to make strong recoveries in 2014, and over the next few years we expect them to substantially outperform the average rate for Western & Central Europe, admittedly from their much‐reduced base levels. Their recovery will help adspend in Western & Central Europe adspend grow 2.4% in 2014, a substantial improvement on its ‐1.1% decline in 2013. Meanwhile the economies of France, Germany and Italy are stagnating. They have not made the sort of economic reforms that the peripheral markets were forced into, and in France and Italy
- 3. political instability makes any bold reform unlikely in the near future. Industrial production slowed in Germany even before the Ukraine crisis disrupted trade with Russia. We forecast adspend in France to shrink at an average rate of 0.3% a year between 2014 and 2017, while Germany grows by just 1.3% and Italy by 1.5%, below the Eurozone average of 2.0%. Outside the Eurozone, the stand‐out ad market in Western & Central Europe is the UK, which iscurrently booming thanks to the rapid adoption of internet advertising. Adspend in the UK grew 5.1% in 2013, and we expect it to end 2014 up by 8.0%, followed by 7.9% growth in 2015. We expect growth in the UK and the peripheral Eurozone markets to counterbalance the weakness in the core Eurozone, allowing Western & Central Europe to grow at an average of 2.9% a year between 2014 and 2017. Eastern Europe & Central Asia Eastern European advertising markets, such as Russia and Turkey, generally recovered quickly after the 2009 downturn and continued their healthy pace of growth, largely (though not entirely) unaffected by the problems in the Eurozone for the next four years. Their near neighbours in Central Asia, such as Azerbaijan and Kazakhstan, have behaved very similarly, so we have gathered them together under the Eastern Europe & Central Asia bloc. This bloc grew 11.5% in 2013. The conflict in Ukraine severely disrupted the domestic ad market, while Russia has suffered from sanctions imposed by the US and the EU, the sanctions it imposed in response, and a withdrawal of international investment. These problems have been exacerbated by a sharp drop in the price of oil, which accounts for 70% of Russia’s exports. We forecast adspend in Ukraine to shrink 48.6% this year, while Russian adspend grows just 1.8%. This will be the first year in which Russia will not grow at a double‐digit rate since 2009. Overall we expect adspend growth in Eastern Europe & Central Asia to fall to just 0.4% this year, recovering gradually to 3.2%% in 2015, 6.0% in 2016 and 8.6% in 2017. There are clearly downside risks to this forecast if tensions between Russia and the West escalate further. Japan Japan behaves differently enough from other markets in Asia to be treated separately. Despite recent measures of economic stimulus Japan remains stuck in its rut of persistent low growth. We estimate growth at 2.8% in 2014, and we expect growth to continue at just 2% a year between 2014 and 2017. Advanced Asia Apart from Japan, there are five countries in Asia with developed economies and advanced ad markets that we have placed in a group called Advanced Asia: Australia, New Zealand, Hong Kong, Singapore and South Korea. We estimate growth here at a disappointing 2.4% in 2014, after weakness in the property market damaged consumer confidence in Singapore. As Singapore recovers we expect growth to pick up to an average of 5.1% a year through to 2017. Zenith Optimedia Group Limited Registered in England number 4244479 Registered office Pembroke Building Kensington Village Avonmore Road London W14 8DG VAT number GB 707283633 24 Percy Street London W1T 2BS T +44 (0)20 7961 1000 F +44(0)20 7961 1113 www.zenithoptimedia.com
- 4. Fast‐track Asia We characterise the rest of Asia as Fast‐track Asia (China, India, Indonesia, Malaysia, Pakistan, Philippines, Taiwan, Thailand and Vietnam). These economies are growing extremely rapidly as they adopt Western technology and practices, while benefiting from the rapid inflow of funds from investors hoping to tap into this growth. Fast‐track Asia barely noticed the 2009 downturn (ad expenditure grew by 7.4% that year) and since then has grown very strongly. We expect ad expenditure in Fast‐track Asia to end the year up 10.1% in 2014, and we forecast growth of between 10% and 11% a year for 2015 to 2017. We have not changed the definition of North America, Latin America or the Middle East & North Africa (MENA) in this analysis. North America North America was the first region to suffer the effects of the financial crisis, but it was also quick to recover, and adspend in North America has been more robust than in Europe since 2010. We estimate that adspend grew 4.6% in 2014, boosted by the Winter Olympics and mid‐term elections. In the absence of these events we forecast 3.8% growth in 2015, followed by 4.1% in 2016 (which will benefit from the Summer Olympics and the Presidential elections) and 3.7% in 2017. Latin America Latin America’s economies are more volatile than those of Fast‐track Asia, but its ad market is growing at a similar rate. Adspend grew by an estimated 9.4% in 2013, and – thanks partly to the popularity of the FIFA World Cup in Brazil – we think it will have grown 13.0% by the end of this year. We forecast adspend to grow a relatively restrained 9.5% against this tough comparison in 2015, but the summer Olympics, also hosted in Brazil, should help boost growth to 12.0% in 2016. MENA After the Arab Spring began in December 2010, advertising markets in Middle East & North Africa were constrained by the region’s social and political turmoil, which left many advertisers cautious about attracting negative attention. Adspend shrank 14.9% in 2011, and grew a meagre 1.4% in 2012. Confidence and activity began to recover in 2013, when adspend grew 4.7%. However, while the conflict in Iraq and Syria has had little direct effect on the big advertising markets, it has made advertisers more cautious about investing in the region as a whole. We estimate adspend will grow only 2.3% in 2014, followed by an average rate of annual growth of 4.0% between 2014 and 2017. Zenith Optimedia Group Limited Registered in England number 4244479 Registered office Pembroke Building Kensington Village Avonmore Road London W14 8DG VAT number GB 707283633 24 Percy Street London W1T 2BS T +44 (0)20 7961 1000 F +44(0)20 7961 1113 www.zenithoptimedia.com
- 5. Japan Western & Central Europe North America MENA Advanced Asia Eastern Europe & Central Asia Latin America Fast‐track Asia Zenith Optimedia Group Limited Registered in England number 4244479 Registered office Pembroke Building Kensington Village Avonmore Road London W14 8DG VAT number GB 707283633 10.0 10.3 24 Percy Street London W1T 2BS T +44 (0)20 7961 1000 F +44(0)20 7961 1113 www.zenithoptimedia.com Average annual growth in adspend by regional bloc 2014‐2017 (%) Source: ZenithOptimedia 2.4 2.9 3.9 4.0 5.1 5.9 In the medium term we can divide our blocs into three categories: low growth, steady growth and rapid growth. The low‐growth regions are Western & Central Europe and Japan, which we forecast to grow 2%‐3% a year between 2014 and 2017. The steady growth region includes North America, Advanced Asia and the Middle East & North Africa, and we forecast these to grow at 4%‐ 6%. As a result of the Ukraine crisis, Eastern Europe & Central Asia has been demoted from rapid growth to steady growth, with 6% annual growth predicted for our forecast period. Meanwhile the remaining rapid‐growth regions – Fast‐track Asia and Latin America – are on track to grow at 10% a year through to 2017. Forecast by leading advertising markets Despite the rapid growth of the Rising Markets*, the US is still the biggest contributor of new ad dollars to the global market. Between 2014 and 2017 we expect the US to contribute 25% of the US$86 billion that will be added to global adspend. After the US, however, the biggest contributors are much younger and more dynamic. China comes second, accounting for 19% of additional ad dollars over this period, followed by Argentina and the UK, accounting for 7% and 5% respectively. Seven of the ten largest contributors will be Rising Markets, contributing 42% of new adspend over the next three years. Overall, we forecast Rising Markets to contribute 59% of additional ad expenditure between 2014 and 2017, and to increase their share of the global market from 35% to 39%.
- 6. 6,015 3,950 3,329 3,322 3,248 2,711 2,312 2,121 USA China Argentina UK Brazil Japan South Korea Indonesia India Mexico Zenith Optimedia Group Limited Registered in England number 4244479 Registered office Pembroke Building Kensington Village Avonmore Road London W14 8DG VAT number GB 707283633 21,529 24 Percy Street London W1T 2BS T +44 (0)20 7961 1000 F +44(0)20 7961 1113 www.zenithoptimedia.com Top ten contributors to adspend growth 2014‐2017 (US$m) 16,586 Source: ZenithOptimedia China overtook Japan to become the world’s second‐largest ad market in 2014. We expect to see a few more changes at the top over the next three years. In 2016 we expect the UK to overtake Germany to take fourth place, and South Korea to leapfrog over Australia and France to take seventh place. Argentina, which ranked 15th in 2014, will be 10th in 2017, though its growth is currently fuelled by inflation rather than added value. Top ten ad markets US$m, current prices. Currency conversion at 2013 average rates. 2014 Adspend 2017 Adspend 1 USA 176,006 1 USA 197,536 2 China 45,491 2 China 62,076 3 Japan 44,520 3 Japan 47,842 4 Germany 24,597 4 UK 26,475 5 UK 22,525 5 Germany 25,540 6 Brazil 16,686 6 Brazil 20,015 7 France 13,086 7 South Korea 14,918 8 Australia 12,317 8 Australia 13,060 9 South Korea 11,670 9 France 12,985 10 Canada 11,159 10 Argentina 12,545 Source: ZenithOptimedia Global advertising expenditure by medium The internet is still the fastest growing medium by some distance. We estimate it grew 16.9% in 2014, and we forecast an average of 15% annual growth between 2014 and 2017. Display is the fastest‐growing sub‐category, with 18% annual growth forecast to 2017. Here we
- 7. include traditional display (such as banners), online video and social media. Improved advertising formats are making internet display more interactive and attention‐grabbing, while programmatic buying is evolving to allow more sophisticated targeting of display audiences ever more efficiently. Measurement agencies are investing in research that should measure consumers’ exposure to traditional display ads more accurately, and track their exposure to video ads across desktop computers, tablets and television screens. Some broadcasters are starting to trade packages that include both online video and television spots; online video is also starting to be sold by programmatic buying, providing advertisers with more control and better value. We forecast online video to grow at 20% a year for the rest of our forecast period. Meanwhile social media has embraced the opportunities offered by the transition to mobile, and is growing at 25% a year. We expect paid search to grow at an average rate of 14% a year to 2017, driven by continued innovation from the search engines, including the display of richer product information and images within ads, better localisation of search results, and mobile ad enhancements like click‐to‐call and geo‐targeting. Paid search is also becoming addressable, as platforms give advertisers Zenith Optimedia Group Limited Registered in England number 4244479 Registered office Pembroke Building Kensington Village Avonmore Road London W14 8DG VAT number GB 707283633 24 Percy Street London W1T 2BS T +44 (0)20 7961 1000 F +44(0)20 7961 1113 www.zenithoptimedia.com more control over where, when and to whom their ads are exposed. Online classified has been subdued since the downturn in 2009; after the initial shift from print to digital, classified publishers have had to compete with new paid‐for and free alternatives for matching buyers and sellers. We forecast average annual growth of 6% for the rest of our forecast period.
- 8. 56.5 68.7 52.7 60.2 68.6 12.9 13.7 14.6 15.4 2014 2015 2016 2017 Total display Classified Paid search Zenith Optimedia Group Limited Registered in England number 4244479 Registered office Pembroke Building Kensington Village Avonmore Road London W14 8DG VAT number GB 707283633 92.6 77.1 24 Percy Street London W1T 2BS T +44 (0)20 7961 1000 F +44(0)20 7961 1113 www.zenithoptimedia.com Internet adspend by type 2014‐2017 (US$ billion) Source: ZenithOptimedia 80.5 Mobile advertising (by which we mean all internet ads delivered to smartphones and tablets, whether display, classified or search, and including in‐app ads) has now truly taken off and is growing six times faster than desktop internet. We forecast mobile advertising to grow by an average of 38.3% a year between 2014 and 2017, driven by the rapid spread of devices and improvements in user experiences. By contrast we forecast desktop internet advertising to grow at an average of 6.7% a year. We estimate global expenditure on mobile advertising at US$25.8 billion in 2014, representing 21.1% of internet expenditure and 5.0% of total advertising expenditure (this total excludes a few markets where we don’t have a breakdown by medium). By 2017 we forecast this total to rise to US$68.2 billion, which will be 36.8% of internet expenditure and 11.3% of all expenditure. This means mobile will leapfrog radio, magazines and outdoor to become the world’s fourth‐largest medium by the end of our forecast period, and will be very close to overtaking newspapers. Since it began in the mid‐1990s, internet advertising has principally risen at the expense of print. Over the last ten years internet advertising has risen from 4% of total global spend in 2004 to 24% in 2014. Meanwhile newspapers’ share of global spend has halved from 30% to 15%, while magazines’ has fallen from 13% to 7%. Internet adspend overtook total adspend on both newspapers and magazines this year. We predict internet advertising will increase its share of the ad market from 23.8% in 2014 to 31.1% in 2017, while newspapers and magazines will continue to shrink at an average of 2% a year. Note that our figures for newspapers and magazines include only advertising in printed editions of these publications, not on their websites, or in tablet editions or mobile apps, all of which are picked up in our internet category.
- 9. Mobile is now the main driver of global adspend growth. We forecast mobile to contribute 51% of all the extra adspend between 2014 and 2017 (again excluding markets where we don’t have a breakdown by medium). Desktop internet is the second largest contributor (accounting for 25% of new ad expenditure), followed by television (24%). The gains made by outdoor, radio and cinema will be cancelled out by the continued decline of newspapers and magazines, which we expect to shrink by a combined US$8 billion over the forecast period. Contribution to global growth in adspend by medium 2014‐2017 (US$ million) ‐2,318 ‐5,239 Mobile digital Desktop digital Television Outdoor Radio Cinema Magazines Newspapers Zenith Optimedia Group Limited Registered in England number 4244479 Registered office Pembroke Building Kensington Village Avonmore Road London W14 8DG VAT number GB 707283633 42,424 24 Percy Street London W1T 2BS T +44 (0)20 7961 1000 F +44(0)20 7961 1113 www.zenithoptimedia.com Source: ZenithOptimedia 4,929 2,293 418 20,640 19,790 Television is still by some distance the dominant advertising medium, attracting 40% of spend in 2014. Television offers unparalleled capacity to build reach, and establish brand awareness and associations. We forecast television adspend to grow by an average of 3% a year through to 2017. Despite this healthy growth, television’s share of global adspend is likely to fall back slightly over the next few years as desktop and mobile internet grow much faster. Television’s market share has grown steadily over the last three and a half decades, from 29.9% of spend in 1980 to 39.6% in 2014. We think it has now peaked, however, and forecast it to fall back slightly to 37.4% in 2017. Marketers are also beginning to move small budgets away from television to online video, which we expect to grow from 1.9% of global adspend in 2014 to 2.8% in 2017. The audiovisual share of the market will therefore fall by only 1.3 percentage points, from 41.3% in 2014 to 40.2% in 2017.
- 10. 2014 Television 39.6% 0.5% 6.8% 18.8% 6.8% 7.3% 15.2% 5.0% Desktop internet Mobile internet Newspapers Magazines Outdoor Radio Cinema Zenith Optimedia Group Limited Registered in England number 4244479 Registered office Pembroke Building Kensington Village Avonmore Road London W14 8DG VAT number GB 707283633 2017 Television 37.4% Desktop internet Mobile internet Newspapers Magazines Outdoor Radio Cinema 24 Percy Street London W1T 2BS T +44 (0)20 7961 1000 F +44(0)20 7961 1113 www.zenithoptimedia.com Share of global adspend by medium (%) Source: ZenithOptimedia Appendix 0.5% 6.2% 19.6% 6.7% 5.9% 12.2% 11.4% List of countries included in the regional blocs North America: Canada, USA Western & Central Europe: Austria, Belgium, Bosnia & Herzegovina, Croatia, Czech Republic, Denmark, Finland, France, Germany, Greece, Hungary, Ireland, Italy, Netherlands, Norway, Poland, Portugal, Romania, Serbia, Slovakia, Slovenia, Spain, Sweden, Switzerland, UK Eastern Europe & Central Asia: Armenia, Azerbaijan, Belarus, Bulgaria, Estonia, Georgia, Kazakhstan, Latvia, Lithuania, Moldova, Russia, Turkey, Ukraine, Uzbekistan Japan Advanced Asia: Australia, Hong Kong, New Zealand, Singapore, South Korea Fast‐track Asia: China, India, Indonesia, Malaysia, Pakistan, Philippines, Taiwan, Thailand, Vietnam Latin America: Argentina, Brazil, Chile, Colombia, Costa Rica, Ecuador, El Salvador, Mexico, Panama, Peru, Puerto Rico, Uruguay, Venezuela Middle East & North Africa: Bahrain, Egypt, Israel, Kuwait, Oman, Qatar, Saudi Arabia, UAE *We define Mature Markets as North America, Western Europe and Japan, and Rising Markets as everywhere else
- 11. Advertising Expenditure Forecasts is published quarterly priced £495. It may be ordered in hard or soft copy from www.zenithoptimedia.com Zenith Optimedia Group Limited Registered in England number 4244479 Registered office Pembroke Building Kensington Village Avonmore Road London W14 8DG VAT number GB 707283633 24 Percy Street London W1T 2BS T +44 (0)20 7961 1000 F +44(0)20 7961 1113 www.zenithoptimedia.com For further information, please contact: Jonathan Barnard Head of Forecasting Tel: +44 20 7961 1192 Fax: +44 20 7291 1199 E‐mail: jonathan.barnard@zenithoptimedia.com