A Method for Comparing Short-Circuiting in Reactors
1. A Method of Short-Circuiting Comparison
David Dah-Wei Tsai & Rameshprabu Ramaraj &
Paris Honglay Chen
Received: 13 August 2011 /Accepted: 26 March 2012 /
Published online: 17 April 2012
# Springer Science+Business Media B.V. 2012
Abstract Although short-circuiting is broadly recognized as an important phenomenon in
reactor designs, it is very difficult to compare the degree of short-circuiting among different
reactor types from the hydraulic indexes in reality. Identification of reactor type was
essential and necessary to solve the difficulty of comparison; we adapted a differentiation
method to identify the reactor type to make the comparison achievable. Therefore, this study
was to develop a simple and practical method of short-circuiting comparison, called the
“distance method” and the method was examined through 13 available short-circuiting
indexes. The results showed that all the indexes could correctly subscribe and successfully
compare the degree of short-circuiting. We hope this whole process setup could further help
us to know all the reactors better and to make the comparison in reality possible.
Keywords Reactor analysis . Reactor design . Short-circuiting . Hydrodynamics .
Performance assessment . High rate pond
1 Introduction
1.1 Background
Short-circuiting is a complicated phenomenon in reactors and it has great effects on reactor
performance, even in the field constructed wetland (Economopoulou and Tsihrintzis 2003).
It is one of the greatest hindrances to a successful reactor design (Persson 2000), to result
dead zones (Metcalf and Eddy Inc 2003) and to reduce reactor function (Dierberg et al.
2005). For the hydraulic assessment, it is the key factor to cause poor hydraulic efficiency
(Singh et al. 2009; Xanthos et al. 2011).
At present, many indexes of short-circuiting were developed in different meanings.
According to Metcalf & Eddy Inc. (2003), “short-circuiting” could be defined as “non-ideal
flow” caused by inadequate mixing, density currents, circulation, poor design, axial
dispersion and dead space. Theoretically each index could offer certain useful information on
Water Resour Manage (2012) 26:2689–2702
DOI 10.1007/s11269-012-0040-2
D. D.-W. Tsai :R. Ramaraj :P. H. Chen (*)
Department of Soil and Water Conservation, National Chung-Hsing University, 250 Kuo Kuang Rd.,
402 Taichung, Taiwan
e-mail: hlchen@dragon.nchu.edu.tw
2. short-circuiting. Unfortunately, all the indexes presented puzzle outcomes of comparisons
(Teixeira and Siqueira 2008) even by the same index. Consequently, the primary objective of
this research was to demonstrate a method to help us to solve this problem and to make short-
circuiting comparison possible and reasonable.
1.2 Mathematical Concepts
The difficulty of short-circuiting comparison came from the index evaluation without the
reactor identification to cause a bad comparison because most of the reactors in reality were
not ideal which were mingled between plug-flow reactor (PFR) and continuous stirred-tank
reactor (CSTR). The same reactor type had more similar short-circuiting characteristics even
the short-circuiting was so complicated and intertwined together by non-ideal flow which
was caused by Metcalf and Eddy’s 6 phenomena. Theoretically there was no short-circuiting
Fig. 1 Flow chart of methodology
2690 D.D.-W. Tsai et al.
3. in ideal reactors, either in CSTR or PFR. Therefore, the reactor type identification could be
the key to differentiate and compare the short-circuiting in different reactor types. On the
other word, if we could identify the reactor type, it would help to evaluate reactor designs
and performances by the comparisons with the same type of ideal reactors. Since we
assumed the same type of reactor had more similar short-circuiting characteristics, this study
was to identify the reactor type with the differentiation criteria first and to develop the
distance method to quantify the characteristics from the ideal reactor type. The further
understanding of short-circuiting should be depended on each short-circuiting index which
contained certain more specific short-circuiting nature. In this case, the mathematical
comparison of each short-circuiting index would be possible.
2 Material and Methods
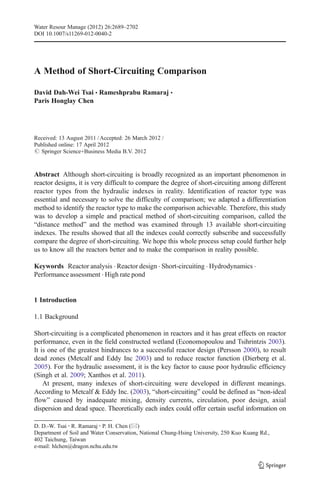
The methodology was illustrated in Fig. 1. Since the original design of high rate pond (HRP)
was tried to imitate PFR (Jupsin et al. 2003), the HRP in this study was used as a PFR in
reality. The bench scale HRP and lab-scale CSTR were set up in the Sustainable Resources
0
0.001
0.002
0.003
0.004
0.005
0 100 200 300 400 500 600 700 800
E(t)
Time, min
E(t) (CSTR)
E(t) (HRP)
E(t) (ideal CSTR)
E(t) (ideal PFR)
E(t) (real PFR)
dHRP=225min
240
dCSTR=15min
Fig. 2 RTD curves comparison among the CSTR, HRP and ideal reactors
Table 1 List of operational
parameters Operational parameter HRP CSTR
scale lab lab
detention time 4 hr 4 hr
Reactor design Paddle wheel with
recirculation
4 L up-flow flask
water level 15 cm -
water volume 199 L 4 L
inflow speed 820 ml/min 16.8 ml/min
Tracer NaCl NaCl
inflow type spike spike
mixing speed (surface speed) 10 cm/sec magnetic mixer
effluent measure interval 15 min 15 min
A Method of Short-Circuiting Comparison 2691
4. and Sustainable Engineering research lab (SRSE-LAB), the department of soil and water
conservation, National Chung-Hsing University, Taichung, Taiwan. All the reactors were
operated at 4 hrs detention time with spiking and other operational parameters were listed in
Table 1.
This study took the HRP and CSTR as an example to discuss the short-circuiting
phenomena and to establish the assessment method of index performance including
residence time distribution (RTD) as well as several short-circuiting indexes. Looking
through the literature, 13 recognized indexes for short-circuiting were selected to discuss.
The indexes were classified into three categories according to the ideal values and
popularity as follows: (1) Different ideal values in different ideal reactors, (2) Same ideal
values in different ideal reactors and (3) Seldom used indexes. Finally we established the
“distance method” to evaluate short-circuiting in each index.
The so-called “distance method” was the method we developed to compare the different
reactor types in each index using the distances between the study and ideal reactors after
screening the reactor type by the criteria we setup (Tsai and Chen unpublished). The axis of
comparison base was formed by index value itself. The comparison values were calculated
1
0 0.5
Ideal
CSTR
Ideal PFR
HRP: 0.257
CSTR: 0.251
dHRP= 0.743
dCSTR = 0.251
Stb
Fig. 3 The distances of Stb from ideal reactors in HRP and CSTR
Flow direction
Remark:
x: location of dead spot and the size of x show the degree of dead spot
Fig. 4 Location of dead spots observed in HRP
2692 D.D.-W. Tsai et al.
5. by the definition of each index from the standard points of the ideal reactor types. There is no
short-circuiting in ideal reactor; therefore according to this concept, in reality the distance
could offer comparable data on the degree of short-circuiting for the different type of the
reactors.
1
0 0.5
Ideal
CSTR
Ideal PFR
danaerobicfixed-bed (PFR) = 0.68
danaerobicfixed-bed, disinfection reactor, electrochemical reactor (CSTR) 0
Stb
dtreatmentplant (PFR) = 0.24
dactivatedsludge baffled reactor(PFR) = 0.51
danaerobicbaffled reactor (PFR) = 0.30
dfieldHRP (PFR) = 0.76
dpilotMBR (CSTR) = 0.30
dagitatedcyanidationtank (CSTR) = 0.22
dactivatedsludge process, Orbalactivated sludge system (CSTR) = 0.16
dlabMBR (CSTR) = 0.08
Fig. 5 The distances of Stb from ideal reactors in available PFRs and CSTRs of the literature. a
The Stb values were
directly quoted or calculated by author according to the literature data: treatment plant (PFR) (Yu et al. 2008),
anaerobic baffled reactor (PFR) (Krishna et al. 2009), activated sludge baffled reactor (PFR) (Tizghadam et al.
2008), anaerobic fixed-bed (PFR) (Escudié et al. 2005), field HRP (PFR) (Ouarghi et al. 2000); pilot MBR
(membrane bioreactor) (CSTR) (Wang et al. 2009), agitated cyanidation tank (CSTR) (Lima and Hodouin 2005),
activated sludge process (CSTR) (Padoley et al. 2006), Orbal activated sludge system (CSTR) (Burrows et al.
2001), lab MBR (CSTR) (Wang et al. 2009), anaerobic fixed-bed (CSTR) (Escudié et al. 2005), disinfection
reactor (CSTR) (Li 2004), electrochemical reactor (CSTR) (Saravanathamizhan et al. 2008)
1
0 0.5
Ideal
CSTR
Ideal PFR
HRP: 0.154
CSTR: 0.125
dHRP = 0.846
dCSTR = 0.02
10
Fig. 6 The distances of θ10 from ideal reactors in HRP and CSTR
A Method of Short-Circuiting Comparison 2693
6. 3 Results and Discussion
3.1 Residence Time Distribution (RTD) Curves
The RTD curves in the HRP, lab CSTR, ideal CSTR, ideal and real PFR could be shown in
Fig. 2. The time of tracer first appearance (ti) could potentially point out the existence of
short-circuiting (Kim and Bae 2007; Teixeira and Siqueira 2008). Both the study HRP and
CSTR exhibited the same ti value because the measurement interval was set as 15 min
shown in Table 1. Theoretically initial tracer in ideal PFR should come out at t, but ti came
out earlier than t in the study HRP. This might be because the HRP existed short-circuiting.
To the contrary, the CSTR ti was also detected at 15 min for the same limitation of
measurement and was very close to ideal CSTR. Therefore, the study CSTR didn’t show
short-circuiting existed.
The time of peak concentration (tp), a similar index with ti, also offered some useful
information on short-circuiting (Burrows et al. 1999; Teixeira and Siqueira 2008). Since tp in
the HRP was much earlier than t and tp of the CSTR was very close to ideal CSTR’s, the
result also demonstrated that there was more short-circuiting existed in the HRP than in lab
CSTR.
In this study, both ti and tp indicated there was possible short-circuiting in HRP but not in
CSTR. Appling the “distance method” might express those phenomena more clearly; the
distance 225 min of HRP was much longer than 15 min in CSTR.
3.2 Hydraulic Performance Indexes
3.2.1 Different Ideal Values in Different Ideal Reactors
Ta and Brignal Index (Stb0t16/t50) Stb was developed to evaluate the level of short-circuiting
from circulation and it was calculated by the deviation of time at 16 % and 50 % tracer flowing
out (t16 and t50) (Ta and Brignal 1998). 0.257 and 0.251 were estimated in the HRP and CSTR
respectively. Considering 1 in ideal PFR and ~0 in ideal CSTR, the distance from the HRP to
ideal value was 0.743. Comparing to 0.251 in the CSTR, the degree of short-circuiting in HRP
seemed higher than in CSTR shown in Fig. 3. The major reason might be the HRP’s
recirculation/outlet design which caused part of tracer leakage in each run of circulation.
From the lab observations, there were several dead spots of HRP shown in Fig. 4 and no
any in CSTR. Therefore, verifying the distance results of Stb by lab observations, there was
1
0 0.5
Ideal
CSTR
Ideal PFR
HRP: 0.949
CSTR: 0.942
dHRP = 0.949
dCSTR = 0.058
Sth
Fig. 7 The distances of Sth from ideal reactors in HRP and CSTR
2694 D.D.-W. Tsai et al.
8. more short-circuiting in HRP than in CSTR. In Fig. 5, this study tried to collect the literature
data and took Stb as the example index to present how to apply the distance method on short-
circuiting comparison. The results showed the degree of short-circuiting clearly and could be
compared among different types of reactor easily.
θ10 Index (θ100t10/t) Calculated by the time at 10 % tracer passed (t10) divided by τ, θ10 was
suggested as a good index for detecting the degree of short-circuiting because it had a
behavior concerning the capability of detecting the arrival of the tracer front (Teixeira and
Siqueira 2008). θ10 in HRP was 0.154 and in CSTR was 0.125. According to ideal reactor
models, θ10 of 1 and 0.105 (Stamou 2008) were estimated in ideal PFR and CSTR
respectively. We got the distances between ideal and our reactors, 0.846 in HRP and 0.02
in CSTR shown in Fig. 6. This result could prove it might exist more short-circuiting in HRP
than CSTR. This phenomenon might be contributed by the design of recirculation with the
outlet, the same reason we mentioned in Stb.
Thirumurthi’s Index (Sth01-tpeak/tmean) Thirumurthi suggested Sth was a good index for the
degree of short-circuiting (Thirumurthi 1969). 0.949 was in HRP and 0.942 in CSTR. In
Fig. 7, comparing to the distance of 0.058 in CSTR from ideal reactor and the value of 0.949
1
0 0.5
Ideal
CSTR
Ideal PFR
HRP: 0.063
CSTR: 0.063
dHRP = 0.937
dCSTR = 0.063
i
Fig. 8 The distances of ti from ideal reactors in HRP and CSTR
2
0 1
Ideal
CSTR
Ideal PFR
HRP: 1.217
CSTR: 1.077
dHRP = 0.217
dCSTR = 0.077
e
Fig. 9 The distances of e from ideal reactors in HRP and CSTR
2696 D.D.-W. Tsai et al.
9. in HRP, HRP showed more short-circuiting than CSTR. Again, recirculation/ outlet effect in
HRP possibly was the reason to explain this result.
Discussion The results in this category could be shown in Table 2. All above-mentioned
indexes demonstrated that there was more short-circuiting in HRP than in CSTR. In Table 2,
there were two indexes: (1) the index of short circuiting (τi) and (2) the index of modal
retention time (tp). For short-circuiting analysis, the distance from ideal reactors could
potentially indicate the strength of short-circuiting. ti showed the distance of 0.937 in
HRP was bigger than 0.063 in CSTR in Fig. 8. Those results exhibited the same conclusion
as Stb, θ10 and Sth: there was more short-circuiting in HRP than CSTR.
In the final index of 1 (10e(1-1/N)), the distance of HRP 0.424 was shorter than CSTR
0.446, presenting an opposite conclusion. The 1 index was the combination of effective
volume ratio (e) and tanks-in-series number (N). 1 was a pooled index and the combination
process could change the rationale of the original indexes to increase the uncertainty of the
comparison. Therefore, 1 failed to describe short-circuiting.
3.2.2 Same Ideal Values in Different Ideal Reactors
Effective Volume Ratio (e0tmean/t) We could use e to evaluate volume use in reactors. If
reactor volume was effectively used, the mean retention time (tmean) should be very close to
t. Then both e in ideal PFR and CSTR would equal to 1. The degree of short-circuiting
would be significantly affected by e where 1.217 and 1.077 were calculated in HRP and
CSTR respectively. Both results were larger than ideal value 1 to indicate the long retention
time. For HRP, the mechanism caused long tmean might be including of recirculation, axial
dispersion and dead zone. On the contrary, the up-flow design and vigorous circulation
inside the CSTR from the lab observation might be the reasons to delay tmean. From our
definition for short-circuiting, e>1 which presented a longer tmean than t, showed the
existence of short-circuiting. The comparison of the short-circuiting degree between the
reactors could be accomplished by the “distances”, 0.217 in HRP and 0.077 in CSTR shown
as Fig. 9; the comparison demonstrated that HRP existed a higher short-circuiting level than
CSTR as same as we observed in the lab.
Index of Short-Circuiting Flow (Qsc0Qin (1-t/tmean)) Qsc was highly related to t/tmean.
According to Cemagref’s definition (Cemagref 1983), dead volume or short-circuiting flow
would occur respectively if tmean<t or tmean>t. There were short-circuiting in our reactors
because both tmean were longer than t, 17.8 % in HRP and 7.1 % in CSTR. Applying tmean0t
0% 100%
50%
Ideal
CSTR
Ideal PFR
HRP: 17.8%
CSTR: 7.1%
dHRP = 17.8%
dCSTR = 7.1%
Qsc
Fig. 10 The distances of Qsc from ideal reactors in HRP and CSTR
A Method of Short-Circuiting Comparison 2697
11. in ideal PFR and CSTR, we could get Qsc were both equal to 0. The distances in Fig. 10
revealed that there were more short-circuiting in HRP than CSTR. The phenomenon of
recirculation causing short-circuiting in HRP was demonstrated again.
Dead Volume (Vd0Vp(1-tmean/t)) If we calculated the distances of Vd, we got dHRP>dCSTR
and proved it might exist more short-circuiting in HRP than CSTR. Therefore the distance
method could not only explain dead spots in HRP but also demonstrate more short-circuiting
in HRP.
Discussion In this category, all the analysis results could be shown in Table 3. The index of
average retention time (tc) could potentially point out the localizations in the reactor. From
Table 3, tc01.222 in HRP and tc01.082 in CSTR, we could get the result that more short-
circuiting existed in HRP than in CSTR as Fig. 11, dHRP>dCSTR.
In this category, the only one puzzle conclusion was from θ50 results. θ50 (θ500t50/t) was
used the concept that shorter t50 would promote the short-circuiting. In our calculation
0.999 was in HRP and 0.84 in CSTR. Using the “distance method”, the result of
dCSTR>dHRP in Fig. 12 exhibited a contradictory conclusion. The reason might be as
Teixeira and Siqueira explained that θ50 did not show a direct relation with the short-
circuit over a certain high short-circuit level (Teixeira and Siqueira 2008). In short,
they suggested θ50 was not a good short-circuit index. Accordingly, it was not
2
0 1
Ideal
CSTR
Ideal PFR
HRP: 1.222
CSTR: 1.082
dHRP = 0.222
dCSTR = 0.082
c
Fig. 11 The distances of tc from ideal reactors in HRP and CSTR
1
0 Ideal
CSTR: 1
(Stamou, 2008)
Ideal PFR
HRP: 0.999
CSTR: 0.840 dHRP = 0.001
dCSTR = 0.16
dCSTR = 0.252
Ideal
CSTR: 0.588
(From this study)
0.5
50
Fig. 12 The distances of θ50 from ideal reactors in HRP and CSTR
A Method of Short-Circuiting Comparison 2699
12. recommended to use θ50 as a short-circuit indicator when serious short-circuiting
existed.
3.2.3 Seldom Used Indexes
Searching though the literature, two seldom used indexes were evaluated in Table 4. (1) The
results of “hold back” parameter (HBP) were calculated and the distances of dHRP>dCSTR
were shown as Fig. 13. The reason might because the concept of area difference used in HBP
was similar to the “distance method” in mathematical sense. HBP comparisons were to
compare the areas under the RTD curves, so called area comparison. And distance method
was the comparison of two distances which was alike to the area comparison process in
mathematics.
(2) The Groche’s index (ICC) was an index to evaluate the degree of short-circuiting by
the area between t0tp - (tp –ti) and t0tp+(tp –ti) under RTD curve. ICC could not detect
short-circuiting in this study because the measure interval was unable to detect the difference
between initial tracer appearance time and peak time (ti0tp). It was possible to use ICC to
detect short-circuiting if measure interval was properly set. This index could be used to give
certain indication of the short-circuit level (Teixeira and Siqueira 2008).
3.3 General Discussion
According to the Fig. 2, these two types of reactors, CSTR and PFR, had completely
different distribution. Mathematically taking various types of reactor to compare each other,
Table 4 Results in the category of seldom used indexes
Index Definition Range Ideal
PFR
Ideal
CSTR
Lab HRP
(spike)
Lab
CSTR
(spike)
Evaluation Reference
Groche’s
index
(ICC)
The area below the
RTD function
between t0tp -
(tp –ti) and t0tp+
(tp –ti)
- 0 0 0 0 dHRP0dCSTR
(000)a
(Stamou and
Rodi 1984)
Hold back
parameter
(HBP)
The area below the
cumulative RTD
function from
0<θ<1
- 0 120.04 62.773 74.187 Distance dHRP>
dCSTR
(62.773>45.853)
(Stamou and
Adams 1988)
a
the conclusion was inconsistent with other indexes
0
2
1
0
Ideal
PFR
Ideal
CSTR
HRP: 62.773
CSTR:
74.187
dCSTR = 45.853
dHRP = 62.773
60
HBP
Fig. 13 The distances of HBP from ideal reactors in HRP and CSTR
2700 D.D.-W. Tsai et al.
13. the results will be weird. The basic theory in our method was to make the comparison in the
same type of distribution and then use the “distance method”. From this concept, the results
could offer comparable data on the degree of short-circuiting for all reactors in reality. And
we could solve the dilemma of application of short-circuiting indexes.
Three categories including of 13 short-circuiting indexes were studied here and indexes
offered certain different information in each category, because there were different explan-
atory mechanisms in different categories. The first category tended to show the effect of
circulation since the chosen parameters in each index were to detect front part of tracer
responses. The second category evaluated effective volume because the central tendency,
tmean or tcentroid, was applied to detect whole part of tracer. The third category assessed the
portion of RTD curve distribution.
4 Conclusions
Although the degree of short-circuiting among different types of reactor was very difficult to
compare, this study demonstrated the unique and the innovative “distance method” could
successfully accomplish this mission. All the short-circuiting indexes could practically
describe the degree of short-circuiting in all type of reactors except the θ50 index. We
recognized the puzzle conclusions of indexes’ interpretations came from different reactor
types basically. With the identification of reactor nature and type to ideal reactors, the
“distance method” would be the key to solve the comparison difficulty. We demonstrated
the “distance method” with reactor differentiation could provide more information on short-
circuiting to give a practical guide to improve reactor design. Hopefully this innovative
method would help us to know all the reactors better and to make reactor short-circuiting
comparison possible.
References
Burrows LJ, Stokes AJ, West JR, Forster CF, Martin AD (1999) Evaluation of different analytical methods for
tracer studies in aeration lanes of activated sludge plants. Water Res 33:367–374
Burrows LJ, West JR, Forster CF, Martin A (2001) Mixing studies in an Orbal activated sludge system. Water
SA 27:79–83
Cauchie HM, Salvia M, Weicherding J, Thomé JP, Hoffmann L (2000) Performance of a single-cell aerated
waste stabilization pond treating domestic wastewater: a three-year study. Int Rev Hydrobiol 85:231–251
Cemagref (1983) Les essais de traçage sur les installations d’épuration. CEMAGREF, Bordeaux, p 67
Dierberg FE, Juston JJ, DeBusk TA (2005) Relationship between hydraulic efficiency and phosphorus
removal in a submerged aquatic vegetation- dominated treatment wetland. Ecol Eng 25:9–23
Economopoulou MA, Tsihrintzis VA (2003) Design methodology and area sensitivity analysis of horizontal
subsurface flow constructed wetlands. Water Resour Manage 17:147–174
Escudié R, Conte T, Steyer JP, Delgenés JP (2005) Hydrodynamic and biokinetic models of an anaerobic
fixed-bed reactor. Process Biochem 40:2311–2323
Jupsin HE, Praet, Vasel JL (2003) Dynamic mathematical model of high rate algal ponds (HRAP). Water Sci
Technol 48:197–204
Kim YI, Bae BU (2007) Design and evaluation of hydraulic baffled-channel PAC contactor for taste and odor
removal from drinking water supplies. Water Res 41:2256–2264
Krishna GG, Kumar P, Kumar P (2009) Treatment of low-strength soluble wastewater using an anaerobic
baffled reactor (ABR). J Environ Manage 90:166–176
Li L (2004) Effects of initial microbial density on disinfection efficiency in a continuous flow system and
validation of disinfection batch kinetics in a continuous flow system. PhD Dissertation, Drexel University
Lima A, Hodouin D (2005) Residence time distribution of an industrial mechanically agitated cyanidation
tank. Miner Eng 18:613–621
A Method of Short-Circuiting Comparison 2701
14. Metcalf & Eddy Inc (2003) Wastewater engineering: Treatment and reuse, 4th edn. McGraw-Hill Professional,
New York
Ouarghi EI, Boumansour BE, Dufayt O, Hamouri EI, Vasel JL (2000) Hydrodynamics and oxygen balance in
a high-rate algal pond. Water Sci Technol 42:349–356
Padoley KV, Rajvaidya AS, Subbarao TV, Pandey RA (2006) Biodegradation of pyridine in a completely
mixed activated sludge process. Bioresource Technol 97:1225–1236
Persson J (2000) The hydraulic performance of ponds of various layouts. Urban Water 2:243–250
Persson J, Somes NLG, Wong THF (1999) Hydraulics efficiency of constructed wetlands and ponds. Water
Sci Technol 40:291–300
Saravanathamizhan R, Paranthamana R, Balasubramaniana N, Ahmed BC (2008) Residence time distribution in
continuous stirred tank electrochemical reactor. Chem Eng J 142:209–216
Singh S, Haberl R, Moog O, Shrestha RR, Shrestha P, Shrestha R (2009) Performance of an anaerobic baffled
reactor and hybrid constructed wetland treating high-strength wastewater in Nepal—A model for DEWATS.
Ecol Eng 35:654–660
Stamou AI (2008) Improving the hydraulic efficiency of water process tanks using CFD models. Chem Eng
Process 47:1179–1189
Stamou AI, Adams EW (1988) Study of the hydraulic behavior of a model settling tank using flow through curve
and flow patterns. Rep No SFB 210/E/36, Sonderforschungsbereich 210, Univ Karlsruhe, Karlsruhe,
Germany
Stamou AI, Rodi W (1984) Review of experimental studies on sedimentation tanks. Rep No sfb 210E/2, Univ
of Athens, Athens, Greece
Ta CT, Brignal WJ (1998) Application of computational fluid dynamics technique to storage reservoir studies.
Water Sci Technol 37:219–226
Teixeira EC, Siqueira R (2008) Performance assessment of hydraulic efficiency indexes. J Envir Engrg
134:851–859
Thackston EL, Shields FD, Schroeder PR (1987) Residence time distribution of shallow basins. J Envir Engrg
113:1319–1332
Thirumurthi D (1969) A break-through in the tracer studies of sedimentation tanks. J Water Pollut Control Fed
41:R405–R418
Tizghadam M, Dagot C, Baudu M (2008) Wastewater treatment in a hybrid activated sludge baffled reactor. J
Hazard Mater 154:550–557
Wang Y, Sanly BM, Leslie G (2009) Diagnosis of membrane bioreactor performance through residence time
distribution measurements — a preliminary study. Desalination 236:120–126
Xanthos S, Gong M, Ramalingam K, Fillos J, Deur A, Beckmann K, McCorquodale JA (2011) Performance
assessment of secondary settling tanks using CFD modeling. Water Resour Manage 25:1169–1182
Yu X, Putz G, Mazurek KA, Albers C (2008) Effect of columns on the flow behavior and residence time
distribution in a water treatment plant clearwell. CSCE 2008 Annual Conference, Canada
2702 D.D.-W. Tsai et al.