Download to read offline

![1/20/2018 4:41 PM, p. 2democracygps.org
Voters are frustrated, but have not
yet given up or irreversibly polarized
>85% polled think the two-party
presidential election system is
not working
[AP-NORC, 2016]
Voting rates have not
changed much in 100 years
[fairvote.com, 2016; electproject.org, 2014]
Polarization is
increasing, but
there is still a
large population
of moderates
[Pew, 2014]
Political Ideology, 1970-
2015](https://image.slidesharecdn.com/krenninstantrunoffhnobackup-180120164056/85/2016-Sanders-victory-with-instant-runoff-elections-2-320.jpg)
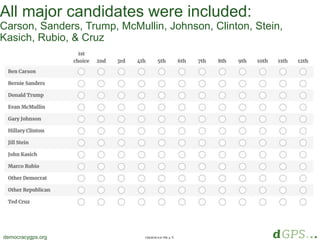
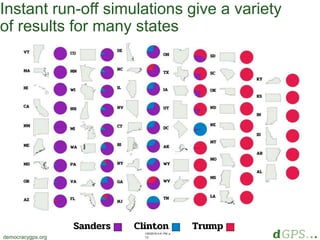
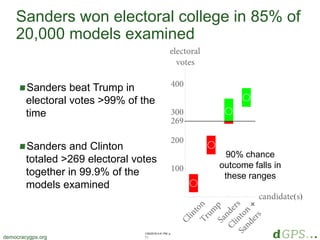

The document discusses the potential impact of ranked choice voting on the 2016 U.S. presidential election, suggesting that Bernie Sanders would likely have won under such a system. It highlights voter dissatisfaction with the current two-party system and provides analysis based on computer models and polls. The author advocates for the implementation of ranked choice voting to better represent voters' interests.


