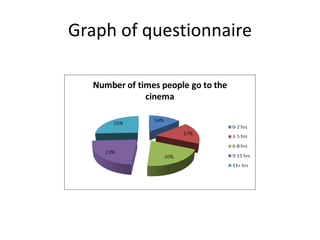
A graph was created to analyze the results of a questionnaire. The graph showed the responses to different questions in a visual format using bars or lines to represent numbers and percentages. It allowed viewers to quickly understand the main findings and comparisons from the questionnaire data in an easy to interpret graphical representation.