Census 2000 showed
that the United States
population was 281.4
million on April 1,
2000. Of the total, 4.1
million, or 1.5 percent,
reported1 American
Indian and Alaska
Native. This number
included 2.5 million
people, or 0.9 percent,
who reported only
American Indian and
Alaska Native in addi-
tion to 1.6 million peo-
ple, or 0.6 percent,
who reported American
Indian and Alaska
Native as well as one
or more other races.
The term American
Indian is often used in the text of this
report to refer to the American Indian and
Alaska Native population, while American
Indian and Alaska Native is used in the
text tables and graphs. Census 2000
asked separate questions on race and
Hispanic or Latino origin. Hispanics who
reported their race as American Indian
and Alaska Native, either alone or in com-
bination with one or more races, are
included in the number of American
Indians.
This report, part of a series that analyzes
population and housing data collected
from Census 2000, provides a portrait of
the American Indian population in the
United States and discusses its distribution
at both the national and subnational levels.
It begins by discussing the characteristics
of the total American Indian population and
then focuses on selected tribal groupings,2
for example, Navajo, Cherokee, or Eskimo.
The report is based on data from the
Census 2000 Summary File 1.3 The text of
this report discusses data for the United
States, including the 50 states and the
District of Columbia.4
U S C E N S U S B U R E A U
Helping You Make Informed Decisions
U.S. Department of Commerce
Economics and Statistics Administration
U.S. CENSUS BUREAU
Issued February 2002
C2KBR/01-15
The American Indian and Alaska
Native Population: 2000
Census 2000 Brief
By
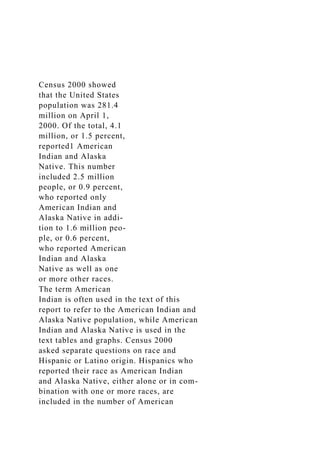
Stella U. OgunwoleFigure 1.
Reproduction of the Question on Race
From Census 2000
Source: U.S. Census Bureau, Census 2000 questionnaire.
What is this person's race? Mark one or more races to
indicate what this person considers himself/herself to be.
6.
White
Black, African Am., or Negro
American Indian or Alaska Native — Print name of enrolled or principal tribe.
Some other race — Print race.
Japanese
Korean
Vietnamese
Native Hawaiian
Guamanian or Chamorro
Samoan
Other Pacific Islander — Print race.
Asian Indian
Chinese
Filipino
Other Asian — Print race.
✗
1 In this report, the term “reported” is used to refer
to the answers provided by respondents, as well as
responses assigned during the editing and imputation
processes.
2 Tribal grouping refers to the combining of individ-
ual American Indian tribes, such as Alamo Navajo,
Tohajiileehee Navajo, and Ramah Navajo into the general
Navajo tribe, or the combining of individual Alaska
Native tribes such as American Eskimo, Eskimo and
Greenland Eskimo into the general Eskimo tribe.
3 Data from the Census 2000 Summary File 1 were
released on a state-by-state basis during the summer of
2001.
4 Data for the Commonwealth of Puerto Rico are
shown in Table 2 ...
Census 2000 showedthat the United Statespopulation was 281.docx
1. Census 2000 showed
that the United States
population was 281.4
million on April 1,
2000. Of the total, 4.1
million, or 1.5 percent,
reported1 American
Indian and Alaska
Native. This number
included 2.5 million
people, or 0.9 percent,
who reported only
American Indian and
Alaska Native in addi-
tion to 1.6 million peo-
ple, or 0.6 percent,
who reported American
Indian and Alaska
Native as well as one
or more other races.
The term American
Indian is often used in the text of this
report to refer to the American Indian and
Alaska Native population, while American
Indian and Alaska Native is used in the
text tables and graphs. Census 2000
asked separate questions on race and
Hispanic or Latino origin. Hispanics who
reported their race as American Indian
and Alaska Native, either alone or in com-
bination with one or more races, are
included in the number of American
2. Indians.
This report, part of a series that analyzes
population and housing data collected
from Census 2000, provides a portrait of
the American Indian population in the
United States and discusses its distribution
at both the national and subnational levels.
It begins by discussing the characteristics
of the total American Indian population and
then focuses on selected tribal groupings,2
for example, Navajo, Cherokee, or Eskimo.
The report is based on data from the
Census 2000 Summary File 1.3 The text of
this report discusses data for the United
States, including the 50 states and the
District of Columbia.4
U S C E N S U S B U R E A U
Helping You Make Informed Decisions
U.S. Department of Commerce
Economics and Statistics Administration
U.S. CENSUS BUREAU
Issued February 2002
C2KBR/01-15
The American Indian and Alaska
Native Population: 2000
Census 2000 Brief
3. By
Stella U. OgunwoleFigure 1.
Reproduction of the Question on Race
From Census 2000
Source: U.S. Census Bureau, Census 2000 questionnaire.
What is this person's race? Mark one or more races to
indicate what this person considers himself/herself to be.
6.
White
Black, African Am., or Negro
American Indian or Alaska Native — Print name of enrolled or
principal tribe.
Some other race — Print race.
Japanese
Korean
Vietnamese
Native Hawaiian
Guamanian or Chamorro
Samoan
Other Pacific Islander — Print race.
Asian Indian
Chinese
Filipino
Other Asian — Print race.
✗
4. 1 In this report, the term “reported” is used to refer
to the answers provided by respondents, as well as
responses assigned during the editing and imputation
processes.
2 Tribal grouping refers to the combining of individ-
ual American Indian tribes, such as Alamo Navajo,
Tohajiileehee Navajo, and Ramah Navajo into the general
Navajo tribe, or the combining of individual Alaska
Native tribes such as American Eskimo, Eskimo and
Greenland Eskimo into the general Eskimo tribe.
3 Data from the Census 2000 Summary File 1 were
released on a state-by-state basis during the summer of
2001.
4 Data for the Commonwealth of Puerto Rico are
shown in Table 2 and Figure 3.
2 U.S. Census Bureau
The term “American Indian and
Alaska Native” refers to people hav-
ing origins in any of the original peo-
ples of North and South America
(including Central America), and who
maintain tribal affiliation or commu-
nity attachment. It includes people
who reported “American Indian and
Alaska Native” or wrote in their prin-
cipal or enrolled tribe.
Data on race have been collected
since the first U.S. decennial census in
5. 1790. American Indians were first
enumerated as a separate group in
the 1860 census. The 1890 census
was the first to count American
Indians throughout the country. Prior
to 1890, enumeration of American
Indians was limited to those living in
the general population of the various
states; American Indians in American
Indian Territory and on American
Indian reservations were not included.
Alaska Natives, in Alaska, have been
counted since 1880, but until 1940,
they were generally reported in the
“American Indian” racial category.
They were enumerated separately
(as Eskimo and Aleut) in 1940 in
Alaska. In the 1970 census, sepa-
rate response categories were used
to collect data on the Eskimo and
Aleut population only in Alaska.
The 1980 census was the first in
which data were collected separately
for Eskimos and Aleuts in all states.
The 1990 census used three sepa-
rate response categories to collect
data on the American Indian and
Alaska Native population.
Census 2000 used a combined
“American Indian or Alaska Native”
response category to collect data on
both the American Indian and Alaska
Native population. Also, respondents
6. were asked to provide the name of
their enrolled or principal tribes.
Previous decennial censuses collect-
ed data on both American Indian and
Alaska Native tribes. However,
Census 2000 provides more exten-
sive data for tribes than ever before.
The question on race was
changed for Census 2000.
All U.S. censuses have obtained
information on race for every indi-
vidual and for the past several cen-
suses, the responses reflect self-
identification. For Census 2000,
however, respondents were asked to
report one or more races they con-
sidered themselves and other mem-
bers of their households to be.5
Because of these changes, the
Census 2000 data on race are not
directly comparable with data from
the 1990 census or earlier census-
es. Caution must be used when
interpreting changes in the racial
composition of the United States
population over time.
The Census 2000 question on race
included 15 separate response cate-
gories and 3 areas where respon-
dents could write in a more specific
race (see Figure 1). For some pur-
7. poses, including this report, the
response categories and write-in
answers were combined to create
the five standard Office of
Management and Budget race cate-
gories, plus the Census Bureau cate-
gory of “Some other race.” The six
race categories include:
• White;
• Black or African American;
• American Indian and Alaska
Native;
• Asian;
• Native Hawaiian and Other
Pacific Islander; and
• Some other race
For a complete explanation of the
race categories used in Census
2000, see the Census 2000 Brief,
Overview of Race and Hispanic
Origin.6
The data collected by Census
2000 on race can be divided
into two broad categories: the
race alone population and the
race in combination population.
People who responded to the ques-
8. tion on race by indicating only one
race are referred to as the race
alone population. For example,
respondents who reported their
race only as American Indian or
Alaska Native on the census ques-
tionnaire would be included in the
American Indian alone population.
Individuals who reported more than
one of the six races are referred to
as the race in combination popula-
tion. For example, respondents who
reported they were “American
Indian and White” or “American
Indian and Black or African
American and Asian”7 would be
included in the American Indian in
combination population.
5 Other changes included terminology
and formatting changes, such as spelling out
“American” instead of “Amer.” for the
American Indian or Alaska Native category
and adding “Native” to the Hawaiian
response category. In the layout of the
Census 2000 questionnaire, the seven Asian
response categories were alphabetized and
grouped together, as were the four Pacific
Islander categories after the Native Hawaiian
category. The three separate American
Indian and Alaska Native identifiers in the
1990 census (i.e., Indian (Amer.), Eskimo,
and Aleut) were combined into a single iden-
tifier in Census 2000. Also, American
Indians and Alaska Natives could report
9. more than one tribe.
6 Overview of Race and Hispanic Origin:
2000, U.S. Census Bureau, Census 2000
Brief, C2KBR/01-1, March 2001, is available
on the U.S. Census Bureau’s Internet site at
www.census.gov/population/www/cen2000/
briefs.html.
7 The race in combination categories are
denoted by quotations around the combina-
tions with the conjunction and in bold and
italicized print to indicate the separate races
that comprise the combination.
The maximum number of
people reporting American
Indian is reflected in the
American Indian alone or in
combination population.
One way to define the American
Indian population is to combine
those respondents who reported
only American Indian with those
who reported American Indian as
well as one or more other races.
This creates the American Indian
alone or in combination popula-
tion. Another way to think of the
American Indian alone or in combi-
nation population is the total num-
ber of people who identified entire-
ly or partially as American Indian.
10. This group is also described as
people who reported American
Indian, whether or not they report-
ed any other races.
Census 2000 provides a
snapshot of the American
Indian population.
Table 1 shows the number and per-
centage of Census 2000 respon-
dents who reported American
Indian alone as well as those who
reported American Indian and at
least one other race.
Of the total United States popula-
tion, 2.5 million people, or 0.9 per-
cent, reported only American
Indian. An additional 1.6 million
people reported American Indian
and at least one other race. Within
this group, the most common com-
binations were “American Indian
and Alaska Native and White”
(66 percent), followed by
“American Indian and Alaska Native
and Black or African American”
(11 percent), “American Indian and
Alaska Native and White and Black
or African American” (6.8 percent),
and “American Indian and Alaska
Native and Some other race”
(5.7 percent). These four combina-
tion categories accounted for
11. 90 percent of all American Indians
who reported two or more races.
Thus 4.1 million people, or
1.5 percent, of the total popula-
tion, reported American Indian
alone or in combination with one
or more races.
The American Indian
population increased faster
than the total population
between 1990 and 2000.
Because of the changes made to the
question on race for Census 2000,
there are at least two ways to pres-
ent the change in the total number
of American Indians in the United
States. They include: 1) the differ-
ence in the American Indian popula-
tion between 1990 and 2000 using
the race alone concept for 2000
and 2) the difference in the
American Indian population
between 1990 and 2000 using the
race alone or in combination con-
cept for 2000. These comparisons
provide a “minimum-maximum”
range for the change in the
American Indian population
between 1990 and 2000.
The 1990 census showed there
were nearly 2 million American
Indians. Using the American Indian
alone population in 2000, this pop-
12. ulation increased by 516,722, or 26
percent, between 1990 and 2000.
If the American Indian alone or in
combination population is used, an
increase of 2.2 million, or 110 per-
cent, results. Thus, from 1990 to
2000, the range for the increase in
the American Indian population was
26 percent to 110 percent. In com-
parison, the total population grew
by 13 percent from 248.7 million in
1990 to 281.4 million in 2000.
THE GEOGRAPHIC
DISTRIBUTION OF THE
AMERICAN INDIAN
POPULATION
The following discussion of the geo-
graphic distribution of the American
Indian population focuses on the
American Indian alone or in combi-
nation population in the text. As the
upper bound of the American Indian
population, this group includes all
respondents who reported
American Indian, whether or not
U.S. Census Bureau 3
Table 1.
American Indian and Alaska Native Population: 2000
(For information on confidentiality protection, nonsampling
error, and definitions, see
www.census.gov/prod/cen2000/doc/sf1.pdf)
13. Race
Number
Percent of
total
population
Total population . . . . . . . . . . . . . . . . . . . . . . . . . . . . . . . . . . .
. . . . . 281,412,906 100.0
American Indian and Alaska Native alone or in combination
with
one or more other races . . . . . . . . . . . . . . . . . . . . . . . . . . . . . .
. . . . . 4,119,301 1.5
American Indian and Alaska Native alone . . . . . . . . . . . . . . . .
. . . 2,475,956 0.9
American Indian and Alaska Native in combination with one or
more other races. . . . . . . . . . . . . . . . . . . . . . . . . . . . . . . . . . .
. . . . . 1,643,345 0.6
American Indian and Alaska Native; White . . . . . . . . . . . . . . .
. . 1,082,683 0.4
American Indian and Alaska Native; Black or African
American . . . . . . . . . . . . . . . . . . . . . . . . . . . . . . . . . . . . . . . .
. . . . . 182,494 0.1
American Indian and Alaska Native; White; Black or African
American . . . . . . . . . . . . . . . . . . . . . . . . . . . . . . . . . . . . . . . .
. . . . . 112,207 -
American Indian and Alaska Native; Some other race . . . . . . .
93,842 -
All other combinations including American Indian and Alaska
Native . . . . . . . . . . . . . . . . . . . . . . . . . . . . . . . . . . . . . . . . . .
. . . . . . 172,119 0.1
Not American Indian and Alaska Native alone or in combination
14. with one or more other races . . . . . . . . . . . . . . . . . . . . . . . . . .
. . . . . 277,293,605 98.5
- Percentage rounds to 0.0.
Source: U.S. Census Bureau, Census 2000 Summary File 1.
they reported any other race.8
Hereafter in the text of this section,
the term “American Indian” will be
used to refer to those who reported
American Indian, whether they
reported one race or more than one
race. However, in the tables and
graphs, data for both the American
Indian alone and American Indian
alone or in combination populations
are shown.
Four out of ten American
Indians lived in the West.9
According to Census 2000, of all
respondents who reported
American Indian, 43 percent lived in
the West, 31 percent lived in the
South, 17 percent lived in the
Midwest, and 9 percent lived in the
Northeast (see Figure 2).
The West had the largest American
Indian population, as well as the
highest proportion of American
15. Indians in its total population:
2.8 percent of all respondents in
the West and 1.3 percent in the
South reported American Indian and
Alaska Native, compared with
1.1 percent in the Midwest, and
0.7 percent in the Northeast.
Over half of all people who
reported American Indian
lived in just ten states.
The ten states with the largest
American Indian populations in
2000, in order, were California,
Oklahoma, Arizona, Texas, New
Mexico, New York, Washington,
North Carolina, Michigan, and
Alaska (see Table 2). Florida was the
only other state with greater than
100,000 American Indian popula-
tion. Combined, these 11 states
included 62 percent of the total
American Indian population, but
only 44 percent of the total popula-
tion. California (627,562) and
Oklahoma (391,949) combined
included about 25 percent of the
total American Indian population.
There were 19 states where the
American Indian population exceed-
ed the U.S. proportion of 1.5 per-
cent, led by the western state of
Alaska (19 percent), followed by the
southern state of Oklahoma
16. (11 percent), and the western state
of New Mexico (10 percent). The
other 16 states included the west-
ern states of Arizona, California,
Colorado, Idaho, Montana, Nevada,
Hawaii, Oregon, Utah, Washington,
and Wyoming; the midwestern
states of Kansas, Minnesota, North
Dakota, and South Dakota; and the
southern state of North Carolina.
No northeastern state had more
than 1.5 percent of its population
reporting as American Indian. Five
states, Alaska, Oklahoma, New
Mexico, Arizona, and Washington
were represented in the top ten
states in both number and percent
reporting as American Indian.
American Indians were less than
1 percent of the total population in
21 states including Pennsylvania,
New Jersey, West Virginia, Illinois,
Massachusetts, Kentucky, Iowa,
New Hampshire, Indiana, Georgia,
Ohio, South Carolina, Mississippi,
Tennessee, Connecticut, Florida,
Maryland, Virginia, Delaware, New
York, and the District of Columbia,
a state equivalent. While Texas had
the fourth largest American Indian
population of all states, it ranked
26th in percent of American Indian
among the 50 states and the
District of Columbia, with only
17. 1 percent of respondents reporting
American Indian. Wyoming had the
44th largest American Indian popu-
lation, but ranked 8th in percent of
the American Indian population
among the 50 states and the
District of Columbia.
The American Indian
population was concentrated
in counties in the West and
Midwest.
American Indians were the majority
of the population in 14 counties in
the West and 12 counties in the
Midwest (see Figure 3). In the West,
the counties were in four states:
Alaska, Arizona, Montana, and Utah.
In the Midwest, the counties were
also in four states: South Dakota,
Wisconsin, North Dakota, and
Nebraska.
Of the 3,141 counties or county
equivalents in the United States,
786 counties met or exceeded the
U.S. level of 1.5 percent of the total
American Indian population, while
the proportion reporting American
Indian was below the national aver-
age in 2,355 counties.
The counties with their proportion
reporting American Indian above the
national average were located mostly
18. west of the Mississippi River. Within
this area, several clusters of counties
with high percentages of American
Indians were distinctly noticeable.
Alaska Natives accounted for over
50 percent of the population in near-
ly all of the boroughs and census
areas (county equivalents) in north-
ern and western Alaska. In the
Southwest, American Indians were
represented in high percentages (and
4 U.S. Census Bureau
8 The use of the alone or in combination
population in this section does not imply
that it is the preferred method of presenting
or analyzing data. In general, either the
alone population or the alone or in combina-
tion population can be used, depending on
the purpose of the analysis. The Census
Bureau uses both approaches.
9 The West region includes the states of
Alaska, Arizona, California, Colorado, Hawaii,
Idaho, Montana, Nevada, New Mexico,
Oregon, Utah, Washington, and Wyoming.
The South region includes the states of
Alabama, Arkansas, Delaware, Florida,
Georgia, Kentucky, Louisiana, Maryland,
Mississippi, North Carolina, Oklahoma, South
Carolina, Tennessee, Texas, Virginia, West
Virginia, and the District of Columbia, a state
equivalent. The Midwest region includes the
states of Illinois, Indiana, Iowa, Kansas,
Michigan, Minnesota, Missouri, Nebraska,
19. North Dakota, Ohio, South Dakota, and
Wisconsin. The Northeast region includes the
states of Connecticut, Maine, Massachusetts,
New Hampshire, New Jersey, New York,
Pennsylvania, Rhode Island, and Vermont.
Table 2.
American Indian and Alaska Native Population for the United
States, Regions, and States,
and for Puerto Rico: 1990 and 2000
(For information on confidentiality protection, nonsampling
error, and definitions, see
www.census.gov/prod/cen2000/doc/sf1.pdf)
Area
1990 2000
Total
population
American Indian and Alaska
Native population
Total
population
American Indian and
Alaska Native alone
population
American Indian and
Alaska Native alone or
20. in combination
population
American Indian and
Alaska Native in
combination population
Number
Percent of
total
population Number
Percent of
total
population Number
Percent of total
population Number
Percent of
American
Indian and
Alaska Native
alone or in
combination
population
United States . . . . . . . . . . 248,709,873 1,959,234 0.8
24. 93,301 1.6 158,940 2.7 65,639 41.3
West Virginia . . . . . . . . . 1,793,477 2,458 0.1 1,808,344 3,606
0.2 10,644 0.6 7,038 66.1
Wisconsin . . . . . . . . . . . 4,891,769 39,387 0.8 5,363,675
47,228 0.9 69,386 1.3 22,158 31.9
Wyoming . . . . . . . . . . . . 453,588 9,479 2.1 493,782 11,133 2.3
15,012 3.0 3,879 25.8
Puerto Rico . . . . . . . . . . . 3,522,037 (X) (X) 3,808,610 13,336
0.4 26,871 0.7 13,535 50.4
X Not applicable.
Source: U.S. Census Bureau, Census 2000 Summary File 1;
1990 Census of Population, General Population Characteristics
(1990 CP-1).
U.S. Census Bureau 5
6 U.S. Census Bureau
also in large numbers) in the coun-
ties in the Four Corners area of
Arizona, New Mexico, Utah, and
Colorado (where the boundaries of
these four states meet). In the Great
Plains, American Indians were con-
centrated in a cluster of counties in
central and western South Dakota,
southeastern Montana, and in sever-
al counties along the U.S.-Canadian
border in Montana and North
Dakota. In the southern Plains,
American Indians accounted for rela-
tively high percentages of the popu-
25. lation in a cluster of counties in east-
ern Oklahoma. American Indians
accounted for more than the U.S.
level of 1.5 percent in all but one
county (Harper County) in
Oklahoma.
East of the Mississippi, counties in
which American Indians were repre-
sented in percentages higher than
the U.S. level of 1.5 percent were
scattered throughout the South,
Northeast, and upper Midwest. Two
clusters of counties in North
Carolina — one in the extreme
southwest of the state and the
other in the southeast — were evi-
dent; each cluster was anchored by
a county in which American Indians
accounted for over 25 percent of
the population. Elsewhere in the
South, groups of counties in which
American Indians were represented
at greater than the U.S. proportion
were found in central Louisiana,
portions of the Gulf Coast, northern
Alabama, and in eastern Virginia.
In the Northeast, counties meeting
or exceeding the national proportion
of American Indians tended to be
nonmetropolitan and along the U.S.
and Canadian border of New York,
Vermont, and Maine, although con-
centrations were found in the New
York city area, metropolitan Rhode
26. Island and Connecticut, and in west-
ern New York. In the Midwest, coun-
ties with high percentages of
American Indians were located
primarily across northern Minnesota,
Wisconsin, and Michigan. In general,
counties throughout most of the
lower Midwest, upper South, and
Northeast were distinguished by
very low percentages of American
Indians.
The places with the largest
American Indian populations
were New York and Los
Angeles.
Census 2000 showed that, of all
places in the United States with
100,000 or more population,10 New
York and Los Angeles had the largest
American Indian populations with
87,241 and 53,092, respectively (see
Table 3). The next eight places with
the largest American Indian popula-
tions had between 15,743 and
35,093 American Indians. Five of the
top ten places — Los Angeles,
Phoenix, San Diego, Anchorage, and
Albuquerque — were in the West.
The ten largest places for American
Indians together accounted for
8.2 percent of the total U.S.
American Indian population. New
27. York and Los Angeles accounted for
3.4 percent of the total American
Indian population (see Table 3). Of
the ten largest places in the United
States, Phoenix (2.7 percent) had
the largest proportion of American
Indians, followed by Los Angeles
(1.4 percent), and San Diego and
San Antonio, each with 1.3 percent.
Among places of 100,000 or more
population, the highest proportion of
American Indians was in Anchorage
(10 percent) as shown in Figure 4.
Tulsa was the second highest. Six of
the top ten places with the highest
proportion of American Indians were
in the West, with two each in the
Midwest and South.
ADDITIONAL FINDINGS ON
THE AMERICAN INDIAN
AND ALASKA NATIVE
POPULATION
What proportion of American
Indians and Alaska Natives
reported a tribe?
In Census 2000, people who identi-
fied themselves as American Indian
Figure 2.
Percent Distribution of the American Indian and
Alaska Native Population by Region: 2000
28. Source: U.S. Census Bureau, Census 2000 Summary File 1.
(For information on confidentiality protection, nonsampling
error, and definitions,
see www.census.gov/prod/cen2000/doc/sf1.pdf)
American Indian
and Alaska Native
alone or in
combination
American Indian
and Alaska
Native alone
Northeast WestSouthMidwest
9.1 17.4 30.6 43.0
6.6 16.1 29.3 48.0
10 Census 2000 showed 245 places in the
United States with 100,000 or more popula-
tion. They included 238 incorporated places
(including 4 city-county consolidations) and
7 census designated places that are not
legally incorporated. For a list of these
places by state, see www.census.gov/
population/www/cen2000/phc-t6.html.
19.0 (AK)
29. 5.0 to 12.8
1.5 to 4.9
0.4 to 1.4
U.S. percent 1.5
Percent American Indian and
Alaska Native Alone or
In Combination: 2000
People indicating
one or more races
including AIAN as a
percent of total
population by state
People indicating
one or more races
including
American Indian
and Alaska Native
(AIAN), as a
percent of total
population by
county
75.0 to 95.1
50.0 to 74.9
25.0 to 49.9
1.5 to 24.9
30. 0.0 to 1.4
U.S. percent 1.5
Figure 3.
(For information on confidentiality protection, nonsampling
error, and
definitions, see www.census.gov/prod/cen2000/doc/sf1.pdf)
Source: U.S. Census Bureau, Census 2000 Summary
File 1. American FactFinder at factfinder.census.gov
provides census data and mapping tools.
0 100 Miles0 100 Miles0 100 Miles
0 100 Miles
U
.S
. C
e
n
su
s B
u
re
a
u
7
31. or Alaska Native on the question-
naire were asked to report their
enrolled or principal tribe.
Additionally, respondents could
report one or more tribes (see Table
4). Among respondents who report-
ed as American Indian, 79 percent,
or 2.0 million people, specified a
tribe. For those who reported
American Indian in any combination,
67 percent, or 1.1 million people,
reported a tribe. For all people
reporting American Indian either
alone or in any combination, 74 per-
cent, or 3.1 million people, identified
a tribe.
Which American Indian tribal
groupings were the largest?
According to Census 2000, the
American Indian tribal groupings
with 100,000 or more people or
responses were Cherokee, Navajo,
Latin American Indian,11 Choctaw,
Sioux, and Chippewa (see Figure 5
and Table 5).12 These six tribal
groups accounted for 40 percent of
all respondents who reported a sin-
gle grouping or race. Of all
American Indian tribal groupings in
any combination, these six tribal
groups accounted for 42 percent of
all responses. There were 281,069
respondents who reported
32. Cherokee alone and an additional
448,464 who reported Cherokee
with at least one other race or
American Indian tribal grouping. A
total of 729,533 people reported
Cherokee alone or in combination
with one or more other race or
American Indian tribal groupings.
Navajo and Latin American were the
next two largest specified American
Indian tribal groupings. There were
269,202 people who reported
Navajo alone and an additional
28,995 people who reported Navajo
in combination with one or more
other races or American tribal
groupings. This gives a total of
298,197 people who reported
Navajo alone or in combination with
at least one other race or American
Indian tribal groupings. There were
104,354 people who reported only
Latin American Indian and an addi-
tional 76,586 who reported Latin
American in combination with one
or more other races or American
Indian tribal groupings. A total of
180,940 people reported Latin
American Indian alone or in combi-
nation with at least one other race
or American Indian tribal groupings.
Which Alaska Native tribal
groupings were the largest?
33. In 2000, Eskimo was the largest
Alaska Native tribal grouping alone
or in any combination, followed by
Tlingit-Haida, Alaska Athabascan,
and Aleut. These four tribal group-
ings combined accounted for
3.6 percent of all American Indian
8 U.S. Census Bureau
Table 3.
Ten Largest Places in Total Population and in American Indian
and Alaska Native
Population: 2000
(For information on confidentiality protection, nonsampling
error, and definitions, see
www.census.gov/prod/cen2000/doc/sf1.pdf)
Place
Total population
American Indian and
Alaska Native alone
American Indian and
Alaska Native alone
or in combination
Percent of total population
Rank Number Rank Number Rank Number
American
Indian and
34. Alaska
Native alone
American
Indian and
Alaska Native
alone or in
combination
New York, NY. . . . . . . . 1 8,008,278 1 41,289 1 87,241 0.5 1.1
Los Angeles, CA . . . . . 2 3,694,820 2 29,412 2 53,092 0.8 1.4
Chicago, IL . . . . . . . . . . 3 2,896,016 9 10,290 8 20,898 0.4 0.7
Houston, TX . . . . . . . . . 4 1,953,631 11 8,568 10 15,743 0.4
0.8
Philadelphia, PA. . . . . . 5 1,517,550 24 4,073 21 10,835 0.3 0.7
Phoenix, AZ . . . . . . . . . 6 1,321,045 3 26,696 3 35,093 2.0 2.7
San Diego, CA . . . . . . . 7 1,223,400 13 7,543 9 16,178 0.6 1.3
Dallas, TX . . . . . . . . . . . 8 1,188,580 18 6,472 18 11,334 0.5
1.0
San Antonio, TX. . . . . . 9 1,144,646 10 9,584 12 15,224 0.8 1.3
Detroit, MI . . . . . . . . . . . 10 951,270 40 3,140 25 8,907 0.3 0.9
Oklahoma, OK . . . . . . . 29 506,132 6 17,743 5 29,001 3.5 5.7
Tucson, AZ . . . . . . . . . . 30 486,699 8 11,038 11 15,358 2.3 3.2
Albuquerque, NM. . . . . 35 448,607 7 17,444 7 22,047 3.9 4.9
Tulsa, OK . . . . . . . . . . . 43 393,049 5 18,551 4 30,227 4.7 7.7
Anchorage, AK . . . . . . . 65 260,283 4 18,941 6 26,995 7.3 10.4
Source: U.S. Census Bureau, Census 2000 Summary File 1.
11 In 1997, the Office of Management and
Budget definition of American Indian or Alaska
Native included the original peoples of North
and South America (including Central America).
35. 12 Table 5 contains all American Indian and
Alaska Native tribal groupings that contained at
least 7,000 people according to the 1990 cen-
sus. Additional information on individual tribes
is forthcoming.
and Alaska Native tribal responses
alone and 2.7 percent alone or in
any combination (see Figure 6 and
Table 5).
There were 45,919 respondents
who reported Eskimo alone and an
additional 8,842 who reported
Eskimo with at least one other race
or American Indian or Alaska Native
tribal grouping. A total of 54,761
people reported Eskimo alone or in
combination with one or more other
races or American Indian or Alaska
Native tribal groupings.
Tlingit-Haida, Alaska Athabascan,
and Aleut were the next three
largest specified Alaska Native tribal
groupings. There were 14,825 peo-
ple who reported Tlingit-Haida
alone and an additional 7,540 who
reported Tlingit-Haida with at least
one other race or American Indian
or Alaska Native tribal groupings. A
total of 22,365 people reported
36. Tlingit-Haida alone or in combina-
tion with one or more other races
or American Indian or Alaska Native
tribal groupings.
There were 14,520 people who
reported only Alaska Athabascan
and an additional 4,318 people who
reported Alaska Athabascan with
one or more other races or
American Indian or Alaska Native
tribal groupings. A total of 18,838
people reported Alaska Athabascan
alone or in combination with at
least one or more other races or
American Indian or Alaska Native
tribal groupings.
Also, there were 11,941 people who
reported only Aleut and an addition-
al 5,037 people who reported Aleut
with one or more other races or
American Indian or Alaska Native
tribal groupings. A total of 16,978
people reported Aleut alone or in
combination with at least one or
more other races or American Indian
or Alaska Native tribal groupings.
What proportion of American
Indians and Alaska Natives
reported more than one tribal
grouping?
The proportion of respondents
37. reporting a tribe with at least one
other race or American Indian tribal
grouping varied among the ten
largest American Indian tribal
groupings (see Table 5). Of all the
respondents who reported more
than one race or American Indian
tribal grouping, the Blackfeet tribal
grouping had the highest propor-
tion, with 68 percent. The next two
tribal groupings with the highest
proportion of respondents reporting
at least one other race or American
Indian tribal grouping were
Cherokee (62 percent) and Choctaw
(45 percent). Of the ten largest
American Indian tribal groupings,
the Navajo had the lowest propor-
tion (9.7 percent) reporting more
than one race or American Indian
tribal grouping, followed by Pueblo
(19.6 percent).
Among the largest Alaska Native
tribal groupings, the highest pro-
portion of all respondents who
reported more than one race or
American Indian or Alaska Native
tribal groupings was the Tlingit-
Haida with 34 percent. The other
tribal groupings with respondents
reporting at least one other race or
American Indian or Alaska Native
tribal grouping were Aleut (30 per-
cent) and Alaska Athabascan
(23 percent). The Eskimo had the
38. lowest proportion of respondents
(16 percent) reporting more than
one race or American Indian tribal
grouping.
U.S. Census Bureau 9
Figure 4.
Ten Places of 100,000 or More Population With the
Highest Percentage of American Indians and
Alaska Natives: 2000
Source: U.S. Census Bureau, Census 2000 Summary File 1.
(For information on confidentiality protection, nonsampling
error, and definitions
see www.census.gov/prod/cen2000/doc/sf1.pdf)
American Indian and Alaska Native alone or in combination
American Indian and Alaska Native alone
Sacramento, CA
Spokane, WA
Tucson, AZ
Minneapolis, MN
Tacoma, WA
Green Bay, WI
Albuquerque, NM
39. Oklahoma City, OK
Tulsa, OK
Anchorage, AK
2.8
7.3
10.4
4.7
7.7
3.5
5.7
3.9
4.9
3.3
4.1
2.0
3.6
2.2
3.3
2.3
3.2
1.8
3.0
40. 1.3
ABOUT CENSUS 2000
Why did Census 2000 ask the
question on race?
The Census Bureau collects data on
race to fulfill a variety of legislative
and program requirements. Data on
race are used in the legislative redis-
tricting process carried out by the
states and in monitoring local juris-
dictions’ compliance with the Voting
Rights Act. These data are also
essential for evaluating federal pro-
grams that promote equal access to
employment, education, and hous-
ing and for assessing racial dispari-
ties in health and exposure to envi-
ronmental risks. More broadly, data
on race are critical for research that
underlies many policy decisions at
all levels of government.
How do data from the
question on race benefit me,
my family, and my
community?
All levels of government need infor-
mation on race to implement and
evaluate programs or enforce laws.
41. Examples include: the Native
American Programs Act, the Equal
Employment Opportunity Act, the
Civil Rights Act, the Voting Rights
Act, the Public Health Act, the
Healthcare Improvement Act, the
Job Partnership Training Act, the
Equal Credit Opportunity Act, the
Fair Housing Act, and the Census
Redistricting Data Program.
Both public and private organiza-
tions use race information to find
areas where groups may need spe-
cial services and to plan and imple-
ment education, housing, health,
and other programs that address
these needs. For example, a school
system might use this information to
design cultural activities that reflect
the diversity in their community. Or
a business could use it to select the
mix of merchandise it will sell in a
new store. Census information also
helps identify areas where residents
might need services of particular
importance to certain racial or ethnic
groups, such as screening for hyper-
tension or diabetes.
FOR MORE INFORMATION
For more information on race in
the United States, visit the U.S.
Census Bureau’s Internet site at
42. www.census.gov/population/www/
socdemo/race.html.
10 U.S. Census Bureau
Table 4.
Specified Tribe Reported by American Indians and Alaska
Natives: 2000
(For information on confidentiality protection, nonsampling
error, and definitions, see
www.census.gov/prod/cen2000/doc/sf1.pdf)
American Indian and Alaska Native
Whether or not
tribe specified
Total Alone In combination
Number Percent Number Percent Number Percent
Total. . . . . . . . . . . . . 4,119,301 100.0 2,475,956 100.0
1,643,345 100.0
Tribe specified . . . . 3,062,844 74.4 1,963,996 79.3 1,098,848
66.9
Tribe not specified . 1,056,457 25.6 511,960 20.7 544,497 33.1
Source: U.S. Census Bureau, Census 2000 Summary File 1.
Figure 5.
Ten Largest American Indian Tribal Groupings: 2000
Source: U.S. Census Bureau, Census 2000 Summary File 1.
(For information on confidentiality protection, nonsampling
43. error, and definitions,
see www.census.gov/prod/cen2000/doc/sf1.pdf)
American Indian tribal grouping alone or in any combination
American Indian tribal grouping alone
Pueblo
Iroquois
Blackfeet
Apache
Chippewa
Sioux
Choctaw
Latin American
Indian
Navajo
Cherokee
74,085
281,069
729,533
269,202
298,197
180,940
45. American and Alaska
Native alone
American Indian and Alaska
Native in combination
with one or more races
American Indian
and Alaska Native
tribal grouping
alone or in any
combination1
One tribal
grouping
reported
More than one
tribal grouping
reported1
One tribal
grouping
reported
More than one
tribal grouping
reported1
Total. . . . . . . . . . . . . . . . . . . . . . . . . . . 2,423,531 52,425
1,585,396 57,949 4,119,301
Apache . . . . . . . . . . . . . . . . . . . . . . . . . . . . 57,060 7,917
48. 195,902
Alaska Athabascan . . . . . . . . . . . . . . . . . . 14,520 815 3,218
285 18,838
Aleut. . . . . . . . . . . . . . . . . . . . . . . . . . . . . . . 11,941 832
3,850 355 16,978
Eskimo. . . . . . . . . . . . . . . . . . . . . . . . . . . . . 45,919 1,418
6,919 505 54,761
Tlingit-Haida . . . . . . . . . . . . . . . . . . . . . . . . 14,825 1,059
6,047 434 22,365
Other specified Alaska Native tribes . . . 2,552 435 841 145
3,973
Alaska Native tribe, not specified2 . . . . . . 6,161 370 2,053 118
8,702
American Indian or Alaska Native
tribes, not specified
3
. . . . . . . . . . . . . . . . 511,960 (X) 544,497 (X) 1,056,457
X Not applicable.
1The numbers by American Indian and Alaska Native tribal
grouping do not add to the total population. This is because the
American
Indian and Alaska Native tribal groupings are tallies of the
number of American Indian and Alaska Native responses rather
than the number
of American Indian and Alaska Native respondents.
Respondents reporting several American Indian and Alaska
Native tribes are counted
several times. For example, a respondent reporting ‘‘Apache
and Blackfeet’’ would be included in the Apache as well as
Blackfeet numbers.
2Includes respondents who checked the ‘‘American Indian or
Alaska Native’’ response category on the census questionnaire
49. or wrote in
a tribe not specified in the American Indian and Alaska Native
Tribal Detailed Classification List for Census 2000.
3Includes respondents who checked the ‘‘American Indian or
Alaska Native’’ response category on the census questionnaire
or wrote in
the generic term ‘‘American Indian’’ or ‘‘Alaska Native,’ ’ or
tribal entries not elsewhere classified.
Source: U.S. Census Bureau, Census 2000, special tabulations.
U.S. Census Bureau 11
Race data from Census 2000
Summary File 1 were released on a
state-by-state basis during the sum-
mer of 2001, including data for
selected American and Alaska
Native tribal groupings.
The Census 2000 Summary File 1
data are available on the Internet
via factfinder.census.gov and for
purchase on CD-ROM and on DVD.
For information on confidentiality
protection, nonsampling error, and
definitions, also see
www.census.gov/prod/cen2000/doc/
sf1.pdf or contact our Customer
Services Center at 301-763-INFO
(4636).
50. For more information on specific
races in the United States, go to
www.census.gov and click on
“Minority Links.” This Web page
includes information about Census
2000 and provides links to reports
based on past censuses and surveys
focusing on the social and economic
characteristics of the Black or African
American, American Indian and
Alaska Native, Asian, and Native
Hawaiian and Other Pacific Islander
populations.
Information on other population
and housing topics is presented in
the Census 2000 Brief series, locat-
ed on the U.S. Census Bureau’s Web
site at
www.census.gov/population/www/
cen2000/briefs.html. This series
presents information on race,
Hispanic origin, age, sex, household
type, housing tenure, and other
social, economic, and housing char-
acteristics.
For more information about Census
2000, including data products, call
our Customer Services Center at
301-763-INFO (4636), or e-mail
[email protected]
Figure 6.
Largest Alaska Native Tribal Groupings: 2000
51. Source: U.S. Census Bureau, Census 2000 Summary File 1.
(For information on confidentiality protection, nonsampling
error, and definitions,
see www.census.gov/prod/cen2000/doc/sf1.pdf)
Aleut
Alaska Athabascan
Tlingit-Haida
Eskimo
Alaska Native tribal
grouping alone
Alaska Native tribal grouping alone
or in any combination
22,365
14,520
11,941
16,978
18,838
14,825
45,919
54,761
62. late 20th century policies contained some elements of
recognizing tribal self-rule, the government continued to design
paternalistic policies for native peoples even when they
conflicted with what the native peoples themselves wanted.
The diversity of the Native American people in terms of tribe,
urban versus rural, reservation v. non-reservation, and degree of
mixed ancestry may be without parallel to any other subordinate
group. Not unexpectedly, such a diverse people respond to their
unique position in a number of different and sometimes
contradictory ways. Resistance through collective action is
found in pan-Indianism in the form of social protests and
cultural protection.
The continued conflict between the dominant culture and Native
Americans into the 21st century is seen in land rights, tribal
hunting and fishing rights, environmental justice, economic
Lecture Notes
Removal Act, 1830
What was the goal of the Indian Removal Act of 1830?
The Indian Removal Act and the "Trail of Tears" ware examples
of forced migration of the Indians to the west.
This Act intended to relocate the Native Americans west of the
Mississippi River. And it allowed the annexation of traditional
Indian lands and the colonization by white settlers.
The Dawes Act know as General Allotment Act of 1887
The Allotment Act intended to impose upon the Native
Americans the European concept of private property ownership.
Reorganization Act 1934
The Indian Reorganization Act forced the tribal people to adopt
the European way of voting and the election of leaders.
The Allotment Act and the Indian Reorganization Act were
based on the idea of force assimilation of the American Indians.
Termination Act 1953-1975
Ended the reservation federal tax immunity, cut federal for
basic health care services and favored Native Americans self-
governance within the structure of the BIA (without
sovereignty)