Pune Office Property Market Overview Jan 2017
•
1 like•195 views

Demand-supply gap is likely to remain a concern in coming quarters. While a few grade A office buildings are likely to see completion towards the end of 2017, we expect upward pressure on rents at least in H1 2017. Tenants looking for quality assets should find their options limited this year given that most of the new supply is likely to enjoy high precommitment rates from existing occupiers.

Recommended
Recommended
More Related Content
What's hot
What's hot (20)
Viewers also liked
Viewers also liked (12)
Similar to Pune Office Property Market Overview Jan 2017
Similar to Pune Office Property Market Overview Jan 2017 (20)
More from Surabhi Arora, MRICS
More from Surabhi Arora, MRICS (17)
Recently uploaded
Recently uploaded (20)
Pune Office Property Market Overview Jan 2017
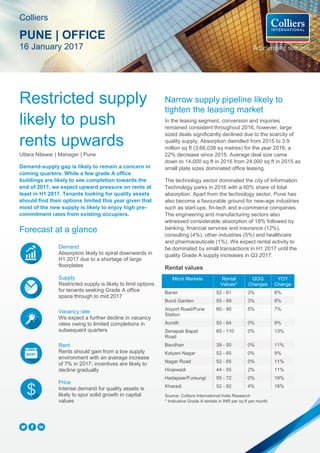
- 1. Restricted supply likely to push rents upwards Uttara Nilawar | Manager | Pune Demand-supply gap is likely to remain a concern in coming quarters. While a few grade A office buildings are likely to see completion towards the end of 2017, we expect upward pressure on rents at least in H1 2017. Tenants looking for quality assets should find their options limited this year given that most of the new supply is likely to enjoy high pre- commitment rates from existing occupiers. Forecast at a glance Demand Absorption likely to spiral downwards in H1 2017 due to a shortage of large floorplates Supply Restricted supply is likely to limit options for tenants seeking Grade A office space through to mid 2017 Vacancy rate We expect a further decline in vacancy rates owing to limited completions in subsequent quarters Rent Rents should gain from a low supply environment with an average increase of 7% in 2017; incentives are likely to decline gradually Price Intense demand for quality assets is likely to spur solid growth in capital values Narrow supply pipeline likely to tighten the leasing market In the leasing segment, conversion and inquiries remained consistent throughout 2016; however, large sized deals significantly declined due to the scarcity of quality supply. Absorption dwindled from 2015 to 3.9 million sq ft (3,66,038 sq metres) for the year 2016, a 22% decrease since 2015. Average deal size came down to 14,000 sq ft in 2016 from 24,000 sq ft in 2015 as small plate sizes dominated office leasing. The technology sector dominated the city of Information Technology parks in 2016 with a 60% share of total absorption. Apart from the technology sector, Pune has also become a favourable ground for new-age industries such as start-ups, fin-tech and e-commerce companies. The engineering and manufacturing sectors also witnessed considerable absorption of 18% followed by banking, financial services and insurance (12%), consulting (4%), other industries (5%) and healthcare and pharmaceuticals (1%). We expect rental activity to be dominated by small transactions in H1 2017 until the quality Grade A supply increases in Q3 2017. Rental values Micro Markets Rental Values* QOQ Changes YOY Change Baner 52 - 61 3% 8% Bund Garden 55 - 69 3% 8% Airport Road/Pune Station 60 - 90 5% 7% Aundh 50 - 64 0% 9% Senapati Bapat Road 65 - 110 0% 13% Bavdhan 39 - 50 0% 11% Kalyani Nagar 52 - 65 0% 9% Nagar Road 52 - 65 0% 11% Hinjewadi 44 - 55 2% 11% Hadapsar/Fursungi 55 - 72 0% 19% Kharadi 52 - 92 4% 18% Source: Colliers International India Research * Indicative Grade A rentals in INR per sq ft per month Colliers PUNE | OFFICE 16 January 2017
- 2. 2 Colliers | 16 January 2017 | PUNE | Office | Colliers International In 2016, office deals were primarily observed at the technology village, Hinjewadi (32%) along with some scattered absorption at other locations like Airport Road/Pune Station (16%), Kharadi (13%), CBD (13%), Hadapsar/Fursungi (9%), Baner (6%), Bavdhan (5%), Kalyani Nagar (3%), Nagar Road (2%) and Aundh (1%). Although no major private equity deals took place in the commercial market in 2016, we expect Pune to be one of the most favourable markets for Real Estate Investment Trusts (REITs). As REITs pick up in upcoming quarters thanks to reforms and incentives from the government, we think investments will pour into the Pune market. Gross Office Absorption in million sq ft Source: Colliers International India Research Pune micromarkets continue to experience low vacancy rates 2016 witnessed the vacancy levels drop to 10% from 17% in 2015. A few preferred micromarkets witnessed vacancy to the tune of 4-5%. Despite sustained demand, we could not see any significant completions in 2016. A few small projects together contributed about 951,500 sq ft (88,400 sq metres) of new supply. Most of the new supply in 2016 was concentrated in the Baner and Wakad micromarkets and comprised small buildings. Occupiers with large floor plate size requirement continued to struggle for Grade A office space. A few of them with immediate requirements also chose to be in Grade B developments. In 2017, we expect about 2.5 million sq ft (234,200 sq metres) of Grade A office space to be completed towards the end of the year. Most of this future supply is concentrated in Hinjewadi, Kharadi, Hadapsar/Fursungi and Airport Road/Pune station. Since we expect demand to follow supply, the locations mentioned above are likely to remain the most active markets in 2017. Sector-wise, IT-ITeS is likely to remain the primary demand driver along with the construction and automobile manufacturing sector. Lower vacancy pushed rents upward; the trend likely to continue in 2017 Rents followed an upward trend throughout 2016 as property owners capitalised on the supply crunch issue in the city. Most micromarkets experienced an average YOY increase of 11% while the YOY rental increases in Hadapsar/Fursungi and Kharadi were 19% and 18%, respectively. In our opinion, the increasing rents are a concern as this may lead to a trend whereby some companies choose competing cities for their expansion. Rental and Capital Values (INR) Source: Colliers International India Research Note. The above graph represents average Grade A rents per sq ft per month and average capital values on per sq ft basis Along with the rents, capital values also surged with a YOY average increase of 11% and around 14% in both Kalyani Nagar and Hadapsar/Fursungi. On the infrastructure front, some significant new advances took place in 2016; namely Pune's inclusion in the 'Smart Cities' initiative, the announcement of the new airport at Purandar, the approval of the Pune Metro and the commencement of the ring road construction. 0.00 1.00 2.00 3.00 4.00 5.00 6.00 2010 2011 2012 2013 2014 2015 2016 Q1 Q2 Q3 Q4 0 1000 2000 3000 4000 5000 6000 7000 8000 0 20 40 60 80 100 120 Q22008 Q22009 Q22010 Q22011 Q22012 Q22013 Q22014 Q22015 Q22016 Q22017F Q22018F Q22019F Rental Values Capital Values
- 3. 3 Colliers | 16 January 2017 | PUNE | Office | Colliers International Colliers View In 2016, Pune experienced a continued escalation in rental values with an average YOY increase of around 11% due to high demand and low vacancy rates. A further increase in these values could be detrimental to the growth of the city. However, we expect an influx of new supply in H2 2017 that should lead to increasing demand and stabilise rental values. In the meantime, occupiers can opt for pre-commitments or built-to-suit (BTS) developments for large office space requirements. They can also look at transitional areas such as co-working hubs to fulfil their immediate space requirements. The winds of demonetisation have not yet affected the Pune commercial market. Current leasing momentum ought to be maintained with the aid of small transactions, but the market is set to improve considerably in H2 2017 with some significant closures. MAJOR TRANSACTIONS IN 2016 CLIENT BUILDING NAME AREA (SQ FT) LOCATION LEASE/SALE Infosys Ascendas Phase II (ITPP) - Juniper 620,750 Hinjewadi Lease Siemens India Panchshil Business Park- Tower-C 342,079 Balewadi Lease ZS Associates World Trade Centre - C 240,000 Kharadi Lease Northern Trust Bank Tech Park One Tower-D 120,000 Yerwada Lease Amdocs Magarpatta Tower 3 88,000 Hadapsar Lease Source: Colliers International India Research KEY UNDER CONSTRUCTION PROJECTS BUILDING NAME DEVELOPER AREA (SQ FT) LOCATION POSSESSION DLF IT SEZ Block 5 DLF 600,000 Hinjewadi 2017 ICC Corporate Tower Panchshil 374,000 Senapati Bapat Road 2017 Marvel Edge - D Marvel Realtors 300,000 Viman Nagar 2017 Source: Colliers International India Research For more information: Surabhi Arora Senior Associate Director Research Tel: +91 124 456 7500 Surabhi.arora@colliers.com Rishav Vij Senior Associate Director Office Services Rishav.vij@colliers.com 5th Floor, Suyog Platinum Tower, Naylor Road, Off Mangaldas Road Pune - 4110011 India Notes: 1. Office Market: The major business locations in Pune include CBD Deccan Gymkhana, Bund Garden Road, Senapati Bapat Road and Camp). Off CBD (Aundh, Airport Road and Kalyani Nagar) and the eastern corridor, along with Nagar Road and Kharadi, which has emerged as preferred location for BFSI and IT- ITeS sector) 2. Rents/Capital Value: Market average of indicative asking price for Grade A office space. 3. Available Supply: Total Grade A office space being marketed for sale or lease in surveyed quarter. 4. All the figures in the report are based on market information as on 25th December 2016 Copyright © 2016 Colliers International. The information contained herein has been obtained from sources deemed reliable. While every reasonable effort has been made to ensure its accuracy, we cannot guarantee it. No responsibility is assumed for any inaccuracies. Readers are encouraged to consult their professional advisors prior to acting on any of the material contained in this report.