1. EDLD486/EDU421 – Skills Assessment #5 (25 POINTS TOTAL)
Brittany Birdsbill
790599589
Skills Assessment 5
Ho: There is no statistically significant difference in Mg in the pottery form different sites. The alpha level for
this is 0.5, with the dependent variable being Mg, independent variable being the four different sites.
Ha: These is a statistically difference in Mg in the pottery from the different sites. The alpha level is 0.5, with
the dependent variable being Mg. independent variable being the site where it was found.
Alpha level:0.5
IV: the site where the pottery was cultivated.
DV: the nitrate we car comparing, Mg
Methods: We had to select what type of test we are doing. We started by eliminating the t test, and using the
ANOVA. We wanted to use ANOVA because its comparing the means of two variables. Then we did
descriptive statistics on out dependent variable, then created a frequency count histogram.
Results& Conclusion: The derived F = 34.45 exceeds the tabled critical value of F =3.049 at p = .05 with df1 =
3 and df2 = 22. Therefore, H0 is rejected, and it is concluded that at least one mean is significantly different from
one other mean.
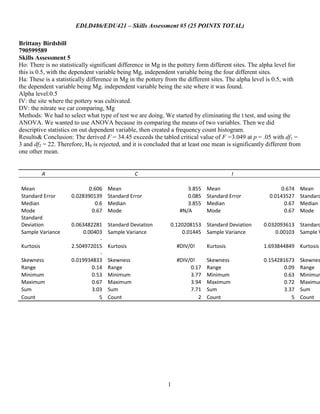
A
Mean
Standard Error
Median
Mode
Standard
Deviation
Sample Variance
Kurtosis
Skewness
Range
Minimum
Maximum
Sum
Count
C
0.606
0.028390139
0.6
0.67
Mean
Standard Error
Median
Mode
0.063482281
0.00403
2.504972015
0.019934833
0.14
0.53
0.67
3.03
5
Standard Deviation
Sample Variance
I
3.855
0.085
3.855
#N/A
Mean
Standard Error
Median
Mode
0.120208153 Standard Deviation
0.01445 Sample Variance
0.674
0.0143527
0.67
0.67
Mean
Standard
Median
Mode
0.032093613 Standard
0.00103 Sample V
Kurtosis
#DIV/0!
Kurtosis
1.693844849 Kurtosis
Skewness
Range
Minimum
Maximum
Sum
Count
#DIV/0!
0.17
3.77
3.94
7.71
2
Skewness
Range
Minimum
Maximum
Sum
Count
0.154281673
0.09
0.63
0.72
3.37
5
1
Skewnes
Range
Minimum
Maximum
Sum
Count
2. EDLD486/EDU421 – Skills Assessment #5 (25 POINTS TOTAL)
Frequency
Histogram
15
10
5
0
Frequency
Level of Mg
Anova: Single
Factor
SUMMARY
Groups
A
C
I
L
ANOVA
Source of Variation
Count
5
2
5
14
SS
Sum
Average
Variance
3.03
0.606
0.00403
7.71
3.855
0.01445
3.37
0.674
0.00103
67.57 4.826428571 1.184224725
df
MS
F
Between Groups
Within Groups
103.350527
15.42961143
P-value
F crit
6.45221E3 34.45017568 49.12008759
10 3.049124989
22 0.701345974
Total
118.7801385
25
2