AGU Fall 2011 Poster presentation
•
1 like•945 views

The effect of long-term drainage on vegetation structure and productivity in boreal peatlands
Recommended

Recommended
More Related Content
Featured
Featured (20)
AGU Fall 2011 Poster presentation
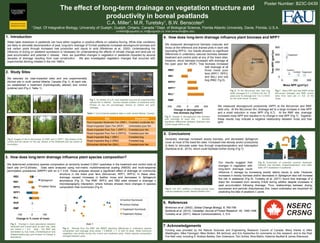
- 1. Poster Number: B23C-0439 The effect of long-term drainage on vegetation structure and productivity in boreal peatlands C.A. Miller1, M.R. Turetsky 1, B.W. Benscoter2 1 Dept. Of Integrative Biology, University of Guelph, Guelph, Ontario, Canada 2 Dept. of Biological Science, Florida Atlantic University, Davie, Florida, U.S.A. (cmille04@uoguelph.ca, mrt@uoguelph.ca, brian.benscoter@fau.edu) 1. Introduction 4. How does long-term drainage influence plant biomass and NPP? Water table drawdown in peatlands can have either negative or positive effects on radiative forcing. While drier conditions are likely to stimulate decomposition of peat, long-term drainage of Finnish peatlands increased aboveground biomass and We measured aboveground biomass (vascular and soil carbon pools through increased tree production and inputs to soils (Minkkinen et al., 2002). Understanding the moss) at the reference and drained plots in each site 800 (excluding RPF2). Our results showed no significant Tree NPP (g/m2/yr) influence of drying on peatland succession is necessary for understanding the effects of climate change and land-use on peat accumulation and potential C release. Here, we quantified changes in vegetation in peatlands impacted by several differences in understory vascular biomass between 600 Treatment decades of drainage resulting from road construction. We also investigated vegetation changes that occurred with treatment and control plots at any of the treed sites. Drainage experimental ditching initiated in the mid 1980’s. However, shrub biomass increased with drainage at (1986) 400 the open poor fen (ROF). Tree biomass increased with drainage at all RB2* three treed poor 200 Control 2. Study Sites Control Treatment A 1965 B 1983 RB1 fens (RPF1, RPF2, and McL) and one 0 We selected six road-impacted sites and one experimentally bog (RB2; Fig 5). 0 250 500 ditched site in north central Alberta, Canada (Fig 1). At each site, RPF2* we established a treatment (hydrologically altered) and control Moss NPP (g/m2/yr) 2001 1999 (pristine) plot (Fig 2; Table 1). RPF1* Fig 6. At the McLennan site, tree ring Fig 7. Moss NPP and tree ANPP at the McL* width averaged 0.4 ± 0.02mm for the 10 McLennan (triangle) and RMF (circle) years prior to drainage and 1.6 ± 0.10mm sites Error bars are ±1 S.E. of the for the most recent 10 years. mean. Fig 1. Air photos of a A) road-impacted bog and B) experimentally RMF A ditched fen in Alberta. Arrows indicate location of treatment area. Photos on top are pre-drainage; photos on bottom are post- -400 -200 0 200 400 We measured aboveground productivity (NPP) at the McLennan and RMF drainage. Change in aboveground sites only. At the McLennan fen, drainage led to a large increase in tree NPP A B C Table 1. List of drained peatland sites in north central Alberta, Canada. tree biomass (kg/100m2) and a small reduction in moss NPP (Fig 6,7). At the RMF site, drainage Fig 5. Change in aboveground tree biomass increased moss NPP and resulted in no change in tree NPP (Fig 7). Together, Site Description B Rod-impacted Moderate Fen (RMF) Forested moderate fen with drainage at each site * denotes significant differences between treatment and these results may indicate a negative relationship between moss and tree NPP. control areas within a site. Road-impacted Open Fen (ROF) Unforested poor fen Road-impacted Poor Fen 1 (RPF1) Forested poor fen Road-impacted Poor Fen 2 (RPF2) Forested poor fen 5. Conclusions Road-impacted Bog 1 (RB1) Forested bog Fig 2. Images of the A) McLennan, B) RMF and C) RPF1. Site photos of the Generally, drainage increased woody biomass, and decreased Sphagnum control plot are shown on the top; photos of the treatment plot are shown at Road-impacted Bog 2 (RB2) Forested bog cover at most of the treed fen sites. Increased tree density and/or productivity the bottom. McLennan ditched fen (McL) Forested poor fen is likely to stimulate water loss through evapotranspiration and interception ET ET (Sarkkola et al., 2010), which could facilitate further drying (Fig 7). WT 3. How does long-term drainage influence plant species composition? WT Our results suggest that Fig 8._Schematic of potential positive feedback We determined understory species composition at randomly located 0.25m2 quadrates in the treatment and control plots at changes in vegetation with between tree biomass, evapotranspiration, and water each site (n=12-20/site). Data were analyzed using non-metric multidimensional scaling (NMDS) and multi-response long-term drainage could table (WT) drawdown in peatlands. permutation procedures (MRPP) with an α = 0.05. These analyses showed a significant effect of drainage on community . influence C storage by increasing woody debris inputs to soils. However, structure in the treed poor fens (McLennan, RPF1, RPF2). In these sites, RB2 increases in woody biomass and/or decreases in Sphagnum also will increase drainage caused increases in feather moss and decreases in Sphagnum fire risk in peatlands (Fig 8). Turetsky et al. (2011) found that drainage of a Sphagnum abundance (Fig 3). The RMF, RPF2, and RB2 sites showed a drainage x RB1 treed fen increased burn severity 9-fold during wildfire despite increases in microtopography interaction, where hollows showed more changes in species Feather Moss composition than hummocks (Fig 4). peat accumulation following drainage. Thus, relationships between drying, RPF2 Fig 9. The 2011 wildfires in Alberta burned many succession and periodic disturbances (fire, insect outbreaks) are important for drained peatlands (credit: Alberta Wildfire Info.) predicting the fate of peatland C pools. RPF1 McL Control Hummock ROF 6. References Control Hollow Axis 2 RMF Minkkinen et al. (2002). Global Change Biology, 8, 785-799. Treatment Hummock Sarkkola et al. (2010). Canadian Journal of Forest Research, 40, 1485-1496. -100 0 100 Treatment Hollow Turetsky et al. (2011). Nature Communications, 2, 514. Change in % cover of moss Fig 3. Change in moss abundance between Axis 1 treatment and control plots at each site. Data 7. Acknowledgements are means ± 1 S.E. Note – the RMF was Fig 4. Results from the RMF site NMDS depicting differences in understory species composition with drainage (final stress = 5.66838, n = 12 with 23 taxa). While hummock Funding was provided by the Natural Sciences and Engineering Research Council of Canada. Many thanks to Mike dominated by true moss (Tomenthypnum and Drepanocladus spp) and showed no change in vegetation was similar across the control and treatment plots, hollow species composition Waddington, Mike Flannigan, Mike Wotton, Bill deGroot, and Eric Kasischke for comments on this research, and to the Peat abundance. diverged between plots. Fire field crew, including S. Andrew Baisley, Dan Greenacre, Tom Schiks, Abra Martin, Katarina Neufeld & James Sherwood.