Civil Beat Poll September 2012 voice crosstabs
•Download as DOC, PDF•
1 like•298 views


Recommended
Recommended
More Related Content
More from Honolulu Civil Beat
More from Honolulu Civil Beat (20)
Civil Beat Poll September 2012 voice crosstabs
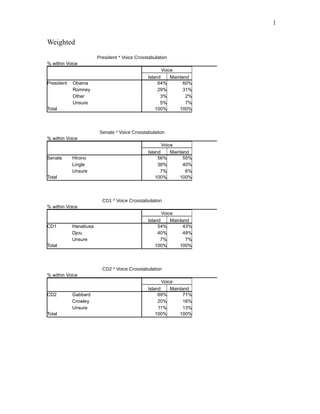
- 1. 1 Weighted President * Voice Crosstabulation % within Voice Voice Island Mainland President Obama 64% 60% Romney 29% 31% Other 3% 2% Unsure 5% 7% Total 100% 100% Senate * Voice Crosstabulation % within Voice Voice Island Mainland Senate Hirono 56% 55% Lingle 38% 40% Unsure 7% 6% Total 100% 100% CD1 * Voice Crosstabulation % within Voice Voice Island Mainland CD1 Hanabusa 54% 43% Djou 40% 49% Unsure 7% 7% Total 100% 100% CD2 * Voice Crosstabulation % within Voice Voice Island Mainland CD2 Gabbard 69% 71% Crowley 20% 16% Unsure 11% 13% Total 100% 100%
- 2. 1 Mayor * Voice Crosstabulation % within Voice Voice Island Mainland Mayor Cayetano 50% 52% Caldwell 45% 38% Unsure 5% 10% Total 100% 100% Vote_Primary * Voice Crosstabulation % within Voice Voice Island Mainland Vote_Primary Yes 88% 86% No 11% 13% Unsure 1% 1% Total 100% 100% Economy_Condensed * Voice Crosstabulation % within Voice Voice Island Mainland Economy_Condensed Positive 59% 55% Negative 37% 43% Unsure 3% 2% Total 100% 100%
- 3. 1 Spending_Cuts * Voice Crosstabulation % within Voice Voice Island Mainland Spending_Cuts Tough cuts 25% 31% Easy cuts 58% 55% No cuts 5% 5% Unsure 13% 9% Total 100% 100% Tax_Increases * Voice Crosstabulation % within Voice Voice Island Mainland Tax_Increases Tough taxes 17% 19% Easy taxes 57% 56% No taxes 21% 20% Unsure 5% 4% Total 100% 100% Kids_in_School * Voice Crosstabulation % within Voice Voice Island Mainland Kids_in_School Yes 33% 31% No 66% 67% Unsure 1% 2% Total 100% 100% Educ_Quality * Voice Crosstabulation % within Voice Voice Island Mainland Educ_Quality Excellent 4% 6% Good 34% 35% Fair 46% 41% Poor 13% 16% Unsure 3% 2% Total 100% 100%
- 4. 1 Furloughs * Voice Crosstabulation % within Voice Voice Island Mainland Furloughs Major Negative 41% 39% Minor Negative 34% 30% Not Negative 15% 16% Unsure 11% 15% Total 100% 100% Teacher_Contract * Voice Crosstabulation % within Voice Voice Island Mainland Teacher_Contract Major Negative 26% 32% Minor Negative 32% 35% Not Negative 13% 12% Unsure 28% 21% Total 100% 100% Rail * Voice Crosstabulation % within Voice Voice Island Mainland Rail Support 40% 35% Oppose 50% 56% Unsure 10% 9% Total 100% 100% Rail_Decide * Voice Crosstabulation % within Voice Voice Island Mainland Rail_Decide Few months 10% 8% Past year 19% 19% More than a year 71% 71% Unsure 1% 1% Total 100% 100%
- 5. 1 Supporters * Voice Crosstabulation % within Voice Voice Island Mainland Supporters Very upset 70% 56% Somewhat upset 22% 34% Not upset 8% 7% Unsure 3% Total 100% 100% Opponents_Upset * Voice Crosstabulation % within Voice Voice Island Mainland Opponents_Upset Very upset 73% 69% Somewhat upset 18% 20% Not upset 8% 7% Unsure 2% 4% Total 100% 100% Concerns * Voice Crosstabulation % within Voice Voice Island Mainland Concerns Traffic 39% 30% Cost 33% 42% Landscape 10% 8% Use 12% 13% Burials 0% 0% Unsure 6% 6% Total 100% 100% Ruling * Voice Crosstabulation % within Voice Voice Island Mainland Ruling Yes 4% 7% No 85% 82% Unsure 11% 11% Total 100% 100%
- 6. 1
- 7. 1 Gender * Voice Crosstabulation % within Voice Voice Island Mainland Gender Male 44% 44% Female 56% 56% Total 100% 100% Age * Voice Crosstabulation % within Voice Voice Island Mainland Age 18-29 4% 7% 30-39 6% 7% 40-49 9% 11% 50-64 34% 35% 65+ 46% 40% Total 100% 100% Race_Ethnicity * Voice Crosstabulation % within Voice Voice Island Mainland Race_Ethnicity Caucasian 36% 44% Japanese 42% 28% Filipino 6% 8% Hawaiian 3% 4% Chinese 9% 11% Hispanic/Latino 1% 1% Other/Mixed 4% 3% Total 100% 100% Politics * Voice Crosstabulation % within Voice Voice Island Mainland Politics Liberal/Progressive 29% 24% Moderate 34% 41% Conservative 22% 22% Unsure 15% 13% Total 100% 100%
- 8. 1 Party_ID * Voice Crosstabulation % within Voice Voice Island Mainland Party_ID Democrat 56% 53% Republican 17% 18% Independent 23% 27% Unsure 5% 3% Total 100% 100% % within Voice Voice Island Mainland Education No degree 3% 2% High School Degree 30% 26% College Degree 44% 42% Graduate Degree 24% 30% Total 100% 100% Military_Family * Voice Crosstabulation % within Voice Voice Island Mainland Military_Family Yes 9% 14% No 91% 86% Total 100% 100% Income * Voice Crosstabulation % within Voice Voice Island Mainland Income Less than $50,000 35% 39% $50,000-$100,000 41% 37% $100,000 or more 24% 25% Total 100% 100%
- 9. 1 Unweighted President * Voice Crosstabulation % within Voice Voice Island Mainland President Obama 61% 59% Romney 31% 32% Other 3% 2% Unsure 5% 6% Total 100% 100% Senate * Voice Crosstabulation % within Voice Voice Island Mainland Senate Hirono 55% 51% Lingle 39% 42% Unsure 7% 7% Total 100% 100% CD1 * Voice Crosstabulation % within Voice Voice Island Mainland CD1 Hanabusa 50% 43% Djou 43% 50% Unsure 7% 8% Total 100% 100% CD2 * Voice Crosstabulation % within Voice Voice Island Mainland CD2 Gabbard 69% 70% Crowley 19% 18% Unsure 12% 12% Total 100% 100%
- 10. 1 Mayor * Voice Crosstabulation % within Voice Voice Island Mainland Mayor Cayetano 52% 54% Caldwell 41% 37% Unsure 7% 8% Total 100% 100% Vote_Primary * Voice Crosstabulation % within Voice Voice Island Mainland Vote_Primary Yes 88% 86% No 10% 13% Unsure 2% 2% Total 100% 100% Economy_Condensed * Voice Crosstabulation % within Voice Voice Island Mainland Economy_Condensed Positive 58% 54% Negative 38% 43% Unsure 4% 2% Total 100% 100%
- 11. 1 Spending_Cuts * Voice Crosstabulation % within Voice Voice Island Mainland Spending_Cuts Tough cuts 23% 29% Easy cuts 57% 53% No cuts 6% 6% Unsure 14% 12% Total 100% 100% Tax_Increases * Voice Crosstabulation % within Voice Voice Island Mainland Tax_Increases Tough taxes 17% 18% Easy taxes 56% 56% No taxes 21% 22% Unsure 6% 4% Total 100% 100% Solution * Voice Crosstabulation % within Voice Voice Island Mainland Solution Cut spending 33% 37% Increase taxes 9% 6% Both 46% 47% Unsure 13% 10% Total 100% 100%
- 12. 1 Kids_in_School * Voice Crosstabulation % within Voice Voice Island Mainland Kids_in_School Yes 33% 31% No 65% 67% Unsure 1% 2% Total 100% 100% Educ_Quality * Voice Crosstabulation % within Voice Voice Island Mainland Educ_Quality Excellent 5% 5% Good 34% 32% Fair 44% 43% Poor 14% 17% Unsure 3% 3% Total 100% 100% Furloughs * Voice Crosstabulation % within Voice Voice Island Mainland Furloughs Major Negative 41% 39% Minor Negative 34% 30% Not Negative 13% 17% Unsure 13% 15% Total 100% 100% Teacher_Contract * Voice Crosstabulation % within Voice Voice Island Mainland Teacher_Contract Major Negative 28% 31% Minor Negative 33% 34% Not Negative 12% 15% Unsure 27% 21% Total 100% 100%
- 13. 1 Rail * Voice Crosstabulation % within Voice Voice Island Mainland Rail Support 37% 30% Oppose 54% 62% Unsure 9% 8% Total 100% 100% Rail_Decide * Voice Crosstabulation % within Voice Voice Island Mainland Rail_Decide Few months 9% 8% Past year 17% 18% More than a year 73% 72% Unsure 1% 2% Total 100% 100% Supporters * Voice Crosstabulation % within Voice Voice Island Mainland Supporters Very upset 69% 56% Somewhat upset 21% 34% Not upset 9% 9% Unsure 2% Total 100% 100% Opponents_Upset * Voice Crosstabulation % within Voice Voice Island Mainland Opponents_Upset Very upset 71% 67% Somewhat upset 18% 19% Not upset 8% 7% Unsure 2% 7% Total 100% 100%
- 14. 1 Concerns * Voice Crosstabulation % within Voice Voice Island Mainland Concerns Traffic 36% 31% Cost 35% 40% Landscape 8% 10% Use 13% 11% Burials 1% 0% Unsure 7% 8% Total 100% 100% Ruling * Voice Crosstabulation % within Voice Voice Island Mainland Ruling Yes 6% 6% No 83% 83% Unsure 11% 10% Total 100% 100%
- 15. 1 Gender * Voice Crosstabulation % within Voice Voice Island Mainland Gender Male 43% 42% Female 57% 58% Total 100% 100% Age * Voice Crosstabulation % within Voice Voice Island Mainland Age 18-29 1% 2% 30-39 2% 3% 40-49 6% 7% 50-64 34% 35% 65+ 57% 53% Total 100% 100% Race_Ethnicity * Voice Crosstabulation % within Voice Voice Island Mainland Race_Ethnicity Caucasian 45% 51% Japanese 21% 13% Filipino 7% 8% Hawaiian 10% 12% Chinese 5% 6% Hispanic/Latino 1% 1% Other/Mixed 12% 9% Total 100% 100% Politics * Voice Crosstabulation % within Voice Voice Island Mainland Politics Liberal/Progressive 27% 24% Moderate 34% 38% Conservative 25% 26% Unsure 14% 12% Total 100% 100%
- 16. 1 Party_ID * Voice Crosstabulation % within Voice Voice Island Mainland Party_ID Democrat 53% 49% Republican 19% 20% Independent 25% 29% Unsure 3% 2% Total 100% 100% Education * Voice Crosstabulation % within Voice Voice Island Mainland Education No degree 3% 2% High School Degree 31% 28% College Degree 41% 41% Graduate Degree 25% 29% Total 100% 100% Military_Family * Voice Crosstabulation % within Voice Voice Island Mainland Military_Family Yes 11% 14% No 89% 86% Total 100% 100% Income * Voice Crosstabulation % within Voice Voice Island Mainland Income Less than $50,000 39% 38% $50,000-$100,000 40% 38% $100,000 or more 21% 24% Total 100% 100%