SlideShare a Scribd company logo
1 of 171
Chapter Eighteen
Management: Making It Work
Chapter Outline
Managing Labor Costs and Revenues
Managing Labor Costs
Number of Employees (a.k.a.: Staffing Levels or Headcount)
Hours
Benefits
Average Cash Compensation (Fixed and Variable Components)
Budget Controls: Top Down
Budget Controls: Bottom Up
Embedded (Design) Controls
Managing Revenues
Using Compensation to Retain (and Recruit) Top Employees
Managing Pay to Support Strategy and Change
Communication: Managing the Message
Say What? (Or, What to Say?)
Opening the Books
Structuring the Compensation Function and Its Roles
Centralization–Decentralization (and/or Outsourcing)
Ethics: Managing or Manipulating?
Your Turn: Communication by Copier
Still Your Turn: Managing Compensation Costs, Headcount, and
Participation/Communication Issues
This chapter is about making it work: ensuring that the right
people get the right pay for achieving the right objectives in the
right way. The greatest pay system design in the world is
useless without competent management. So why bother with a
formal system at all? If management is that important, why not
simply let every manager pay whatever works best? Such total
decentralization of decision making could create a chaotic array
of rates. Managers could use pay to motivate behaviors that
achieved their own immediate objectives, not necessarily those
of the organization. Employees could be treated inconsistently
and unfairly.
This was the situation in the United States in the early 1900s.
The “contract system” made highly skilled workers managers as
well as workers. The employer agreed to provide the
“contractor” with floor space, light, power, and the necessary
666
raw or semifinished materials. The contractor hired and paid
labor.1 Pay inconsistencies for the same work were common.
Some contractors demanded kickbacks from employees’
paychecks; many hired their relatives and friends.
Dissatisfaction and grievances were widespread, eventually
resulting in legislation that outlawed the arrangement.
Corruption and financial malfeasance were also part of
decentralized decision making in the early 1900s. Some see
parallels today. To help avoid history repeating itself and to
redeem HR (and compensation) vice presidents from the image
of unindicted coconspirators, the compensation system should
be managed to achieve the objectives in the pay model:
efficiency, fairness, and compliance.
Any discussion of managing pay must again raise the basic
questions: So what is the impact of the decision or technique?
Does it help the organization achieve its objectives? How?
Although many pay management issues have been discussed
throughout the book, a few remain to be called out explicitly.
These include (1) managing labor costs, (2) managing revenues,
(3) communication, and (4) designing the compensation
department.
MANAGING LABOR COSTS AND REVENUES
Financial planning is integral to managing compensation. As we
noted in Chapter 1, compensation decisions influence
organization’s performance by influencing costs and/or
revenues. The cost implications of actions such as updating the
pay structure, increasing merit pay, or instituting gain sharing
are critical for making sound decisions. Budgets account for
these costs. Creating a compensation budget requires tradeoffs,
such as how much of an increase should be allocated according
to employee contributions versus across-the-board increases
versus company performance. Tradeoffs also occur over short-
versus long-term incentives, over pay increases contingent on
performance versus seniority, and over cash compensation
compared to benefits.
Financial planning also requires understanding the revenues (or
returns) gained from the allocation.2 Total compensation makes
up at least 50 percent of operating expenses in many
organizations. Yet, most companies have not tried to analyze
the returns from their compensation decisions.3 As we noted
in Chapter 2, compensation strategy influences effectiveness not
only by its influence on (labor) costs, but through its influence
in helping increase revenues or returns as well. Returns might
be the productivity increases expected from a new gain-sharing
or profit-sharing plan, or the expected value added by boosting
merit increases to the top performers.4 In the past, financial
planning in compensation was only about costs.5 This is
perhaps because costs are tangible and easy to measure, whereas
the returns generated by compensation strategy may often be
intangible and harder to quantify. It is important to keep in
mind, however, that how easy or difficult it is to quantify
something has little to do with how important it is. Fortunately,
analysis of the expected returns compared to costs is becoming
more common.6 More on this later.
667
EXHIBIT 18.1 Managing Labor Costs
MANAGING LABOR COSTS
You already know many of the factors that affect labor
costs. Exhibit 18.1 shows a simple labor cost model. Using this
model, there are three main factors to control in order to
manage labor costs: employment (e.g., number of workers and
the hours they work), average cash compensation (e.g., wages,
bonuses), and average benefit costs. Cash compensation and
benefits have been this book’s focus. However, if our objective
is to better manage labor costs, then all three factors require
attention.
Number of Employees (a.k.a.: Staffing Levels or Headcount)
Using information about competitors’ average pay helps
improve understanding of labor costs. Exhibit 18.2A shows how
one organization pays its engineers relative to its competitors at
each of five job levels, E5–E1. The pay for each position is the
cross-hatched bar. Market pay is the shaded bar, with the
average falling in the middle of the unshaded part of the bar. So
the organization meets competition by paying E5, E3, and E2
engineers at about the median. But the company leads
competition at E4 and lags at the entry-level E1.
Exhibit 18.2B provides more insight into the organization’s
labor costs. This part of the exhibit compares the organization’s
distribution of engineers among the five job levels to its
competitors’ distributions. A larger percentage of the
organization’s engineers are at higher levels, E4 and E5, than
its competitors. So even though the organization pays above
market for only one of the five job levels, its labor costs may be
higher than its competitors due to its staffing pattern. So what?
Looking only at total headcount, as suggested in Exhibit 18.1,
may mislead since the total employment level
668
EXHIBIT 18.2 Staffing Analysis Identifies Reasons for Pay
Variances
could be identical to competitors’ but deployment among job
levels may vary. Here, the organization differs from its
competitors most at E4, where it employs a larger percent of
engineering talent and also pays them more. Something is going
on at E4. More information is required to better understand
what underlies these differences. Are the organization’s
engineers more experienced and thus promoted into E4? Does
the company do more sophisticated work that requires more
experienced engineers? Absent some sound business-related
rationale, labor costs can be reduced by redeploying staffing
levels and wages at E4.7 Obviously, paying the same wages
(e.g., meeting competition) to fewer employees is less
expensive. The effects on all pay objectives—efficiency and
fairness—also need to be considered before taking any action.
669Reducing Headcount
As is apparent from following the business news during any
recession, organizations often reduce headcount to cut labor
costs. Such cuts may take the form of layoffs (often with
severance benefits that depend on length of service) or exit
incentives that are designed to encourage employees to leave
“by choice.” A major advantage of a reduction in force (RIF) is
that it also reduces benefits costs, something that a pay cut,
furlough, or reduction in hours ordinarily does not achieve. (An
exception would be Lincoln Electric, which has a very lean,
low-cost benefits package.) To the degree that headcount
reductions can be targeted based on performance, it can also be
an opportunity for an organization to reshape its workforce in a
way that creates positive sorting effects. Under such a scenario,
stronger performers are unaffected (e.g., their pay is not cut)
and the organization has an opportunity to maintain good
employee relations with this important group.
There are, however, several potential problems with headcount
reductions. First, regulatory requirements make it difficult to
make targeted cuts. The Age Discrimination in Employment Act
(ADEA) often comes into play if organizations target reductions
among higher paid employees (to maximize labor cost savings)
because higher paid employees also tend to be older employees.
In addition, the Older Worker Benefits Protection Act, part of
the ADEA, requires that exit incentive programs be structured
in very specific ways. For example, a program must give
workers 40 years old and older 21 days to consider the offer and
7 days to change their mind if they accept the offer. These and
other provisions tend to make it difficult to single out high-
wage and/or poor-performing workers. If exit incentives cannot
be effectively targeted and all employees are eligible, which
employees do you think would be most likely to take the
incentive and leave? Probably those most employable and most
able to find another good job, right? That is indeed what a
number of organizations have experienced. Thus, you may end
up, in essence, paying your top performers to leave—a very
undesirable sorting effect! Second, workforce reductions,
especially if not handled well, can harm employee relations.
Regulatory restrictions on headcount reductions can be quite
stringent outside the United States. (See our discussion of
works councils, for example, in Chapter 16.)8 Third,
organizations that make greater (involuntary) workforce
reductions also experience greater voluntary turnover.9 Fourth,
RIFs, while reducing costs over time, are very costly in tangible
terms up front due to increases in unemployment insurance tax
rates, disruption of work processes and serving customers, and
administrative costs of handling exits. Exit incentives, if
provided, further drive up costs. Fifth, some companies have
learned to run so “lean” (i.e., very few employees on
manufacturing lines), and have controlled hiring so
successfully, that there may be little room to cut
headcount.10 Finally, where cuts can be made, if the cuts are
too deep, an organization will be poorly positioned to generate
revenue if business picks up again.11 An organization may
spend a lot of money reducing headcount and then spend a lot
more a short time later to hire new employees to handle
increased product demand. If other firms increase hiring at the
same time, costs will be even greater. Announcements of layoffs
and plant closings often have favorable short-run effects on
stock prices as investors anticipate improved cash flow and
lower costs. However, in the
670
EXHIBIT 18.3 Core and Contingent Employees
longer term, adverse effects such as loss of trained employees,
unrealized productivity, and lowered morale often translate into
lower financial gains than anticipated. Some evidence indicates
that close attention to process and employee relations during
workforce reductions can help financial results.12
In addition, as we saw in Chapter 17, the regulatory
environment differs from country to country. Many European
countries have legislation as part of their social contracts that
makes it very difficult to reduce headcount or wages. Managing
labor costs is a greater struggle in such circumstances.
Many employers seek to buffer themselves from getting into a
position where layoffs are necessary. As discussed below, use
of overtime is part of this strategy. In addition, organizations
establish different relationships with different groups of
workers. As Exhibit 18.3 depicts, the two groups are commonly
referred to as core employees, with whom a long-term
relationship is desired, and contingent workers, whose
employment agreements may cover only short, specific time
periods. Contingent workers can be employees, but can also be
independent contractors/vendors or may be employed by
staffing services firms/vendors. Rather than expand or contract
the core workforce, many employers achieve flexibility and
control labor costs by expanding or contracting the contingent
workforce. Toyota, for example, while not cutting regular
employees in either the United States or Japan during the recent
recession, has cut its contract worker headcount.
The segmented supply of nurses at St. Luke’s Hospital,
discussed in Chapter 7 and shown in Exhibit 18.4, illustrates the
variable costs from use of different sources of
EXHIBIT 18.4 Segmented Supplies: St. Luke’s Labor Cost
Model
Source: © George T. Milkovich.
nurses. Regular, pool, registry, and traveler nurses are paid
differently. Some have benefits from St. Luke’s, others have
them from the contracting agencies, and still others must
purchase their own benefits (pool nurses). The tradeoffs in
managing costs include balancing patient loads, nurse-to-patient
ratios, costs of alternative sources, and quality of care.13Hours
Rather than define employment as number of employees, hours
of work is often used. For nonexempt employees in the United
States, hours over 40 per week are more expensive (one-and-a-
half times regular wage). Hence, another way to manage labor
costs is to examine overtime hours versus hiring more
employees. St. Luke’s may guarantee its regular nurses a
specific number of hours, but contract nurses (pool, registry, or
travelers) are “on call.”
The four factors in the labor cost model—number of employees,
hours worked, cash compensation, and benefit costs—are not
independent. Overtime hours require higher wages but the
incremental benefits cost is substantially lower than that
incurred in hiring an additional regular nurse. The higher the
fixed benefits costs, the more viable is the option to add
overtime (even with the time and a half premium) rather than
hiring another nurse. By not hiring, the organization avoids
recruitment/selection costs. It also gains more flexibility to
reduce labor costs if demand for its health care services
declines in the future. In that case, rather than cutting
headcount, it can reduce hours worked, which helps avoid
employee relations problems as well as the monetary costs of
reducing headcount.
During the most recent recession, a number of firms reduced
hours and costs through the use of mandatory unpaid leave or
furloughs to cut hours and thus labor costs. For example, state
employees in California were required to take two furlough days
off per month, resulting in a 10 percent pay cut. Wendy
Roberson, one such employee, partly as a joke, founded the
“Fun Furlough Fridays Club.” Nobody wants a pay cut, but if
you are going to get some extra time off, you might as well
make the best of it and enjoy it, right? Well, as it turns out,
although the pay cut was real, the time off in many cases was
not. The amount of work to be done did not decrease, so many
“furloughed” employees found themselves at work, rather than
having Fun Furlough Fridays.14 Nevertheless, reducing hours
and pay does mean that fewer headcount
672
reductions are necessary and by avoiding these, there will be
less disruption and private sector organizations should be better
positioned to respond when business picks up again, at least so
long as top performers don’t find greener pastures in the
meantime.15Benefits
One of the most common approaches to reducing benefits costs
recently has been for employers to suspend matching (made
when employees contribute) to 401(k) retirement plans. Survey
data show about one in four companies either have already
suspended their matching contributions or are considering doing
so. Even the American Association for Retired Persons (AARP)
decided it needed to suspend its 401(k) retirement plan match, a
decision that was presumably not taken lightly!16 The average
company match is 50 cents on the dollar up to 6 percent of pay.
More companies may move to a model that makes matching
contributions dependent on profits.17 Another action we have
seen is organizations eliminating benefits such as defined
benefit (pension) plans as part of seeking bankruptcy protection
from creditors. Examples include several airlines (e.g., United,
Delta, USAir, Northwest), automobile companies (General
Motors, Chrysler), and automobile parts companies (e.g.,
Delphi). As noted in Chapter 13, the Pension Benefit Guaranty
Corporation (PBGC) provides benefits to employees who were
covered under such plans. However, the maximum monthly
retirement benefit from the PBGC is $5,011 at age 65, meaning
that more highly paid employees (e.g., airline pilots) can
experience a significant loss in pension benefits after
bankruptcy. Other, more typical, ways of controlling or
reducing benefits costs have to do with efforts by companies in
the area of health care (as discussed in Chapters 12 and
13).Average Cash Compensation (Fixed and Variable
Components)
Average cash compensation includes average salary (fixed
payments) level plus variable compensation payments such as
bonuses, gain sharing, stock plans, and/or profit sharing. The
fixed component is typically paid regardless of business
performance. In contrast, the variable component of
compensation, in theory, will rise and fall in line with business
performance. For example, a profit-sharing plan will ordinarily
have lower than normal profit-sharing payouts in years when
profits are lower than normal. If other firms are experiencing
similar profit declines, then there may be less danger of losing
employees through turnover when this happens and the full
advantage of “automatic” labor cost flexibility can be
experienced.
During the most recent recession (in 2009) almost one-half of
firms froze salaries, giving no annual increase,18 resulting in an
average salary increase budget across companies of just 1.9
percent. As Exhibit 18.5 indicates, salary increase budgets have
increased since 2009. In addition, only 5 percent of firms froze
salary increase budgets in 2011 (and in subsequent years), down
from 21 percent in 2010, and 48 percent in 2009.19 Another
major tool used by organizations to control salary costs, in both
good and bad times, is variable pay (See Chapters 8 and 10.)
As Exhibit 18.6 shows, while the size of the merit increase
budget has come down over time, the size of the variable pay
(e.g., lump sum merit increases, profit sharing) budget has gone
up very significantly. Unlike base salary increases, variable pay
does not become a permanent part of base salary. Thus, the
variable aspect allows companies to reduce labor costs when
times are tough and to share
673
EXHIBIT 18.5 Base Salary Increases in Recent Years, as
Percentage of Payroll, Salaried Exempt Employees
Source: Aon Hewitt, 2014 Annual Salary Increase Survey,
August 2014. Percentage increase each year is based on average
for salaried exempt, salaried nonexempt, and nonunion hourly
employee groups.
*Projected
EXHIBIT 18.6 Traditional Base Salary Increases and Variable
Pay, as Percentage of Payroll, Salaried Exempt Employees,
Changes Over Time
Source: Ken Abosch. Ensuring Effective Broad-Based Variable
Pay. Total Rewards 2014 Conference, WorldatWork. Aon
Hewitt, 2014 Annual Salary Increase Survey, August 2014.
* Projected
success with (and reward) employees when times are good. As
we saw earlier, the Big Three U.S. automobile companies have
followed this strategy in recent years.
Adjustments to average cash compensation level (here, to
simplify, we focus primarily on the salary component) can be
made (1) top down, in which top management determines the
amount of money to be spent on pay and allocates it “down” to
each subunit for the plan year, and (2) bottom up, in which
individual employees’ pay for the plan year is forecasted and
summed to create an organization-wide salary budget.Budget
Controls: Top Down
Top-down budgeting begins with an estimate from top
management of the pay increase budget for the entire
organization. Once the total budget is determined, it is then
allocated to each manager, who plans how to distribute it among
subordinates. There are many approaches to top-down
budgeting. A typical one, planned pay-level rise, is simply the
percentage increase in average pay for the unit that is planned
to occur. Several factors influence the decision on how much to
increase the average pay level for the next period: how much
the average level was increased this period, ability to pay,
competitive market pressures, turnover effects, and cost of
living.Current Year’s Rise
This is the percentage by which the average wage changed in
the past year; mathematically:
Percent paylevel− rise=100×average pay at yearend−−average
pay at year beginningaverage pay at year beginning
674Ability to Pay
Any decision to increase the average pay level is in part a
function of the organization’s financial circumstances.
Financially healthy employers may wish to maintain their
competitive positions in the labor market or share financial
success through bonuses and profit sharing. Conversely,
financially troubled employers may not be able to maintain
competitive market positions. As noted, the conventional
response has been to reduce employment. As shown earlier, by
analyzing pay and staffing at each level, potential cost savings
can be discovered. Other options are to reduce the rate of
increase in average pay by controlling adjustments in base pay
and/or variable pay. Raising employees’ copays and deductibles
for benefits is another. Often as a last resort, firms decrease
base wages (as well as variable pay). Airline pilots and
mechanics have taken highly publicized pay cuts in recent
years. Other alternatives also exist. Look again at the cost
model for St. Luke’s and its segmented labor supply. The
hospital can reduce costs by reducing the different sources of
contract nurses.Competitive Market Pressures
In Chapter 8, we discussed how managers determine an
organization’s competitive position in relation to its
competitors. Recall that a distribution of market rates for
benchmark jobs was collected and analyzed into a single
average wage for each benchmark. This “average market wage”
becomes the “going market rate,” and this market rate changes
each year in response to a variety of factors in the external
market.Turnover Effects
Sometimes referred to as “churn” or “slippage,” the turnover
effect recognizes the fact that when people leave (through
layoffs, quitting, retiring), they typically are replaced by
employees who earn a lower wage. Exhibit 18.2 illustrates
where an organization is overstaffed compared to competitors.
Reducing levels at E5 and E4 and replacing them with E1s and
E2s will reduce labor costs. However, keep in mind the
potential impact on revenues and customer satisfaction, as well
as possible violation of the Age Discrimination in Employment
Act.
The turnover effect can be calculated as annual turnover
multiplied by the planned average increase. For example,
assume that an organization whose labor costs equal $1 million
a year has a turnover rate of 15 percent and a planned average
increase of 6 percent. The turnover effect is .15 × .06 = 0.9%,
or $9,000 (.009 × $1,000,000). So instead of budgeting an
additional $60,000 to fund a 6 percent increase, only $51,000 is
needed. The turnover effect will also reduce benefit costs linked
to base pay, such as pensions.20Cost of Living
Although there is little research to support cost of living
increases, employees undoubtedly compare their pay increases
to changes in their living costs. Unions consistently argue that
increasing living costs justify increasing pay.
It is important to distinguish among three related concepts:
the cost of living, changes in prices in the product and service
markets, and changes in wages in labor markets. As Exhibit
18.7 shows, changes in wages in labor markets are measured
675
EXHIBIT 18.7 Three Distinct but Related Concepts and Their
Measures
through pay surveys. These changes are incorporated into the
system through market adjustments in the budget and updates of
the policy line and range structure. Price changes for goods and
services in the product and service markets are measured by
several government indexes, one of which is the consumer price
index (CPI). The third concept, the cost of living, refers to the
expenditure patterns of individuals for goods and services. The
cost of living is more difficult to measure because employees’
expenditures depend on many things: marital status, number of
dependents and ages, personal preferences, location, and so on.
Different employees experience different costs of living, and
the only accurate way to measure them is to examine the
personal expenditures of each employee.
The three concepts are interrelated. Wages in the labor market
are part of the cost of producing goods and services, and
changes in wages create pressures on prices. Similarly, changes
in the prices of goods and services create the need for increased
wages in order to maintain the same lifestyle.
Many people refer to the CPI as a “cost-of-living” index, and
many employers choose, as a matter of pay policy or in response
to union pressures, to tie wages to it. However, the CPI does not
necessarily reflect an individual employee’s cost of living.
Instead, it measures changes in prices over time. Changes in the
CPI indicate whether prices have increased more or less rapidly
in an area since the base period. For example, a CPI of 110 in
Chicago and 140 in Atlanta does not necessarily mean
676
that it costs more to live in Atlanta. It does mean that prices
have risen faster in Atlanta since the base year than they have in
Chicago, since both cities started with bases of 100.
e-Compensation
A simple inflation calculator
at www.westegg.com/inflation/ uses the consumer price index to
adjust any given amount of data from 1800 on. Most
governments calculate some kind of consumer price index for
their country. The Web page for the U.S. Bureau of Labor
Statistics provides many of these indexes (stats.bls.gov). They
vary on how realistically they capture actual changes in prices.
A word of caution: If you decide to use the CPI rather than
labor market salary surveys to determine the merit budget, you
basically are paying for inflation rather than performance or
market changes.
e-Compensation
A quicker way to compare living costs is to use the “relocation
salary calculator”
at www.homefair.com/homefair/calc/salcalc.html. Enter your
current city and potential new city to see what salary you need
in the new city based on cost-of-living differences. How
accurate is this website’s information?
The CPI is of public interest because changes in it trigger
changes in labor contracts, social security payments, federal and
military pensions, and food stamp eligibility. Tying budgets or
payments to the CPI is called indexing.Rolling It All Together
Let us assume that the managers take into account all these
factors—current year’s rise, ability to pay, market adjustments,
turnover effects, changes in the cost of living, and geographic
differentials—and decide that the planned rise in average salary
for the next period is 6.3 percent. This means that the
organization has set a target of 6.3 percent as the increase
in average salary that will occur in the next budget period. It
does not mean that everyone’s increase will be 6.3 percent. It
means that at the end of the budget year, the average salary
calculated to include all employees will be 6.3 percent higher
than it is now.
The next question is, How do we distribute that 6.3 percent
budget in a way that accomplishes management’s objectives for
the pay system and meets the organization’s goals?Distributing
the Budget to Subunits
A variety of methods exist for determining what percentage of
the salary budget each manager should receive. Some use a
uniform percentage, in which each
677
manager gets an equal percentage of the budget based on the
salaries of each subunit’s employees. Others vary the
percentage allocated to each manager based on pay-related
issues—such as turnover or performance—that have been
identified in that subunit.
Once salary budgets are allocated to each subunit manager, they
become a constraint: a limited fund of money that each manager
has to allocate to subordinates. Typically, merit increase
guidelines are used to help managers make these allocation
decisions. Merit increase grids help ensure that different
managers grant consistent increases to employees with similar
performance ratings and in the same position in their ranges.
Additionally, grids help control costs. Chapter 11 provides
examples of merit increase grids. To limit the number of
employees placed in high performance categories (and thus the
number of employees receiving the largest merit increases),
some companies used forced distribution approaches.Budget
Controls: Bottom Up
In contrast to top-down budgeting, where managers are told
what their salary budget will be, bottom-up budgeting begins
with managers’ pay increase recommendations for the upcoming
plan year. Exhibit 18.8 shows the process involved.
1.Instruct managers in compensation policies and techniques.
Train managers in the concepts of a sound pay-for-performance
policy and in standard company compensation techniques such
as the use of pay-increase guidelines and budgeting techniques.
Communicate market data and the salary ranges.
2.Distribute forecasting instructions and worksheets. Furnish
managers with the forms and instructions necessary to preplan
increases. Most firms offer managers computer software to
support these analyses and to enter information and perform
what-if analyses.21 Adjustments for each individual are fed into
the summary merit budget, promotion budget, equity adjustment
budget, and so on, on a summary screen. These
recommendations are then submitted electronically.
The type of information available to each supervisor to guide
him or her in making recommendations might include
performance rating history, past raises, training background,
and stock allocations are all included. Guidelines for increases
based on merit, promotion, and equity adjustments are provided,
and all the worksheets are linked so that the manager can model
pay adjustments for employees and see the budgetary effects of
those adjustments immediately.
Some argue that providing such detailed data and
recommendations to operating managers makes the process
biased. How would you like your instructor to look at your
overall GPA before giving you a grade in this course? Pay
histories, however, ensure that managers are at least aware of
this information and that pay increases for any one period are
part of a continuing message to individual employees, not some
ad-hoc response to short-term changes.
3.Provide consultation to managers. Offer advice and salary
information services to managers upon request. Dell’s online
approach makes it much easier to request and apply such
guidance.
678
EXHIBIT 18.8 Compensation Forecasting and Budgeting Cycle
4.Check data and compile reports. Audit the increases
forecasted to ensure that they do not exceed the pay guidelines
and are consistent with appropriate ranges. Then use the data to
feed back the outcomes of pay forecasts and budgets.
5.Analyze forecasts. Examine each manager’s forecast, and
recommend changes based on noted inequities among different
managers.
6.Review and revise forecasts and budgets with management.
Consult with managers regarding the analysis and any
recommended changes. Obtain top-management approval of
forecasts.
7.Conduct feedback with management. Present statistical
summaries of the forecasting data by department, and establish
unit goals.
8.Monitor budgeted versus actual increases. Control the
forecasted increases versus the actual increases by tracking and
reporting periodic status to management.
The result of the forecasting cycle is a budget for the upcoming
plan year for each organization’s unit as well as estimated pay
treatment for each employee. The budget does not lock in the
manager to the exact pay change recommended for each
employee. Rather, it represents a plan, and deviations due to
unforeseen changes such as performance improvements and
unanticipated promotions are common. The approach places
responsibility for pay management on the managers by requiring
them to plan the pay treatment for each of their employees. The
compensation manager takes on the role of advisor to operating
management’s use of the system.22
679Embedded (Design) Controls
Controls on managers’ pay decisions come from two different
aspects of the compensation process: (1) controls that are
inherent in the design of the techniques, and (2) the
formal budgeting process discussed above. Think back to the
many techniques already discussed: job analysis and evaluation,
skill- and competency-based plans, policy lines, range
minimums and maximums, broad bands, performance
evaluation, gain sharing, and salary-increase guidelines. In
addition to their primary purposes, these techniques also
regulate managers’ pay decisions by guiding what managers can
and cannot do. Controls are built into these techniques to direct
them toward the pay system objectives. A few of these controls
are examined below.Range Maximums and Minimums
Ranges set the maximum and minimum dollars to be paid for
specific work. The maximum is an important cost control.
Ideally, it represents the highest value the organization places
on the output of the work. With job-based structures, skills and
knowledge possessed by employees may be more valuable in
another job, but the range maximum represents the maximum
worth to an organization of work performed in a particular job.
When Walmart installed range maximums and minimums for its
jobs, its critics accused the company of “capping wages” of its
workers. Those readers who recall Chapter 8’s discussion on
designing ranges recognize that specific jobs may have a
maximum rate (a cap) but individuals may still be able to
increase their pay through promotions, profit sharing, and so
on.23
When employees are paid above the range maximum, these rates
are called red circle rates. Most employers “freeze” red circle
rates until the ranges are shifted upward by market update
adjustments so that the rate is back within the range again. An
organization also has the option to combine a salary freeze with
the use of merit bonuses, which unlike merit increases, do not
become part of base salary. If red circle rates become common
throughout an organization, then the design of the ranges and
the evaluation of the jobs should be reexamined. Green circle
rates refer to instances where employees are paid below the
minimum. As with red circle rates, organizations typically take
steps to make sure these are temporary.
Range minimums are just that: the minimum value placed on the
work. Often rates below the minimum are used for trainees. Pay
below minimum may also occur if outstanding employees
receive a number of rapid promotions and pay increases have
not kept up.Broad Bands
Broad bands are intended to offer managers greater flexibility
compared to a grade-range design. Usually broad bands are
accompanied by external market “reference rates” and “shadow
ranges” that guide managers’ decisions. Bands may be more
about career management than pay decisions. Rather, the control
is in the salary budgets given to managers. The manager has
flexibility in pay decisions, as long as the total pay comes in
under the budget.
680Promotions and External versus Internal Hires
Promotion-based pay increases are often substantial, meaning
that cost control efforts must monitor both rates of promotion
and the salary increase that is given with promotions. Some
organizations limit the number of promotions permitted within a
time period and some also limit the number of grades/levels that
an employee can advance as well as the size of the promotion
salary increase.24 Another, more strategic issue concerns the
degree to which positions are filled from the inside via
promotion versus the use of outside hires.25 Outside hires often
command a pay premium and, to the degree that their higher pay
is known to other employees, internal equity pressures may, in
some cases, result in higher pay for current employees as a
means to preserve current norms regarding relative pay.Compa-
Ratios
Range midpoints reflect the pay policy line of the employer in
relationship to external competition. To assess how managers
actually pay employees in relation to the midpoint, an index
called a compa-ratio is often calculated:
Comparatio−=average rate actual paidrange midpointCompa-
ratio=average rate actual paidrange midpoint
A compa-ratio of less than 1 means that, on average, employees
in a range are paid below the midpoint. That is, managers are
paying less than the intended policy. There may be several valid
reasons for such a situation. The majority of employees may be
new or recent hires; they may be poor performers; or promotion
may be so rapid that few employees stay in the job long enough
to get into the high end of the range.
A compa-ratio greater than 1 means that, on average, the rates
exceed the intended policy. The reasons for this are the reverse
of those mentioned above: a majority of workers with high
seniority, high performance, low turnover, few new hires, or
low promotion rates. Compa-ratios may be calculated for
individual employees, for each range, for organization units, or
for functions.
Other examples of controls designed into the pay techniques
include the mutual sign-offs on job descriptions required of
supervisors and subordinates. Another is slotting new jobs into
the pay structure via job evaluation, which helps ensure that
jobs are compared on the same factors. Similarly, an
organization-wide performance management system is intended
to ensure that all employees are evaluated on similar
factors.Variable Pay
The essence of variable pay is that it must be re-earned each
period, in contrast to conventional merit pay increases or
across-the-board increases that increase the base on which the
following year’s increase is calculated. We have distinguished
between fixed and variable pay and noted multiple times that
organizations have moved toward greater reliance on variable
pay. It is important enough that it bears repeating again. As we
saw in Exhibit 18.6, organizations have increased their use of
variable pay relative to traditional base pay increases.
681
Increases added into base pay have compounding effects on
costs, and these costs are significant. For example, a $15-a-
week take-home pay added onto a $40,000 base compounds into
a cash flow of $503,116 over 10 years. In addition, costs for
some benefits also increase. By comparison, the organization
could use that same $503,000 to keep base pay at $40,000 a year
and pay a 26.8 percent bonus every single year. As the example
shows, the greater the ratio of variable pay to base pay, the
more flexible the organization’s labor costs.
Apply this flexibility to the general labor cost model in Exhibit
18.1. The greater the ratios of contingent to core workers and
variable to base pay, the greater the variable component of labor
costs and the greater the options available to managers to
control these costs. A caution: Although variability in pay and
employment may be an advantage for managing labor costs, it
may be less appealing from the standpoint of managing
effective treatment of employees. The inherent financial
insecurity built into variable plans may adversely affect
employees’ financial well-being, especially for lower-paid
workers. Managing labor costs is only one objective for
managing compensation.Analyzing Costs
Costing out wage proposals is commonly done prior to
recommending pay increases, especially for collective
bargaining. For example, it is useful to bear in mind the dollar
impact of a 1-cent-per-hour wage change or a 1 percent change
in payroll as one goes into bargaining. Knowing these figures,
negotiators can quickly compute the impact of a request for a 9
percent wage increase.
Commercial compensation software is available to analyze
almost every aspect of compensation information. Software can
easily compare past estimates to what actually occurred (e.g.,
the percentage of employees that actually did receive a merit
increase and the amount). It can simulate alternate wage
proposals and compare their potential effects. It can also help
evaluate salary survey data and simulate the cost impact of
incentive and gain-sharing options.MANAGING REVENUES
Although the cost of compensation is most easily measured (and
managed/controlled), we cannot forget that compensation, via
its incentive and sorting effects on the workforce and its central
role in supporting strategy execution, is also central to driving
future revenues. According to one study, only about one-third of
organizations actually calculate the cost and value added by
their pay programs.26 Not surprisingly, another survey reports
that assessment of the impact of compensation on revenues falls
especially short, with about 70 percent of the compensation
specialists reporting their tools as “ineffective” to determine the
value added. However, a handful of companies, supported by
consultants and researchers, are beginning to analyze the value
added (or return on investments) of pay decisions and how that
influences revenues.27 This analysis requires a shift in how
compensation is viewed. Compensation becomes an investment
as well as an expense. Decisions are based on analysis of the
return on this investment. The hope is to answer questions such
as, “So what” returns are expected
682
from spending more on the offensive team (as do the Seattle
Seahawks), or showering rewards on the top performers (as does
General Electric), or on a new incentive plan based on a
balanced scorecard (as does Citigroup)?28
Exhibit 18.9 illustrates the approach to assessing value gained
in different ways, which directly or indirectly influence
revenues. The company in this exhibit has already done an
analysis that suggests that the top 10 percent of employees
improve returns by about 2 to 5 percent of their average salary.
Now the company is considering two actions:
1.Implement a bonus plan based on balanced scorecards for
individual managers.
2.Increase the differentiation between top performers and
average performers.
The exhibit shows the analysis of potential value added by these
two options. The returns are grouped into four types: recruiting
and retaining top talent, reducing turnover of top performers,
revenue enhancement, and productivity gains. The logic,
assumptions, measures, and estimates of gains are described in
the exhibit. The cautious reader will immediately see that the
assumptions are critical and based on research evidence, best
estimates, and judgments.
The practice of analyzing the returns from compensation
decisions is in its early stages. The promise is that it will direct
thinking beyond treating compensation as only an expense to
considering the returns gained as well. Our discussion of utility
analysis in the Appendix to Chapter 7 is an example of one
approach.29 Advocates want to develop compensation
managers’ analytical literacy. Readers will recognize the
similarity to topics in their finance and operations management
classes. Nevertheless, managers still must use their heads as
well as their models. Treating compensation as an investment
and employees as human capital risks losing sight of them as
people.30 The fairness objective must not get lost in the search
for ROI.
Using Compensation to Retain (and Recruit) Top Employees
Recall that one aspect of the sorting effect is that high
performers will tend to move from organizations that do not
adequately compensate them for the high value they create to
organizations that do. Some in this group will be “pushed” to
look for another job because of their perception that they are
not equitably paid. However, a substantial share of employees,
especially high performers, leave their jobs because of being
“pulled” by opportunities elsewhere. They leave not as a result
of being dissatisfied with their current job and/or as a result of
looking for a new job, but rather because an unsolicited
opportunity from a proactive organization came their
way.31 Indeed, Google’s top human resources executive takes
the view that the best people are doing well where they are and
that it is important to invest resources to learn who they are.
They may not actively search or apply for jobs at Google, but
Google wants to cultivate these “passive job seekers,” even if it
takes years because Google sees successfully hiring such people
as a path to higher revenues.32 The implication is that their
current employer would do well to keep compensation current
and competitive (given their skills and value/revenues
generated) because other (proactive) organizations will
eventually find them. It also means that organizations can be
proactive too not just in terms of keeping valuable employees
they already have, but in looking for people employed
elsewhere who can come and create value and higher revenues.
683
EXHIBIT 18.9 Examples of How Compensation Can Influence
Revenues (directly or indirectly)
684
MANAGING PAY TO SUPPORT STRATEGY AND CHANGE
In Chapter 2, we noted the important role of pay in supporting
the business strategy and the HR strategy. We saw that
organizations with different business strategies often have
correspondingly different compensation strategies. We also saw,
using the ability-motivation-opportunity (AMO) framework that
pay plays a crucial role. These alignment issues must be
managed successfully to drive future revenues (and control
costs). Compensation often plays a singular role when
organizations restructure. Strategic changes in the business
strategy mean the compensation strategy must be realigned as
well. Looking back again to Chapter 2, pay’s incentive effects
can help redirect and reenergize employee efforts. Its sorting
effects can help replace current employees who fit the old
system, but not the new system, with new employees who do fit.
The bigger the change, the bigger the sorting effects and the
more likely that there will a difficult period of adjustment as
part of the change. The question is whether the short-term pain
will be worth it to reposition the organization to better succeed
going forward in terms of achieving the goals of stakeholders
(owners, employees, customers, and so forth).
Pay is a powerful signal of change; changing people’s pay
captures their attention. At a broader level, pay changes can
play two roles in any restructuring. Pay can be a leading
catalyst for change or a follower of change. Shifts from
conventional across-the-board annual increases to profit sharing
or from narrow job descriptions and ranges to broad roles and
bands signal major change to employees. Determining the role
pay plays is an important part of a strategic perspective, as you
will recall from the Chapter 2 discussion of strategic mapping.
Microsoft’s shift from its uniquely aggressive stock options to
less risky stock awards illustrates the point. Microsoft used its
change in the pay mix to communicate a shift from a
“workaholic—get rich quick” to a “work hard—get paid well”
approach. Whether this shift acts as a catalyst or a support is
open to debate. As a catalyst, it communicates change more
strongly and vividly than any rhetoric could. It helps drive
recruiting and retention. Yet it may be that Microsoft had
already changed as an organization. Faced with murmuring
employees (their options were underwater) and external
conditions (an accounting rule change that required options to
be treated as an expense) the shift in pay mix merely confirmed
reality—that Microsoft had changed.
Whether pay is a leading catalyst for change or a follower of
change, compensation managers must learn how to implement
and manage change. Not only must they know the strategic and
technical aspects of compensation, they also must know how to
bargain, resolve disputes, empower employees, and develop
teams. Being able to grab bullets in midflight doesn’t hurt,
either.33
COMMUNICATION: MANAGING THE MESSAGE
Compensation communicates. It signals what is important and
what is not. If you receive a pay increase for one more year of
experience on your job, then one more year is important. If the
pay increase is equal to any change in the CPI, then the CPI and
its real meaning is important. If the increase is for moving to a
bigger job or for
685
outstanding performance, then a bigger job or outstanding
performance is important. Changes in a pay system also send a
powerful message. Microsoft’s shift from stock options to
grants tells everyone (current and future employees and
stockholders) to expect lower risks and lower returns.
Earlier in this book, we stressed that employees must
understand the pay system. Their understanding is shaped
indirectly through the paychecks they receive and directly via
formal communication about their pay, their performance, and
the markets in which the organization competes. An argument
for employee involvement in the design of pay systems is that it
increases understanding. Two surveys are revealing. A Watson
Wyatt survey of 13,000 employees reported that about only 35
percent of them understood the link between their job
performance and the pay they receive. (Watson Wyatt failed to
point out that some workers may simply believe that in their
organizations there is no real link!)34WorldatWork did a second
survey of 6,000 employees. Only about one-third of them said
they understood how pay ranges are determined or had a
reasonable idea of what their increase would be if they were
promoted. Fewer than half understood how their own pay
increases are calculated.35Exhibit 18.10 provides further
insight into employee (lack of) pay knowledge. Of note is that
only 8 and 4 percent, respectively, of compensation
professionals strongly agree that employees know their own pay
range (e.g., the maximum they can earn without getting
promoted), the pay range above them (so, how much they could
earn if they were promoted). By contrast, 15 and 20 percent,
respectively, strongly disagree that employees have this
information, which presumably is relevant to their work
motivation. Finally, only a minority of respondents agree that
pay-related information is “shared openly” in their
organizations.
Two reasons are usually given for communicating pay
information. The first is that considerable resources have been
devoted to designing a fair and equitable system that is intended
to attract and retain qualified people and motivate performance.
For managers and employees to gain an accurate view of the pay
system—one that perhaps influences their attitudes about it—
they need to be informed. Of course, one might observe that
increasing the accuracy of employee perceptions through pay
openness is most useful in cases where the compensation system
is well-designed and will be perceived as fair and credible by
employees. In that case, from a motivational point of view, it
would certainly make sense to communicate and demonstrate to
employees that those with consistently high performance
receive higher compensation (including via more promotions)
than others.36 Thus, it is quite interesting (see Exhibit 18.10)
that most (25% + 41% = 66%) U.S. private sector employees
report working in organizations where pay secrecy is the policy
and few (17%) report that pay information is made public. The
lack of pay knowledge among employees discussed above now
becomes easier to understand. As Exhibit 18.10 also shows,
there is much more pay openness in the public sector (both
because of higher union coverage and because taxpayers wish to
know how their tax dollars are spent).
Finally, it is important to keep in mind that a pay secrecy policy
in private sector organizations may be illegal. Under the
National Labor Relations Act, it is illegal if it interferes with
“concerted action” by employees. In addition, Executive Order
13665, “Non-Retaliation for Disclosure of Compensation
Information,” prohibits federal contractors or subcontractors
from “discharging or discriminating in any other way
686
EXHIBIT 18.10 Pay Communication and Employee Knowledge
of Pay
Source: Dow Scott, Tom McMullen, Bill Bowbin, and John
Shields. Alignment of Business Strategies, Organization
Structures and Reward Programs: A Survey of Policies,
Practices and Effectiveness. WorldatWork, May 2009. N = 442
to 446 responses from compensation professionals.
against employees or applicants who inquire about, discuss, or
disclose their own compensation or the compensation of another
employee or applicant.”37 It serves to modify existing
Executive Order 11246 with the aim of making it more
effective. A major rationale given is that to the degree
discrimination explains why men and women are paid
differently, “strictures against revealing compensation can
conceal compensation disparities among employees. This makes
it impossible for an employee to know he or she is being
underpaid compared to his or her peers. If compensation
remains hidden, employees who are being unfairly paid less
because of their gender or race will remain unaware of the
problem and will be unable to exercise their rights by filing a
complaint pursuant to the Executive Order.”
The second (and related) reason for communicating pay
information is that, according to some research, employees seem
to misperceive the pay system. For example, they tend to
overestimate the pay of those in lower-level jobs and to
underestimate the pay of those in higher-level jobs. They
assume that the pay structure is more compressed than it
actually is. If differentials are underestimated, their
motivational value is, as noted above, diminished, because they
underestimate the payoff to high performance.
Further, there is some evidence to suggest that the goodwill
engendered by the act of being open about pay may also affect
perceptions of pay equity. Interestingly, the research also shows
that employees in companies with open pay communication
policies are as inaccurate in estimating pay differentials as
those in companies in which pay secrecy prevails.38 (Caution:
Most of this research was done over 20 years ago.) However,
employers in companies with open pay policies tend to express
higher satisfaction with their pay and with the pay
system.39 Other research indicates that employee reactions to
pay secrecy versus pay openness depend on equity sensitivity,
with those more sensitive to whether pay is fair given inputs
like performance being most likely to respond favorably (higher
performance, stronger perceived performance—
pay instrumentality) to pay openness.40 Other research, in a
university setting, found that making pay information on other
employees in the university systems more explicitly available
resulted in more pay comparisons by employees (especially with
peers in the same department) and lower satisfaction and greater
search intentions among
687
EXHIBIT 18.11 Pay Secrecy Policies, Private and Public Sector
Source: Adapted from Institute for Women’s Policy
Research, Pay Secrecy and Wage Discrimination. Fact
Sheet IWPR #C382, June 2011, www.ipr.org.; accessed June 5,
2012. Data from national (U.S.) survey of 2,700 adults (18 and
over). Percentages differ slightly from source because
categories constrained here to sum to 100%.
employees paid below the median for their department and
occupation. This finding led the study authors to conclude that
“employers have a strong incentive to impose pay secrecy
rules,” but also noted that another result could be a change in
the composition of the workforce.41Another way to put it is that
being more open with pay information will decrease the
satisfaction of some employees. So, an employer must be
prepared to address that consequence. However, an employer
will also want to consider who is dissatisfied and why. To the
degree that pay is based on performance, being more open with
pay could result in positive sorting effects over time to the
extent that it is low performers who are dissatisfied and they
leave and are replaced by higher performing employees. A
laboratory study found some evidence that more open pay not
only had positive incentive effects on performance (especially
when performance was measured in relative terms), but also that
there were positive sorting effects of the type just suggested.42
In the case of benefits too, communication plays a potentially
important role. We know that employees greatly underestimate
the value of their benefits, which is a major concern given that
benefits add roughly 40 cents on top of every dollar spent on
cash compensation.43
WorldatWork recommends a six-stage process of
communication, similar to that shown in Exhibit 18.12.44
Step 1 is, not surprisingly, defining the objectives of the
communication program. Is it to ensure that employees fully
understand all the components of the compensation system? Is it
to change performance expectations? Or is it to help employees
make informed health care choices? While specifying objectives
as a first step seems obvious, doing so is often overlooked in
the rush to design an attractive brochure, website, or CD.
Step 2 is to collect information from executives, managers, and
employees to assess their current perceptions, attitudes, and
understanding of the subject. Information may be gathered
through online opinion surveys and focus groups to identify
problems in understanding the compensation system.
688
EXHIBIT 18.12 The Compensation Communication Cycle
Step 3 is a communication program that will convey the
information needed to accomplish the original objectives. There
is no standard approach on what to communicate to individuals
about their own pay or that of their colleagues. Some
organizations adopt a marketing approach. That includes
consumer attitude surveys about the product, snappy advertising
about the pay policies, and elaborate websites expounding
policies and rationale. The objective is to manage expectations
and attitudes about pay. In contrast, the communication
approachtends to focus on explaining practices, details, and the
way pay is determined. The marketing approach focuses on the
strategy, values, and advantages of overall policies and may be
silent on specifics such as range maximums, increase guides,
and the like.
Steps 4 and 5 of the communication process are to determine the
most effective media, in light of the message and the audience,
and to conduct the campaign. The message can be fine-tuned,
depending on the audience. Executives, for example, should be
interested in how the compensation programs fit the business
strategy. Managers need to know how to use the development
and motivation aspects of the compensation program for the
people they supervise. Employees may want to know the
processes and policies as well as specifics about how their pay
is determined. The danger is overload—information is so
detailed that employees get snowed under sorting through it.
Step 6 of the communication process suggests that the program
be evaluated. Did it accomplish its goals? Pay communication
often has unintended consequences.45 For example, improving
employees’ knowledge about pay may cause
689
some initial short-term concerns. Over the years, employees
may have rationalized a set of relationships between their pay
and the perceived pay and efforts of others. Receiving accurate
information may require that those perceptions be adjusted.
e-Compensation
One compensation manager reports having a great deal of
difficulty with an employee who used the homefair
website www.homefair.com to determine that he should receive
a 30 percent pay differential to accompany his transfer from one
office to another. In contrast, the manager’s information showed
a differential of around 12 to 15 percent. How can you judge the
accuracy of information obtained on the Web? How would you
deal with the unhappy employee?
Say What? (Or, What to Say?)
As noted above, if the pay system is not based on work-related
or business-related logic, then the wisest course is probably to
avoid formal communication until the system is put in order.
However, avoiding formal communication is not synonymous
with avoiding communication. Employees are constantly getting
intended and unintended messages through the pay treatment
they receive.
Some employers communicate the range for an incumbent’s
present job and for all the jobs in a typical career path or
progression to which employees can logically aspire. Some also
communicate the typical pay increases that can be expected for
poor, satisfactory, and top performance. The rationale given is
that employees exchange data (not always factual) and/or guess
at normal treatment and that the rumor mills are probably
incorrect. However, as we saw just above, employee pay
knowledge is often quite limited.
How people process information and make decisions, as shown
in Exhibit 18.13, offers some new ideas when contemplating
compensation communications.46
Opening the Books
There are some who advocate going beyond the sharing of pay
information to the sharing of all financial information with
employees.47Employees at engine rebuilder Springfield
Remanufacturing receive weekly peeks at everything from
revenues to labor costs. The employees, who own 31 percent of
the company stock, believe that this “open-book” approach
results in high commitment and an understanding of how to
maintain competitiveness. Whole Foods’ open-paybook
approach was described in Chapter 1. Most employers don’t
share information with such gusto, but they are increasingly
disclosing more to their employees. Some are even providing
basic business and financial training to help employees better
understand the information. Devotees of opening the books and
providing financial training believe these methods will improve
attitudes and performance, but there is no research to support
this. With salary data available on the Internet (albeit often
inaccurate and misleading), developing in-house compensation
portals has appeal.
690
EXHIBIT 18.13 Guidance from the Research on Pay
Communication
At the minimum, the most important information to be
communicated is the work-related and business-related
rationales on which pay systems are based. Some employees
may not agree with these rationales or the results, but at least it
will be clear that pay is determined by something other than the
whims of their supervisors.
STRUCTURING THE COMPENSATION FUNCTION AND ITS
ROLES
Compensation professionals seem to be constantly reevaluating
where within the organization the responsibility for the design
and administration of pay systems should be located. The
organizational arrangements of the compensation function vary
widely.48 Other key issues include the use of enterprise
information systems and ethics issues for compensation
professionals.
Centralization–Decentralization (and/or Outsourcing)
An important issue related to structuring the function revolves
around the degree of decentralization (or centralization) in the
overall organization structure. Decentralized refers to a
management strategy of giving separate business units the
responsibility of designing and administering their own
systems. This contrasts with a centralized strategy, which
locates the design and administration responsibility at corporate
headquarters. A centralized compensation strategy and function
is more likely to be found in smaller and/or single line of
business organizations. This “one size fits all” approach is more
likely to make sense when the entire company mostly competes
in a single product market. Examples include Herman Miller
(furniture) and McDonald’s (quick service food).49 However, in
organizations (e.g., IBM) that are larger and/or compete in
different product (or geographic) markets, human resource and
compensation strategies are more likely to need to be tailored to
fit those different contexts. In such cases, compensation
professionals are increasingly likely
691
to be embedded in each business unit. Typically, corporate will
retain some number of compensation professionals, perhaps in
what is known as a center for expertise. This group provides an
internal consulting capability that human resource professionals
in the business units, who are often human resource generalists,
can be drawn on to assist in the design of compensation
strategies. The mix of corporate and business unit compensation
expertise is a balancing act. Too big of a corporate group risks
becoming out of touch with specific business unit needs. Too
many staff in the business units risks reinventing the wheel,
duplication/redundancy of expertise, and higher costs. Over
time, it is not unusual to see the pendulum swing within
companies back and forth between more or less centralization.
Other, more decentralized organizations, such as Eaton and GE,
have relatively small corporate compensation staffs. Sometimes,
their primary responsibility is to manage the systems by which
executives and the corporate staff are paid (although GE
corporate compensation drives the salary planning process
company-wide). These professionals may operate in a purely
advisory capacity to other organization sub-units. The subunits,
in turn, may employ their own compensation specialists. Or the
subunits may choose to employ only personnel generalists rather
than compensation specialists and may turn to outside
compensation consultants to purchase the expertise required on
specific compensation issues.
AES, an electric power company, has no compensation unit at
all. They don’t even have an HR department. Compensation
functions are handled by teams of managers. Decentralizing
certain aspects of pay design and administration has
considerable appeal. Pushing these responsibilities (and
expenses) close to the units, managers, and employees affected
by them may help ensure that decisions are business-related.
However, decentralization is not without dilemmas. For
example, it may be difficult to transfer employees from one
business unit to another. A pay system may support a subunit’s
objectives but run counter to the overall corporate objectives.
Also, we have seen time and again that decentralization, which
by definition includes less direct control of what managers do,
can contribute to legal problems. As noted in Chapter 17, for
example, Walmart is facing sex-discrimination claims in what
would be the largest class action discrimination suit to date (1.6
million or more claimants). Interestingly, Walmart has argued
that “establishing a national class is unwarranted because its
store managers acted with discretion” in their decisions
regarding promotion and pay of workers. So, in effect,
Walmart’s defense is that if its managers discriminated, it was
because Walmart did not have centralized control over their
decisions.50Flexibility within Corporatewide Principles
The answers to these and related problems of decentralization
can be found in developing a set of corporatewide principles or
guidelines that all must meet. The principles may differ for each
major pay technique. For example, GE’s business units
worldwide have the flexibility to design incentive plans tailored
to each unique business unit’s strategies and cultures. The only
guidance is to ensure that the plans adhere to GE’s basic
beliefs, improve financial and business objectives, and maintain
or enhance GE’s reputation.
692
Keep in mind that the pay system is one of many management
systems used in the organization. Consequently, it must be
congruent with these other systems. For example, it may be
appealing, on paper at least, to decentralize some of the
compensation functions. However, if financial data and other
management systems are not also decentralized, the pay system
may be at odds with other systems.Reengineering and
Outsourcing
Value chain analysis and Six Sigma are processes used to
improve quality and ensure that value is added by each
technique and at each stage in a process. For the compensation
system, the basic question to ask is, “Does each specific activity
(technique) directly contribute to our objectives?” If some
added value isn’t apparent, then the question is, “How should it
be redesigned? Or should it be dropped?” Of those activities
that do add value, the next question is, “Who should do it?”
“Should the activity be done in-house, or can others do it more
effectively? That is, should it be outsourced?”
Outsourcing is a viable alternative as organizations struggle
with activities that do not directly contribute to objectives.
These are often referred to as transactional activities, which are
not unique to the organization and might be done cheaper (and
perhaps also better) by an outside provider. On the other hand,
more transformational or strategic activities (e.g., what pay-for-
performance strategy would best align with the business
strategy) are less likely to be outsourced.51
Cost savings are the major potential advantage of outsourcing.
All those compensation pros can be laid off and/or retrained and
reassigned to other work. Sometimes, the quality of the service
provided may increase also. A firm that does nothing but
administer retirement benefits may be able to do a better job
than a firm whose primary business is something else (e.g.,
making furniture or cars, selling quick service food). Major
potential disadvantages include less responsiveness to unique
employee–manager problems, less control over decisions that
are often critical to all employees (i.e., their pay), and
information leaks to rivals and competitors. In addition, as with
any contract, while an agreement may be signed stating that an
outsourcing firm will provide a certain set of services and at a
certain level, either side may subsequently find that their vision
of the agreement and their experience of what is actually
delivered may end up being different.52Balancing Flexibility
and Control
One of the major attacks on traditional compensation plans is
that they often degenerate into bureaucratic nightmares that
hinder the organization’s ability to respond to competitive
pressures. Some recommend reducing the controls and
guidelines inherent in any pay plan. Hence, banding eliminates
or at least reduces the impact of range maximums and
minimums. Replacing merit grids with bonuses eliminates the
link between the pay increase and the employees’ salary
position in the range and performance rating. Replacing job
evaluation with skill- or competency-based plans permits
assigning employees to a variety of work, regardless of their
pay.
Such approaches are consistent with the oft-heard plea that
managers should be free to manage pay. Or, as some more
bluntly claim, pay decisions are too important to
693
be left to compensation professionals. Yet, permitting managers
to be free to pay employees as they judge best rests on a basic
premise: Managers will use pay to achieve the organization’s
objectives—efficiency, fairness, and compliance with
regulations—rather than their own objectives. But the ongoing
leadership scandals in some corporations and public agencies
casts doubt on this premise.
Clearly, some balance between hidebound controls and chaos is
required to ensure that pay decisions are directed at the
organization’s goals yet permit sufficient flexibility to respond
to unique situations. Achieving the balance becomes the art of
managing compensation.
A final issue related to pay design and administration is the
skills and competencies required in compensation managers.
The grandest strategy and structure may seem well designed,
well thought out in the abstract, but could be a disaster if
people qualified to carry it out are not part of the staff. In view
of the importance of a well-trained staff, both WorldatWork and
the Society of Human Resource Managers (SHRM) have
professional development programs to entice readers into the
compensation field.Making Information Useful—Compensation
Enterprise Systems
A friend of ours e-mailed from Shanghai that “six months after
we have acquired this operation from the government, I still
cannot get an accurate headcount. I do not know how many
people we actually employ or who should get paychecks!” That
manager clearly needs more information. But most managers
find themselves overwhelmed with too much information. The
challenge is to make the information useful.
Compensation software transforms data into useful information
and guides decision making. Many software packages that serve
a variety of purposes are available.53 Some of them
support employee self-service, by which employees can access
their personal information, make choices about which health
care coverage they prefer, allocate savings between growth or
value investment funds, access vacation schedules, or check out
a list of child or elder care service providers. Manager self-
service helps managers pay their employees
appropriately. Communication portals, designed for employees
or managers, explain compensation policies and practices,
answer frequently asked questions, and explain how these
systems affect their pay.54 Other software processes
transactions. It standardizes forms, performs some analysis, and
creates reports at the click of the mouse. The advantage is that
all employees at all locations are on the same system.
While compensation software is proliferating, what remains a
scarcer resource is the intellectual capital: the compensation
knowledge and judgment required to understand which
information, analyses, and reports are useful. Part of this
intellectual capital includes analytical (read “statistical and
math”) skills. Another part is knowledge of the business. A
shortage of this knowledge among compensation managers not
only limits the usefulness of compensation software but also
limits the contribution of compensation management.
Computers inevitably bring up the issue of confidentiality. If
personal compensation data are accessible to employees and
managers, privacy and security issues as well as ethical and
legal issues emerge. Regulations vary around the world. The
European Union
694
has issued the Data Privacy Directive, which is significantly
stronger than U.S. regulations.55 Unauthorized users, both
inside and outside the corporation, remain a threat.Ethics:
Managing or Manipulating?
Compensation ethics is not an oxymoron. But absent a
professional code of behaviors and values, it is a challenge for
compensation managers to ensure that their actions are ethical.
The Web page for the compensation society, WorldatWork,
includes the topic of ethics. Public discussion of ethics in
compensation topics such as executive pay or backdating option
grants benefits from the voices of informed compensation
practitioners.
Managing compensation ethically is increasingly complicated
for several reasons. First, pay really matters; it is important to
all of us. Second is the fierce pressure to achieve results. The
increased use of pay for performance, which is based on results
achieved and exceeding targets, can contribute to these
pressures. However, assessing results sometimes has a “smoke
and mirrors” feel to it. At an organization’s compensation
strategy session that we attended, the chief financial officer
observed that it was possible to “manage our reported earnings
within several percentage points of the target. We can exceed
analysts’ and shareholder expectations by 1 to 10 percent.” This
was relatively easy for this particular company since about one-
third of its earnings came from liquid investments in other
companies. The remainder was revenue from its products and
services. The implication of managing earnings for employees’
profit-sharing payouts and executive stock valuations were not
ignored. The point is that measures of financial performance do
not provide an immutable gold standard. They can be
“managed.”56Where Is the Compensation Professional?
Performance-based pay is not the only area that presents ethical
dilemmas. Misusing and even failing to understand survey
statistics, manipulating job evaluations, peer-company
competitive data, masking overtime and pay discrimination
violations, failure to understand that correlation does not mean
causation, and recommending pay programs without addressing
their expected costs and returns should force us to take a hard
look at what we are doing.57
Stephen Landry, the former HR director at Sycamore Networks,
reports that the company’s chief financial officer pressured him
to change the hiring dates of some employees to make their
stock option grants worth more money. These actions were to be
kept hidden from the company auditors. Instead, Landry told
executives these actions were unethical and probably illegal. He
was fired. Internal memos from the company reveal a “risk
assessment” of the action becoming exposed. Changing the date
on documents was judged a low risk since the original grant
“has been deleted from the system in its entirety.” Landry is
suing and the SEC is investigating. If Mr. Landry’s experience
is not enough for the professional compensation community,
over at Cablevision, they backdated stock grants to a dead
executive.58
A starting point to judge the ethics of our behavior may be our
compensation model, presented with the advice: “Strive to
achieve both efficiency and fairness.”
695
Your Turn
Communication by Copier
Deb Allen’s life-altering discovery at work really
“communicated” her company’s pay practices. Swamped with
work at an asset-management firm, she went into the office over
the weekend and found a document abandoned on the copy
machine. The document contained the base compensation,
raises, performance ratings, and bonus information for 80 of her
colleagues.
Ms. Allen was outraged that a noted screw-up was making
$65,000 a year more than more competent colleagues, while
some new hires were earning almost $200,000 more than their
counterparts with more experience. The discovery led her to
question why she was working weekends for less pay than
others were getting. “I just couldn’t stand the inequity of it,”
she says. Three months later she quit.
But Ms. Allen couldn’t bring herself to share the information
with her colleagues. “I would have been better off not knowing
any of that,” she explains. “I couldn’t give it to people who
were still working there because it would make them depressed,
like it made me depressed.”
1.How would you have reacted if you were Ms. Allen? Explain
why.
2.Put yourself in the place of the compensation director at Ms.
Allen’s company. Based on the pay model and what you now
know about compensation, are there any possible business- and
work-related explanations for what Ms. Allen observed (i.e., the
screw-up getting $65,000 more; new hires earning $200,000
more than more-experienced employees; and Ms. Allen making
less pay than others)?
3.As the compensation director, what would you do if Ms. Allen
had brought you this document, and asked for your help in
understanding what was going on. (Firing the person who left it
on the copier is not an option. It may have been you.)
Still Your Turn
Managing Compensation Costs, Headcount, and
Participation/Communication Issues
Cisco Systems, Hewlett-Packard, American Airlines, and
General Motors are examples of companies that have cut
employment or cut wages and/or benefits to reduce labor costs
in hopes of becoming more competitive and more profitable.
Indeed, American and GM went through bankruptcy in part to
gain control over labor costs. In contrast, some companies—
Southwest Airlines, Nucor, and Lincoln Electric—have a no-
layoff practice and do not appear to have cut
696
wages or benefits even in years when sales have declined
significantly (They have also not gone through bankruptcy).
What is the difference between these two sets of companies? Is
it simply that one set of companies cares more about its
employees than the other set of companies cares about its
employees? Or, is it also the case that Southwest, Nucor, and
Lincoln Electric have set up their compensation strategies in a
way that makes them more able (than Cisco, HP, American, and
GM) to cut labor costs when times are tough? (For more
background, go to google.com or another search engine and
conduct a separate search for each company using its name and
the term “layoff.”) What about protecting investment in
employees and employee relations?
What can an employer do to make labor costs flexible so that
profits do not take as much of a beating during difficult
economic times and so that fewer employees need to be laid
off? If you were in charge of designing a compensation system
for a company that is fairly new but is now reaching a stage and
size where it needs a formal compensation system, how would
you design the compensation system to have labor cost
flexibility? To what degree would you have others at the
company participate in the design of the new compensation
system? Who would participate? Would you follow a policy of
pay openness in communicating your compensation system?
Provide a rationale for your decisions.Summary
We have now completed the discussion of the pay management
process. Management includes control: control of the way
managers decide individual employees’ pay as well as control of
overall costs of labor. As we noted, some controls are designed
into the fabric of the pay system (embedded controls). The
salary budgeting and forecasting processes impose additional
controls. The formal budgeting process focuses on controlling
labor costs and generating the financial plan for the pay system.
The budget sets the limits within which the rest of the system
operates.
We also noted that with the continuous change in organizations,
compensation managers must understand how to manage change
and be knowledgeable business partners. They are responsible
for communicating information about pay in a way that treats
employees fairly and honestly. The basic point is that pay
systems are tools, and like any tools they need to be evaluated
in terms of usefulness in achieving an organization’s
objectives.Review Questions
1.How can employers control labor costs?
2.How does the management of the pay system affect pay
objectives?
3.Why is the structure of the compensation function important?
4.Give some examples of how employers use inherent controls.
5.What activities in managing the pay system are likely
candidates to be outsourced? Why?
6.Use Exhibit 18.13 to explain how the research on individual
decision making can be used in pay communication.
ndnotes
1.Sanford Jacoby, The Embedded Corporation (Princeton:
Princeton University Press, 2005).
2.Felix Barber and Rainer Strack, “The Surprising Economics of
a ‘People Business’,” Harvard Business Review, June 2005, pp.
81–90.
3.D. Scott, D. Morajda, T. McMullen, and R. Sperling,
“Evaluating Pay Program Effectiveness,” WorldatWork Journal,
15(2), Second Quarter 2006, pp. 50–59.
4.Lindsay Scott, “Managing Labor Costs Using Pay-for-
Performance,” Lindsay Scott & Associates,
Inc., www.npktools.com.
5.Reward Transformation: Turning Rewards from Costs into an
Investment (New York: Deloitte, 2006), www.deloitte.com.
6.Personal communication from B. Dunn, president, McLagan
Partners; D. Scott, D. Morajda, T. McMullen, and R. Sperling,
“Evaluating Pay Program Effectiveness,” WorldatWork
Journal 15(2), Second Quarter 2006, pp. 50–59; John Boudreau
and Peter Ramstad, “From ‘Professional Business Partner’ to
‘Strategic Talent Leader:’ What’s Next for Human Resource
Management,” CAHRS Working Paper 02–10, Ithaca, NY.
7.B. Dunn, president, McLagan Partners; The Lake Wobegon
Salary Survey, Lindsay Scott & Associates,
Inc., www.npktools.com, 2006.
8.Allen Smith, “Layoffs in Europe: Deal or No Deal?” HR
Magazine, January 2009, pp. 71–73.
9.Charlie O. Trevor and Anthony J. Nyberg, “Keeping Your
Headcount When All About You Are Losing Theirs:
Downsizing, Voluntary Turnover Rates, and the Moderating
Role of HR Practices,” Academy of Management Journal 51
(2008), pp. 259–276.
10.Timothy Aeppel and Justin Lahart, “Lean Factories Find It
Hard to Cut Jobs Even in Slump,” The Wall Street Journal,
March 9, 2009, p. A1.
11.Erin White, “Retaining Employees before an Upturn
Hits,” The Wall Street Journal, May 8,
2009, http://online.wsj.com/article/SB124178707883900633.htm
l, September 14, 2009; Gray Yohe, “A Delicate
Balance,” Human Resource Executive, March 2,
2009, www.hreonline.com/HRE/story.jsp?storyId=1815633178q
uery=morale, September 14, 2009.
12.Clint Chadwick, Larry W. Hunter, and Stephen Walston,
“Effects of Downsizing Practices on the Performance of
Hospitals,” Strategic Management Journal 25 (2004), pp. 405–
427.
13.Charles Duhigg, “Hospital Clients Nurture Firm’s
Scheduling Software,” Los Angeles Times, June 21, 2006, p.
C1.
14.Susan Saulny and Robbie Brown, “On a Furlough, but Never
Leaving the Cubicle,” The New York Times, June 15, 2009;
Jonathan Buck, “British Airways Urges Staff to Work without
Pay,” The Wall Street Journal, June 16, 2009; “The Quiet
Americans: Employees Are Social in the Face of Pay Cuts and
Compulsory Unpaid Leave,” The Economist, June 25,
2009, www.economist.com/world/unitedstates/displaystory.cfm?
story_id=13915822, September 14, 2009.
15.Riva Richmond, “How to Cut Payroll Without
Layoffs,” BusinessWeek, April 3,
2009, www.businessweek.com/magazine/content/09_64/s090404
8707309.htm, September 14, 2009; Matthew Boyle, “Cutting
Work Hours Without Cutting Staff,” BusinessWeek, February
25,
2009, www.businessweek.com/magazine/content/09_10/b412205
5789445.htm, September 14, 2009.
16.Ron Lieber, “Et Tu, AARP? Good Guys Cut 401(k)s,
Too,” The New York Times, June 27, 2009, p. B1.
17.Sandra Block, “Companies Rethink 401(k) Plan
Contributions for Employees,” USA Today, June 24,
2009, www.usatoday.com/money/perfi/retirement/2009-06-24-
401kcontributions-economy_N.htm, September 14, 2009.
698
18.Michael Sanserino, “Pay Raises Are the Smallest in Decades,
Surveys Show,” The Wall Street Journal, July 21, 2009; Aon
Hewitt, Annual Salary Increase Survey, September 2011.
19.Aon Hewitt, Annual Salary Increase Survey, September
2011.
20.Carlos Tejada and Gary McWilliams, “New Recipe for Cost
Savings: Replace Expensive Workers,” The Wall Street Journal,
June 11, 2003, pp. 1, A12.
21.John Watson, “Delivering Total Compensation Online at
Dell,” ACA News 42(4), April 1999, pp. 14–19.
22.Ronald T. Albright and Bridge R. Compton, Internal
Consulting Basics (Scottsdale, AZ: American Compensation
Association, 1996); John Watson, “Delivering Total
Compensation Online at Dell,” ACA News 42(4), April 1999,
pp. 14–19.
23.Jennifer Hicks, an Oklahoma State University student, has
coined the term “yellow circle rates” while working as a
compensation specialist for FastCat. Yellow circle rates result
where if you give an employee the percent raise indicated by the
merit increase grid, that employee would become red circled.
For Walmart information, see Steven Greenhouse and Michael
Barbaro, “Wal-Mart to Add Caps and Part-Timers,” The New
York Times, October 2, 2006, p. B1.
24.WorldatWork. Promotional Guidelines 2010. December
2010. www.worldatwork.org/waw/adimLink?id=45914; accessed
June 22, 2012.
25.M.J. Bidwell and J.R. Keller, “Promote or Hire? Comparing
Make or Buy and Competing Process Views in a Professional
Service Firm,” working paper, Wharton School, University of
Pennsylvania. See the related article: Rachel Emma Silverman
and Lauren Weber, “An Inside Job: More Firms Opt to Recruit
From Within,” The Wall Street Journal, May 29, 2012.
26.Reward Transformation: Turning Rewards from Costs Into an
Investment (New York: Deloitte, 2006), www.deloitte.com;D.
Scott, D. Morajda, T. McMullen, and R. Sperling, “Evaluating
Pay Program Effectiveness,” WorldatWork Journal 15(2),
Second Quarter 2006, pp. 50–59.
27.Wayne Cascio, Responsible Restructuring: Creative and
Profitable Alternatives to Layoffs (San Francisco: Berrett-
Koehler, 2002); John Boudreau and Peter Ramstad, “Beyond
Cost per Hire and Time to Fill: Supply-Chain Measurements for
Staffing” (Los Angeles: Center for Effective Organizations,
2006); Jaap deJonge, Watson Wyatt Human Capital Index (New
York: Watson Wyatt, 2003); S. Raza, Optimizing Human
Capital Investments for Superior Shareholder Returns (New
York: Hewitt Associates, 2006); M. Huselid and B. Becker,
“Improving HR Analytical Literacy: Lessons from Moneyball,”
chapter 32 in M. Losey, S. Meisinger, and D. Ulrich, The Future
of Human Resource Management (Hoboken, NJ: Wiley, 2005);
J. Burton and S. Pollack, “ROI of Human Capital: The United
States and Europe,” Workspan, November 2006, pp. 28–27.
28.Ibid.
29.M. C. Sturman, C. O. Trevor, J. W. Boudreau, and B.
Gerhart, “Is It Worth It to Win the Talent War? Evaluating the
Utility of Performance-Based Pay,” Personnel Psychology 56
(2003), pp. 997–1035; Wayne Cascio and John
Boudreau, Investing in People (Saddle River, NJ: Pearson
Education, 2008); Mark A. Huselid, Brian E. Becker, and
Richard W. Beatty, The Workforce Scorecard (Boston: Harvard
Business School Press, 2005).
30.Peter F. Drucker, “They’re Not Employees, They’re
People,” Harvard Business Review, February 2002, pp. 70–77.
31.Lee, T. H., B. Gerhart, I. Weller, and C. O. Trevor,
“Understanding Voluntary Turnover: Path-Specific Job
Satisfaction Effects and the Importance of Unsolicited Job
Offers,” Academy of Management Journal, 51 (2008), 651–671.
32.Laszlo Bock, Work Rules! (Twelve, 2015). Daniel,
Freedman, “Silicon Valley Star Search.” Wall Street Journal,
April 7, 2015., p. A11. Call, M. L., Nyberg, A. J., &
699
Thatcher, S. M. B. (2015, March 30). Stargazing: An Integrative
Conceptual Review, Theoretical Reconciliation, and Extension
for Star Employee Research. Journal of Applied Psychology.
Advance online publication.
33.Michael Beer and Mitin Nohria, “Cracking the Code of
Change,” Harvard Business Review, May–June 2000, pp. 133–
141; Dave Ulrich, “A New Mandate for Human
Resources,” Harvard Business Review, January–February 1998,
pp. 125–134.
34.“Growing Worker Confusion about Corporate Goals
Complicates Recovery, Watson Wyatt WorkUSA Study Finds,”
Watson Wyatt news release, September 9, 2002.
35.Robert L. Heneman, Paul W. Mulvey, and Peter V. LeBlanc,
“Improve Base Pay ROI by Increasing Employee
Knowledge,” WorldatWork Journal 11(4), Fourth Quarter 2002,
pp. 22–27.
36.A. Bandura, Social Learning Theory (New York: General
Learning Press, 1977); E.E. Lawler, Pay and Organizational
Effectiveness: A Psychological View (New York: McGraw-Hill,
1977).
37.Federal Register/Vol. 79, No. 180/Wednesday, September
17, 2014/Proposed Rules. Department of Labor, Office of
Federal Contract Compliance Programs, 41 CFR Part 60–1 RIN
1250–AA06. Government Contractors, Prohibitions Against Pay
Secrecy Policies and Actions. Notice of proposed rulemaking.
38.Thomas A. Mahoney and William Weitzel, “Secrecy and
Managerial Compensation,” Industrial Relations 17(2), 1978,
pp. 245–251; Julio D. Burroughs, “Pay Secrecy and
Performance: The Psychological Research,” Compensation
Review, Third Quarter 1982, pp. 44–54; George Milkovich and
P. H. Anderson, “Management Compensation and Secrecy
Policies,” Personnel Psychology 25 (1972), pp. 293–302.
39.Adrienne Colella, Ramona Paetzold, Asghar Zardkoohi, and
Michael Wesson, “Exposing Pay Secrecy,” Academy of
Management Review 32 (2007), pp. 55–71; Renae Broderick
and Barry Gerhart, “Non-Wage Compensation,” in The Human
Resource Management Handbook, Part 3; David Lewin, Daniel
J. B. Mitchell, and Mahmood A. Zaidi, eds. (Greenwich, CT:
JAI Press, 1997), pp. 95–135.
40.P. Bamberger and E. Belogolovsky, “The Impact of Pay
Secrecy on Individual Task Performance,” Personnel
Psychology63, 2010, pp. 965–966.
41.Card, David, et al., “Inequality at Work: The Effect of Peer
Salaries on Job Satisfaction,” The American Economic
Review102(6), (2012): 2981–3003.
42.Belogolovsky, Elena, and Peter A. Bamberger, “Signaling in
Secret: Pay for Performance and the Incentive and Sorting
Effects of Pay Secrecy,” Academy of Management
Journal 57(6), (2014): 1706–1733.
43.M. Wilson, G. B. Northcraft, and M. A. Neale, “The
Perceived Value of Fringe Benefits,” Personnel Psychology 38
(1985), pp. 309–320.
44.John A. Rubino, Communicating Compensation
Programs (Scottsdale, AZ: American Compensation Association,
1997).
45.Jared Sandberg, “Why You May Regret Looking at Papers
Left on the Office Copier,” The Wall Street Journal, June 20,
2006, p. B1; John Case, “When Salaries Aren’t Secret,” case
study, Harvard Business Review, May 2001.
46.A. Tversky and D. Kahneman, “The Framing of Decisions
and the Psychology of Choice,” Science 211 (1981), pp. 453–
458; C. F. Camerer and U. Malmendier, “Behavioral
Organizational Economics,” July 8, 2006, working paper
available
from www.hss.caltech.edu/camerer/SS200/SS200.html; Sharla
A. Stewart, “Can Behavioral Economics Save Us From
Ourselves?” University of Chicago Magazine 97(3), February
2005, www.magazine.uchicago.edu/0502/features/economics.sht
ml.
700
47.Dori Meinert, “An Open Book: Involving Employees in
Business Decisions Can Improve the Bottom Line. That’s Why
Fans of Open-Book Management Are So Dedicated to the
Approach,” HR Magazine, April 2013, pp. 43–46. “Rethinking
Ways to Present Financial Information to
Employees,” Employee Ownership Report, March/April 2000,
pp. 7, 10; Jack Stack and Bo Burlingham, The Great Game of
Business (New York: Currency Doubleday, 1992); Jack Stack
and Bo Burlingham, A Stake in the Outcome (New York:
Currency Doubleday, 2002); John Case, “Opening the
Books,” Harvard Business Review, March–April, 1996, pp.
118–127.
48.HR Services Delivery Research Report, Towers Perrin,
2005, www.towersperrin.com; “The Psychology of Change
Management,” McKinsey Quarterly, July 2006.
49.Dave Ulrich, Jon Younger, and Wayne Brockbank, “The
Next Evolution of the HR Organization,” in The Routledge
Companion to Strategic Human Resource Management, John
Storey, Patrick M. Wright, and Dave Ulrich, eds. (London and
New York: Routledge, 2009), pp. 182–203.
50.Alexandria Sage, “Wal-Mart Sex Discrimination Case Back
in Court,” Reuters, March 25,
2009, www.reuters.com/article/topNews/idUSTRE52O0P820090
325.
51.Stephen Miller, “Companies Continue to Selectively
Outsource HR Programs,” HRMagazine (2009), p. 76; Dave
Ulrich and Wayne Brockbank, The HR Value
Proposition (Boston, MA: Harvard Business School Press,
2005); Brian S. Klaas, “Outsourcing and the HR Function: An
Examination of Trends and Developments Within North
American Firms,” International Journal of Human Resource
Management 19 (2008), pp. 1500–1514.
52.Michael Skapinker, “Much to Question on
Outsourcing,” Financial Times, June 30, 2003, p. 4.
53.A useful guide on selecting HR software is James G.
Meade, The Human Resources Software Handbook (San
Francisco: Jossey-Bass/Pfeiffer, 2003); Mark L. Lengnick-Hall
and Steve Moritz, “The Impact of e-HR on the Human Resource
Management Function,” Journal of Labor Research, Summer
2003, pp. 365–379.
54.Diane Palframan, HR Technology Strategies (New York:
Conference Board, 2003); James H. Dulebohn and Janet H.
Marler, “e-Compensation: The Potential to Transform
Practice?” in Brave New World of e-HR: Human Resources in
the Digital Age, H. Gueutal and D. Stone, eds. (San Francisco:
Jossey Bass, 2005), pp. 138–165.
55.Privacilla, www.privacilla.org/business/eudirective.html.
56.Flora Guidry, Andrew J. Leon, and Steve Rock, “Earnings-
Based Bonus Plans and Earnings Management by Business-Unit
Managers,” Journal of Accounting and Economics 26 (1999),
pp. 113–142.
57.Joseph P. O’Connor, Jr., Richard L. Priem, Joseph E.
Coombs, and K. Matthew Gilley, “Do CEO Stock Options
Prevent or Promote Fraudulent Financial Reporting?” Academy
of Management Journal, June 2006, pp. 483–500; Frederic W.
Cook, “Compensation Ethics: An Oxymoron or Valid Area for
Debate?” Featured speech at ACA International Conference
Workshop, 1999; Barrie Litzky, Kimberly Eddleston, and
Deborah Kidder, “The Good, the Bad, and the Misguided: How
Managers Inadvertently Encourage Deviant
Behaviors,” Academy of Management Perspectives, February
2006, pp. 91–102; Gretchen Morgenson, “Advice on Boss’s Pay
May Not Be So Independent,”The New York Times, April 10,
2006, p. B1. The WorldatWork Ethics Initiative is described on
their website, www.worldatwork.org. Also see their
WorldatWork Standards of Professional Practice.
701
58.John Hechinger and James Bandler, “In Sycamore Suite,
Memo Points to Backdating Claims,” The Wall Street Journal,
July 12, 2006, p. A3. Also see C. Forelle, J. Bandler, and Steve
Stecklaw, “Brocade Ex-CEO, 2 Others Charged in Options
Probe,” The Wall Street Journal, July 21, 2006, p. A1, A8; Peter
Grant, James Bandler, and Charles Forelle, “Cablevision Gave
Backdated Grant to Dead Official,” The Wall Street Journal,
September 22, 2006, pp. A1, A8; Della Bradshaw, “MBA
Students ‘Cheat the Most,’” Financial Times, September 21,
2006, p. 8.
Key figuresDeutsche Post AG - Interim Report as at 30 June
2017Selected key figuresH1 2016H1 2017+/- %Q2 2016Q2
2017+/- %Revenue€m28,06229,6965.814,19014,8134.4Profit
from operating activities
(EBIT)€m1,6251,7266.275284111.8Return on sales1%5.85.8-
5.35.7-EBIT after asset charge
(EAC)€m8569328.936644521.6Consolidated net profit for the
period2€m1,1801,2354.754160211.3Free cash flow€m-1,300-
4596.5-600385>100Net debt3€m2,2613,57558.1---Earnings per
share4€0.981.024.10.450.5011.1Number of
employees5508,036508,9280.2---1 EBIT/revenue.2 After
deduction of non-controlling interests.3 Prior-period amount as
at 31 December, for the calculation see page 6 of the Interim
Group Management Report.4 Basic earnings per share.5
Headcount at the end of the first half of the year, including
trainees; prior-period amount as at 31 December.
Key figures
Revenue (€m)
Time (FY)
Amount(€m)
Revenue (€m) for DHL
1
Research Analysis for Business – The Logistics Business
Environment In US
7
Research Analysis for Business – The Logistics Business
Environment In US
Chapter EighteenManagement Making It WorkChapter OutlineMan.docx

More Related Content

Similar to Chapter EighteenManagement Making It WorkChapter OutlineMan.docx

Strategic Remuneration - Using remuneration to enhance performance
Strategic Remuneration - Using remuneration to enhance performanceStrategic Remuneration - Using remuneration to enhance performance
Strategic Remuneration - Using remuneration to enhance performanceGeorge Vorster
 
compensation.ppt
compensation.pptcompensation.ppt
compensation.pptAnoop Gupta
 
9 Salary Surveys A Snapshot Market data obtained from salary surv.docx
9 Salary Surveys A Snapshot Market data obtained from salary surv.docx9 Salary Surveys A Snapshot Market data obtained from salary surv.docx
9 Salary Surveys A Snapshot Market data obtained from salary surv.docxsleeperharwell
 
TT White Paper Series - Revealing the Hidden Costs of Turnover
TT White Paper Series - Revealing the Hidden Costs of TurnoverTT White Paper Series - Revealing the Hidden Costs of Turnover
TT White Paper Series - Revealing the Hidden Costs of TurnoverCynthia Howells
 
Compensation
CompensationCompensation
Compensationssp045
 
Compensation
CompensationCompensation
CompensationICAB
 
Running head CASE STUDY 31CASE STUDY 31AbstractThe hu.docx
Running head CASE STUDY 31CASE STUDY 31AbstractThe hu.docxRunning head CASE STUDY 31CASE STUDY 31AbstractThe hu.docx
Running head CASE STUDY 31CASE STUDY 31AbstractThe hu.docxhealdkathaleen
 
What causes differences in compensation between employees
What causes differences in compensation between employeesWhat causes differences in compensation between employees
What causes differences in compensation between employeesGodioRK
 
Introduction1but the focus in this chapter is pay. they al.docx
Introduction1but the focus in this chapter is pay. they al.docxIntroduction1but the focus in this chapter is pay. they al.docx
Introduction1but the focus in this chapter is pay. they al.docxmariuse18nolet
 
Compensation management unit 1
Compensation management unit 1Compensation management unit 1
Compensation management unit 104221989
 
Compensation management
Compensation managementCompensation management
Compensation managementGia Tri Tien
 
Compensation Management
Compensation ManagementCompensation Management
Compensation ManagementFarhan Akhtar
 
Megalith Casestudy
Megalith CasestudyMegalith Casestudy
Megalith CasestudyOsama Mir
 

Similar to Chapter EighteenManagement Making It WorkChapter OutlineMan.docx (20)

Strategic Remuneration - Using remuneration to enhance performance
Strategic Remuneration - Using remuneration to enhance performanceStrategic Remuneration - Using remuneration to enhance performance
Strategic Remuneration - Using remuneration to enhance performance
 
compensation.ppt
compensation.pptcompensation.ppt
compensation.ppt
 
Compensation report
Compensation reportCompensation report
Compensation report
 
9 Salary Surveys A Snapshot Market data obtained from salary surv.docx
9 Salary Surveys A Snapshot Market data obtained from salary surv.docx9 Salary Surveys A Snapshot Market data obtained from salary surv.docx
9 Salary Surveys A Snapshot Market data obtained from salary surv.docx
 
Bases for traditional pay system & modern pay system and establishing pay plans
Bases for traditional pay system & modern pay system and establishing pay plans Bases for traditional pay system & modern pay system and establishing pay plans
Bases for traditional pay system & modern pay system and establishing pay plans
 
Siva0088
Siva0088Siva0088
Siva0088
 
TT White Paper Series - Revealing the Hidden Costs of Turnover
TT White Paper Series - Revealing the Hidden Costs of TurnoverTT White Paper Series - Revealing the Hidden Costs of Turnover
TT White Paper Series - Revealing the Hidden Costs of Turnover
 
Compensation
CompensationCompensation
Compensation
 
Compensation
CompensationCompensation
Compensation
 
Employee Compensation
Employee CompensationEmployee Compensation
Employee Compensation
 
Reward
RewardReward
Reward
 
Running head CASE STUDY 31CASE STUDY 31AbstractThe hu.docx
Running head CASE STUDY 31CASE STUDY 31AbstractThe hu.docxRunning head CASE STUDY 31CASE STUDY 31AbstractThe hu.docx
Running head CASE STUDY 31CASE STUDY 31AbstractThe hu.docx
 
What causes differences in compensation between employees
What causes differences in compensation between employeesWhat causes differences in compensation between employees
What causes differences in compensation between employees
 
Introduction1but the focus in this chapter is pay. they al.docx
Introduction1but the focus in this chapter is pay. they al.docxIntroduction1but the focus in this chapter is pay. they al.docx
Introduction1but the focus in this chapter is pay. they al.docx
 
Gp9 ch19 final
Gp9 ch19 finalGp9 ch19 final
Gp9 ch19 final
 
Chapter 11 and 12 to send
Chapter 11 and 12 to sendChapter 11 and 12 to send
Chapter 11 and 12 to send
 
Compensation management unit 1
Compensation management unit 1Compensation management unit 1
Compensation management unit 1
 
Compensation management
Compensation managementCompensation management
Compensation management
 
Compensation Management
Compensation ManagementCompensation Management
Compensation Management
 
Megalith Casestudy
Megalith CasestudyMegalith Casestudy
Megalith Casestudy
 

More from christinemaritza

ENG315                                    Professional Scenari.docx
ENG315                                    Professional Scenari.docxENG315                                    Professional Scenari.docx
ENG315                                    Professional Scenari.docxchristinemaritza
 
ENG122 – Research Paper Peer Review InstructionsApply each of .docx
ENG122 – Research Paper Peer Review InstructionsApply each of .docxENG122 – Research Paper Peer Review InstructionsApply each of .docx
ENG122 – Research Paper Peer Review InstructionsApply each of .docxchristinemaritza
 
ENG122 – Research Paper Peer Review InstructionsApply each of th.docx
ENG122 – Research Paper Peer Review InstructionsApply each of th.docxENG122 – Research Paper Peer Review InstructionsApply each of th.docx
ENG122 – Research Paper Peer Review InstructionsApply each of th.docxchristinemaritza
 
ENG115ASSIGNMENT2STANCEESSAYDRAFTDueWeek.docx
ENG115ASSIGNMENT2STANCEESSAYDRAFTDueWeek.docxENG115ASSIGNMENT2STANCEESSAYDRAFTDueWeek.docx
ENG115ASSIGNMENT2STANCEESSAYDRAFTDueWeek.docxchristinemaritza
 
ENG 510 Final Project Milestone Three Guidelines and Rubric .docx
ENG 510 Final Project Milestone Three Guidelines and Rubric .docxENG 510 Final Project Milestone Three Guidelines and Rubric .docx
ENG 510 Final Project Milestone Three Guidelines and Rubric .docxchristinemaritza
 
ENG-105 Peer Review Worksheet Rhetorical Analysis of a Public.docx
ENG-105 Peer Review Worksheet Rhetorical Analysis of a Public.docxENG-105 Peer Review Worksheet Rhetorical Analysis of a Public.docx
ENG-105 Peer Review Worksheet Rhetorical Analysis of a Public.docxchristinemaritza
 
ENG 272-0Objective The purpose of this essay is t.docx
ENG 272-0Objective  The purpose of this essay is t.docxENG 272-0Objective  The purpose of this essay is t.docx
ENG 272-0Objective The purpose of this essay is t.docxchristinemaritza
 
ENG 360 01 American PoetrySpring 2019TuesdayFriday 800 –.docx
ENG 360 01 American PoetrySpring 2019TuesdayFriday 800 –.docxENG 360 01 American PoetrySpring 2019TuesdayFriday 800 –.docx
ENG 360 01 American PoetrySpring 2019TuesdayFriday 800 –.docxchristinemaritza
 
ENG 4034AHamlet Final AssessmentDUE DATE WEDNESDAY, 1220, 1.docx
ENG 4034AHamlet Final AssessmentDUE DATE WEDNESDAY, 1220, 1.docxENG 4034AHamlet Final AssessmentDUE DATE WEDNESDAY, 1220, 1.docx
ENG 4034AHamlet Final AssessmentDUE DATE WEDNESDAY, 1220, 1.docxchristinemaritza
 
ENG 3107 Writing for the Professions—Business & Social Scienc.docx
ENG 3107 Writing for the Professions—Business & Social Scienc.docxENG 3107 Writing for the Professions—Business & Social Scienc.docx
ENG 3107 Writing for the Professions—Business & Social Scienc.docxchristinemaritza
 
ENG 271Plato and Aristotlea Classical Greek philosophe.docx
ENG 271Plato and Aristotlea Classical Greek philosophe.docxENG 271Plato and Aristotlea Classical Greek philosophe.docx
ENG 271Plato and Aristotlea Classical Greek philosophe.docxchristinemaritza
 
ENG 315 Professional Communication Week 4 Discussion Deliver.docx
ENG 315 Professional Communication Week 4 Discussion Deliver.docxENG 315 Professional Communication Week 4 Discussion Deliver.docx
ENG 315 Professional Communication Week 4 Discussion Deliver.docxchristinemaritza
 
ENG 315 Professional Communication Week 9Professional Exp.docx
ENG 315 Professional Communication Week 9Professional Exp.docxENG 315 Professional Communication Week 9Professional Exp.docx
ENG 315 Professional Communication Week 9Professional Exp.docxchristinemaritza
 
ENG 202 Questions about Point of View in Ursula K. Le Guin’s .docx
ENG 202 Questions about Point of View in Ursula K. Le Guin’s .docxENG 202 Questions about Point of View in Ursula K. Le Guin’s .docx
ENG 202 Questions about Point of View in Ursula K. Le Guin’s .docxchristinemaritza
 
ENG 220250 Lab Report Requirements Version 0.8 -- 0813201.docx
ENG 220250 Lab Report Requirements Version 0.8 -- 0813201.docxENG 220250 Lab Report Requirements Version 0.8 -- 0813201.docx
ENG 220250 Lab Report Requirements Version 0.8 -- 0813201.docxchristinemaritza
 
ENG 203 Short Article Response 2 Sample Answer (Worth 13 mark.docx
ENG 203 Short Article Response 2 Sample Answer (Worth 13 mark.docxENG 203 Short Article Response 2 Sample Answer (Worth 13 mark.docx
ENG 203 Short Article Response 2 Sample Answer (Worth 13 mark.docxchristinemaritza
 
ENG 130 Literature and Comp ENG 130 Argumentative Resear.docx
ENG 130 Literature and Comp ENG 130 Argumentative Resear.docxENG 130 Literature and Comp ENG 130 Argumentative Resear.docx
ENG 130 Literature and Comp ENG 130 Argumentative Resear.docxchristinemaritza
 
ENG 132What’s Wrong With HoldenHere’s What You Should Do, .docx
ENG 132What’s Wrong With HoldenHere’s What You Should Do, .docxENG 132What’s Wrong With HoldenHere’s What You Should Do, .docx
ENG 132What’s Wrong With HoldenHere’s What You Should Do, .docxchristinemaritza
 
ENG 130- Literature and Comp Literary Response for Setting.docx
ENG 130- Literature and Comp Literary Response for Setting.docxENG 130- Literature and Comp Literary Response for Setting.docx
ENG 130- Literature and Comp Literary Response for Setting.docxchristinemaritza
 
ENG 130 Literature and Comp Literary Response for Point o.docx
ENG 130 Literature and Comp Literary Response for Point o.docxENG 130 Literature and Comp Literary Response for Point o.docx
ENG 130 Literature and Comp Literary Response for Point o.docxchristinemaritza
 

More from christinemaritza (20)

ENG315                                    Professional Scenari.docx
ENG315                                    Professional Scenari.docxENG315                                    Professional Scenari.docx
ENG315                                    Professional Scenari.docx
 
ENG122 – Research Paper Peer Review InstructionsApply each of .docx
ENG122 – Research Paper Peer Review InstructionsApply each of .docxENG122 – Research Paper Peer Review InstructionsApply each of .docx
ENG122 – Research Paper Peer Review InstructionsApply each of .docx
 
ENG122 – Research Paper Peer Review InstructionsApply each of th.docx
ENG122 – Research Paper Peer Review InstructionsApply each of th.docxENG122 – Research Paper Peer Review InstructionsApply each of th.docx
ENG122 – Research Paper Peer Review InstructionsApply each of th.docx
 
ENG115ASSIGNMENT2STANCEESSAYDRAFTDueWeek.docx
ENG115ASSIGNMENT2STANCEESSAYDRAFTDueWeek.docxENG115ASSIGNMENT2STANCEESSAYDRAFTDueWeek.docx
ENG115ASSIGNMENT2STANCEESSAYDRAFTDueWeek.docx
 
ENG 510 Final Project Milestone Three Guidelines and Rubric .docx
ENG 510 Final Project Milestone Three Guidelines and Rubric .docxENG 510 Final Project Milestone Three Guidelines and Rubric .docx
ENG 510 Final Project Milestone Three Guidelines and Rubric .docx
 
ENG-105 Peer Review Worksheet Rhetorical Analysis of a Public.docx
ENG-105 Peer Review Worksheet Rhetorical Analysis of a Public.docxENG-105 Peer Review Worksheet Rhetorical Analysis of a Public.docx
ENG-105 Peer Review Worksheet Rhetorical Analysis of a Public.docx
 
ENG 272-0Objective The purpose of this essay is t.docx
ENG 272-0Objective  The purpose of this essay is t.docxENG 272-0Objective  The purpose of this essay is t.docx
ENG 272-0Objective The purpose of this essay is t.docx
 
ENG 360 01 American PoetrySpring 2019TuesdayFriday 800 –.docx
ENG 360 01 American PoetrySpring 2019TuesdayFriday 800 –.docxENG 360 01 American PoetrySpring 2019TuesdayFriday 800 –.docx
ENG 360 01 American PoetrySpring 2019TuesdayFriday 800 –.docx
 
ENG 4034AHamlet Final AssessmentDUE DATE WEDNESDAY, 1220, 1.docx
ENG 4034AHamlet Final AssessmentDUE DATE WEDNESDAY, 1220, 1.docxENG 4034AHamlet Final AssessmentDUE DATE WEDNESDAY, 1220, 1.docx
ENG 4034AHamlet Final AssessmentDUE DATE WEDNESDAY, 1220, 1.docx
 
ENG 3107 Writing for the Professions—Business & Social Scienc.docx
ENG 3107 Writing for the Professions—Business & Social Scienc.docxENG 3107 Writing for the Professions—Business & Social Scienc.docx
ENG 3107 Writing for the Professions—Business & Social Scienc.docx
 
ENG 271Plato and Aristotlea Classical Greek philosophe.docx
ENG 271Plato and Aristotlea Classical Greek philosophe.docxENG 271Plato and Aristotlea Classical Greek philosophe.docx
ENG 271Plato and Aristotlea Classical Greek philosophe.docx
 
ENG 315 Professional Communication Week 4 Discussion Deliver.docx
ENG 315 Professional Communication Week 4 Discussion Deliver.docxENG 315 Professional Communication Week 4 Discussion Deliver.docx
ENG 315 Professional Communication Week 4 Discussion Deliver.docx
 
ENG 315 Professional Communication Week 9Professional Exp.docx
ENG 315 Professional Communication Week 9Professional Exp.docxENG 315 Professional Communication Week 9Professional Exp.docx
ENG 315 Professional Communication Week 9Professional Exp.docx
 
ENG 202 Questions about Point of View in Ursula K. Le Guin’s .docx
ENG 202 Questions about Point of View in Ursula K. Le Guin’s .docxENG 202 Questions about Point of View in Ursula K. Le Guin’s .docx
ENG 202 Questions about Point of View in Ursula K. Le Guin’s .docx
 
ENG 220250 Lab Report Requirements Version 0.8 -- 0813201.docx
ENG 220250 Lab Report Requirements Version 0.8 -- 0813201.docxENG 220250 Lab Report Requirements Version 0.8 -- 0813201.docx
ENG 220250 Lab Report Requirements Version 0.8 -- 0813201.docx
 
ENG 203 Short Article Response 2 Sample Answer (Worth 13 mark.docx
ENG 203 Short Article Response 2 Sample Answer (Worth 13 mark.docxENG 203 Short Article Response 2 Sample Answer (Worth 13 mark.docx
ENG 203 Short Article Response 2 Sample Answer (Worth 13 mark.docx
 
ENG 130 Literature and Comp ENG 130 Argumentative Resear.docx
ENG 130 Literature and Comp ENG 130 Argumentative Resear.docxENG 130 Literature and Comp ENG 130 Argumentative Resear.docx
ENG 130 Literature and Comp ENG 130 Argumentative Resear.docx
 
ENG 132What’s Wrong With HoldenHere’s What You Should Do, .docx
ENG 132What’s Wrong With HoldenHere’s What You Should Do, .docxENG 132What’s Wrong With HoldenHere’s What You Should Do, .docx
ENG 132What’s Wrong With HoldenHere’s What You Should Do, .docx
 
ENG 130- Literature and Comp Literary Response for Setting.docx
ENG 130- Literature and Comp Literary Response for Setting.docxENG 130- Literature and Comp Literary Response for Setting.docx
ENG 130- Literature and Comp Literary Response for Setting.docx
 
ENG 130 Literature and Comp Literary Response for Point o.docx
ENG 130 Literature and Comp Literary Response for Point o.docxENG 130 Literature and Comp Literary Response for Point o.docx
ENG 130 Literature and Comp Literary Response for Point o.docx
 

Recently uploaded

Employee wellbeing at the workplace.pptx
Employee wellbeing at the workplace.pptxEmployee wellbeing at the workplace.pptx
Employee wellbeing at the workplace.pptxNirmalaLoungPoorunde1
 
Introduction to ArtificiaI Intelligence in Higher Education
Introduction to ArtificiaI Intelligence in Higher EducationIntroduction to ArtificiaI Intelligence in Higher Education
Introduction to ArtificiaI Intelligence in Higher Educationpboyjonauth
 
Software Engineering Methodologies (overview)
Software Engineering Methodologies (overview)Software Engineering Methodologies (overview)
Software Engineering Methodologies (overview)eniolaolutunde
 
Painted Grey Ware.pptx, PGW Culture of India
Painted Grey Ware.pptx, PGW Culture of IndiaPainted Grey Ware.pptx, PGW Culture of India
Painted Grey Ware.pptx, PGW Culture of IndiaVirag Sontakke
 
CARE OF CHILD IN INCUBATOR..........pptx
CARE OF CHILD IN INCUBATOR..........pptxCARE OF CHILD IN INCUBATOR..........pptx
CARE OF CHILD IN INCUBATOR..........pptxGaneshChakor2
 
Biting mechanism of poisonous snakes.pdf
Biting mechanism of poisonous snakes.pdfBiting mechanism of poisonous snakes.pdf
Biting mechanism of poisonous snakes.pdfadityarao40181
 
A Critique of the Proposed National Education Policy Reform
A Critique of the Proposed National Education Policy ReformA Critique of the Proposed National Education Policy Reform
A Critique of the Proposed National Education Policy ReformChameera Dedduwage
 
Enzyme, Pharmaceutical Aids, Miscellaneous Last Part of Chapter no 5th.pdf
Enzyme, Pharmaceutical Aids, Miscellaneous Last Part of Chapter no 5th.pdfEnzyme, Pharmaceutical Aids, Miscellaneous Last Part of Chapter no 5th.pdf
Enzyme, Pharmaceutical Aids, Miscellaneous Last Part of Chapter no 5th.pdfSumit Tiwari
 
Paris 2024 Olympic Geographies - an activity
Paris 2024 Olympic Geographies - an activityParis 2024 Olympic Geographies - an activity
Paris 2024 Olympic Geographies - an activityGeoBlogs
 
Solving Puzzles Benefits Everyone (English).pptx
Solving Puzzles Benefits Everyone (English).pptxSolving Puzzles Benefits Everyone (English).pptx
Solving Puzzles Benefits Everyone (English).pptxOH TEIK BIN
 
ECONOMIC CONTEXT - LONG FORM TV DRAMA - PPT
ECONOMIC CONTEXT - LONG FORM TV DRAMA - PPTECONOMIC CONTEXT - LONG FORM TV DRAMA - PPT
ECONOMIC CONTEXT - LONG FORM TV DRAMA - PPTiammrhaywood
 
How to Configure Email Server in Odoo 17
How to Configure Email Server in Odoo 17How to Configure Email Server in Odoo 17
How to Configure Email Server in Odoo 17Celine George
 
History Class XII Ch. 3 Kinship, Caste and Class (1).pptx
History Class XII Ch. 3 Kinship, Caste and Class (1).pptxHistory Class XII Ch. 3 Kinship, Caste and Class (1).pptx
History Class XII Ch. 3 Kinship, Caste and Class (1).pptxsocialsciencegdgrohi
 
Class 11 Legal Studies Ch-1 Concept of State .pdf
Class 11 Legal Studies Ch-1 Concept of State .pdfClass 11 Legal Studies Ch-1 Concept of State .pdf
Class 11 Legal Studies Ch-1 Concept of State .pdfakmcokerachita
 
Science lesson Moon for 4th quarter lesson
Science lesson Moon for 4th quarter lessonScience lesson Moon for 4th quarter lesson
Science lesson Moon for 4th quarter lessonJericReyAuditor
 
SOCIAL AND HISTORICAL CONTEXT - LFTVD.pptx
SOCIAL AND HISTORICAL CONTEXT - LFTVD.pptxSOCIAL AND HISTORICAL CONTEXT - LFTVD.pptx
SOCIAL AND HISTORICAL CONTEXT - LFTVD.pptxiammrhaywood
 
Crayon Activity Handout For the Crayon A
Crayon Activity Handout For the Crayon ACrayon Activity Handout For the Crayon A
Crayon Activity Handout For the Crayon AUnboundStockton
 
Blooming Together_ Growing a Community Garden Worksheet.docx
Blooming Together_ Growing a Community Garden Worksheet.docxBlooming Together_ Growing a Community Garden Worksheet.docx
Blooming Together_ Growing a Community Garden Worksheet.docxUnboundStockton
 

Recently uploaded (20)

Employee wellbeing at the workplace.pptx
Employee wellbeing at the workplace.pptxEmployee wellbeing at the workplace.pptx
Employee wellbeing at the workplace.pptx
 
Introduction to ArtificiaI Intelligence in Higher Education
Introduction to ArtificiaI Intelligence in Higher EducationIntroduction to ArtificiaI Intelligence in Higher Education
Introduction to ArtificiaI Intelligence in Higher Education
 
Software Engineering Methodologies (overview)
Software Engineering Methodologies (overview)Software Engineering Methodologies (overview)
Software Engineering Methodologies (overview)
 
Painted Grey Ware.pptx, PGW Culture of India
Painted Grey Ware.pptx, PGW Culture of IndiaPainted Grey Ware.pptx, PGW Culture of India
Painted Grey Ware.pptx, PGW Culture of India
 
CARE OF CHILD IN INCUBATOR..........pptx
CARE OF CHILD IN INCUBATOR..........pptxCARE OF CHILD IN INCUBATOR..........pptx
CARE OF CHILD IN INCUBATOR..........pptx
 
Biting mechanism of poisonous snakes.pdf
Biting mechanism of poisonous snakes.pdfBiting mechanism of poisonous snakes.pdf
Biting mechanism of poisonous snakes.pdf
 
A Critique of the Proposed National Education Policy Reform
A Critique of the Proposed National Education Policy ReformA Critique of the Proposed National Education Policy Reform
A Critique of the Proposed National Education Policy Reform
 
Enzyme, Pharmaceutical Aids, Miscellaneous Last Part of Chapter no 5th.pdf
Enzyme, Pharmaceutical Aids, Miscellaneous Last Part of Chapter no 5th.pdfEnzyme, Pharmaceutical Aids, Miscellaneous Last Part of Chapter no 5th.pdf
Enzyme, Pharmaceutical Aids, Miscellaneous Last Part of Chapter no 5th.pdf
 
Paris 2024 Olympic Geographies - an activity
Paris 2024 Olympic Geographies - an activityParis 2024 Olympic Geographies - an activity
Paris 2024 Olympic Geographies - an activity
 
Solving Puzzles Benefits Everyone (English).pptx
Solving Puzzles Benefits Everyone (English).pptxSolving Puzzles Benefits Everyone (English).pptx
Solving Puzzles Benefits Everyone (English).pptx
 
Model Call Girl in Tilak Nagar Delhi reach out to us at 🔝9953056974🔝
Model Call Girl in Tilak Nagar Delhi reach out to us at 🔝9953056974🔝Model Call Girl in Tilak Nagar Delhi reach out to us at 🔝9953056974🔝
Model Call Girl in Tilak Nagar Delhi reach out to us at 🔝9953056974🔝
 
Model Call Girl in Bikash Puri Delhi reach out to us at 🔝9953056974🔝
Model Call Girl in Bikash Puri  Delhi reach out to us at 🔝9953056974🔝Model Call Girl in Bikash Puri  Delhi reach out to us at 🔝9953056974🔝
Model Call Girl in Bikash Puri Delhi reach out to us at 🔝9953056974🔝
 
ECONOMIC CONTEXT - LONG FORM TV DRAMA - PPT
ECONOMIC CONTEXT - LONG FORM TV DRAMA - PPTECONOMIC CONTEXT - LONG FORM TV DRAMA - PPT
ECONOMIC CONTEXT - LONG FORM TV DRAMA - PPT
 
How to Configure Email Server in Odoo 17
How to Configure Email Server in Odoo 17How to Configure Email Server in Odoo 17
How to Configure Email Server in Odoo 17
 
History Class XII Ch. 3 Kinship, Caste and Class (1).pptx
History Class XII Ch. 3 Kinship, Caste and Class (1).pptxHistory Class XII Ch. 3 Kinship, Caste and Class (1).pptx
History Class XII Ch. 3 Kinship, Caste and Class (1).pptx
 
Class 11 Legal Studies Ch-1 Concept of State .pdf
Class 11 Legal Studies Ch-1 Concept of State .pdfClass 11 Legal Studies Ch-1 Concept of State .pdf
Class 11 Legal Studies Ch-1 Concept of State .pdf
 
Science lesson Moon for 4th quarter lesson
Science lesson Moon for 4th quarter lessonScience lesson Moon for 4th quarter lesson
Science lesson Moon for 4th quarter lesson
 
SOCIAL AND HISTORICAL CONTEXT - LFTVD.pptx
SOCIAL AND HISTORICAL CONTEXT - LFTVD.pptxSOCIAL AND HISTORICAL CONTEXT - LFTVD.pptx
SOCIAL AND HISTORICAL CONTEXT - LFTVD.pptx
 
Crayon Activity Handout For the Crayon A
Crayon Activity Handout For the Crayon ACrayon Activity Handout For the Crayon A
Crayon Activity Handout For the Crayon A
 
Blooming Together_ Growing a Community Garden Worksheet.docx
Blooming Together_ Growing a Community Garden Worksheet.docxBlooming Together_ Growing a Community Garden Worksheet.docx
Blooming Together_ Growing a Community Garden Worksheet.docx
 

Chapter EighteenManagement Making It WorkChapter OutlineMan.docx

  • 1. Chapter Eighteen Management: Making It Work Chapter Outline Managing Labor Costs and Revenues Managing Labor Costs Number of Employees (a.k.a.: Staffing Levels or Headcount) Hours Benefits Average Cash Compensation (Fixed and Variable Components) Budget Controls: Top Down Budget Controls: Bottom Up Embedded (Design) Controls Managing Revenues Using Compensation to Retain (and Recruit) Top Employees Managing Pay to Support Strategy and Change Communication: Managing the Message Say What? (Or, What to Say?) Opening the Books Structuring the Compensation Function and Its Roles Centralization–Decentralization (and/or Outsourcing) Ethics: Managing or Manipulating? Your Turn: Communication by Copier Still Your Turn: Managing Compensation Costs, Headcount, and Participation/Communication Issues This chapter is about making it work: ensuring that the right people get the right pay for achieving the right objectives in the right way. The greatest pay system design in the world is useless without competent management. So why bother with a formal system at all? If management is that important, why not simply let every manager pay whatever works best? Such total decentralization of decision making could create a chaotic array of rates. Managers could use pay to motivate behaviors that achieved their own immediate objectives, not necessarily those of the organization. Employees could be treated inconsistently
  • 2. and unfairly. This was the situation in the United States in the early 1900s. The “contract system” made highly skilled workers managers as well as workers. The employer agreed to provide the “contractor” with floor space, light, power, and the necessary 666 raw or semifinished materials. The contractor hired and paid labor.1 Pay inconsistencies for the same work were common. Some contractors demanded kickbacks from employees’ paychecks; many hired their relatives and friends. Dissatisfaction and grievances were widespread, eventually resulting in legislation that outlawed the arrangement. Corruption and financial malfeasance were also part of decentralized decision making in the early 1900s. Some see parallels today. To help avoid history repeating itself and to redeem HR (and compensation) vice presidents from the image of unindicted coconspirators, the compensation system should be managed to achieve the objectives in the pay model: efficiency, fairness, and compliance. Any discussion of managing pay must again raise the basic questions: So what is the impact of the decision or technique? Does it help the organization achieve its objectives? How? Although many pay management issues have been discussed throughout the book, a few remain to be called out explicitly. These include (1) managing labor costs, (2) managing revenues, (3) communication, and (4) designing the compensation department. MANAGING LABOR COSTS AND REVENUES Financial planning is integral to managing compensation. As we noted in Chapter 1, compensation decisions influence organization’s performance by influencing costs and/or revenues. The cost implications of actions such as updating the pay structure, increasing merit pay, or instituting gain sharing are critical for making sound decisions. Budgets account for these costs. Creating a compensation budget requires tradeoffs, such as how much of an increase should be allocated according
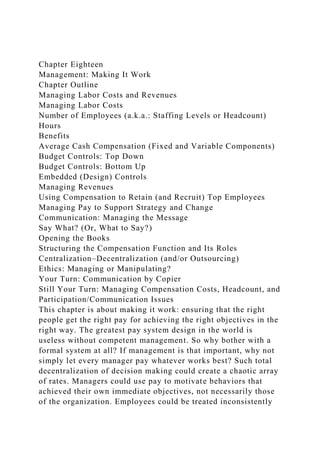
  • 3. to employee contributions versus across-the-board increases versus company performance. Tradeoffs also occur over short- versus long-term incentives, over pay increases contingent on performance versus seniority, and over cash compensation compared to benefits. Financial planning also requires understanding the revenues (or returns) gained from the allocation.2 Total compensation makes up at least 50 percent of operating expenses in many organizations. Yet, most companies have not tried to analyze the returns from their compensation decisions.3 As we noted in Chapter 2, compensation strategy influences effectiveness not only by its influence on (labor) costs, but through its influence in helping increase revenues or returns as well. Returns might be the productivity increases expected from a new gain-sharing or profit-sharing plan, or the expected value added by boosting merit increases to the top performers.4 In the past, financial planning in compensation was only about costs.5 This is perhaps because costs are tangible and easy to measure, whereas the returns generated by compensation strategy may often be intangible and harder to quantify. It is important to keep in mind, however, that how easy or difficult it is to quantify something has little to do with how important it is. Fortunately, analysis of the expected returns compared to costs is becoming more common.6 More on this later. 667 EXHIBIT 18.1 Managing Labor Costs MANAGING LABOR COSTS You already know many of the factors that affect labor costs. Exhibit 18.1 shows a simple labor cost model. Using this model, there are three main factors to control in order to manage labor costs: employment (e.g., number of workers and the hours they work), average cash compensation (e.g., wages, bonuses), and average benefit costs. Cash compensation and benefits have been this book’s focus. However, if our objective is to better manage labor costs, then all three factors require
  • 4. attention. Number of Employees (a.k.a.: Staffing Levels or Headcount) Using information about competitors’ average pay helps improve understanding of labor costs. Exhibit 18.2A shows how one organization pays its engineers relative to its competitors at each of five job levels, E5–E1. The pay for each position is the cross-hatched bar. Market pay is the shaded bar, with the average falling in the middle of the unshaded part of the bar. So the organization meets competition by paying E5, E3, and E2 engineers at about the median. But the company leads competition at E4 and lags at the entry-level E1. Exhibit 18.2B provides more insight into the organization’s labor costs. This part of the exhibit compares the organization’s distribution of engineers among the five job levels to its competitors’ distributions. A larger percentage of the organization’s engineers are at higher levels, E4 and E5, than its competitors. So even though the organization pays above market for only one of the five job levels, its labor costs may be higher than its competitors due to its staffing pattern. So what? Looking only at total headcount, as suggested in Exhibit 18.1, may mislead since the total employment level 668 EXHIBIT 18.2 Staffing Analysis Identifies Reasons for Pay Variances could be identical to competitors’ but deployment among job levels may vary. Here, the organization differs from its competitors most at E4, where it employs a larger percent of engineering talent and also pays them more. Something is going on at E4. More information is required to better understand what underlies these differences. Are the organization’s engineers more experienced and thus promoted into E4? Does the company do more sophisticated work that requires more experienced engineers? Absent some sound business-related rationale, labor costs can be reduced by redeploying staffing levels and wages at E4.7 Obviously, paying the same wages
  • 5. (e.g., meeting competition) to fewer employees is less expensive. The effects on all pay objectives—efficiency and fairness—also need to be considered before taking any action. 669Reducing Headcount As is apparent from following the business news during any recession, organizations often reduce headcount to cut labor costs. Such cuts may take the form of layoffs (often with severance benefits that depend on length of service) or exit incentives that are designed to encourage employees to leave “by choice.” A major advantage of a reduction in force (RIF) is that it also reduces benefits costs, something that a pay cut, furlough, or reduction in hours ordinarily does not achieve. (An exception would be Lincoln Electric, which has a very lean, low-cost benefits package.) To the degree that headcount reductions can be targeted based on performance, it can also be an opportunity for an organization to reshape its workforce in a way that creates positive sorting effects. Under such a scenario, stronger performers are unaffected (e.g., their pay is not cut) and the organization has an opportunity to maintain good employee relations with this important group. There are, however, several potential problems with headcount reductions. First, regulatory requirements make it difficult to make targeted cuts. The Age Discrimination in Employment Act (ADEA) often comes into play if organizations target reductions among higher paid employees (to maximize labor cost savings) because higher paid employees also tend to be older employees. In addition, the Older Worker Benefits Protection Act, part of the ADEA, requires that exit incentive programs be structured in very specific ways. For example, a program must give workers 40 years old and older 21 days to consider the offer and 7 days to change their mind if they accept the offer. These and other provisions tend to make it difficult to single out high- wage and/or poor-performing workers. If exit incentives cannot be effectively targeted and all employees are eligible, which employees do you think would be most likely to take the incentive and leave? Probably those most employable and most
  • 6. able to find another good job, right? That is indeed what a number of organizations have experienced. Thus, you may end up, in essence, paying your top performers to leave—a very undesirable sorting effect! Second, workforce reductions, especially if not handled well, can harm employee relations. Regulatory restrictions on headcount reductions can be quite stringent outside the United States. (See our discussion of works councils, for example, in Chapter 16.)8 Third, organizations that make greater (involuntary) workforce reductions also experience greater voluntary turnover.9 Fourth, RIFs, while reducing costs over time, are very costly in tangible terms up front due to increases in unemployment insurance tax rates, disruption of work processes and serving customers, and administrative costs of handling exits. Exit incentives, if provided, further drive up costs. Fifth, some companies have learned to run so “lean” (i.e., very few employees on manufacturing lines), and have controlled hiring so successfully, that there may be little room to cut headcount.10 Finally, where cuts can be made, if the cuts are too deep, an organization will be poorly positioned to generate revenue if business picks up again.11 An organization may spend a lot of money reducing headcount and then spend a lot more a short time later to hire new employees to handle increased product demand. If other firms increase hiring at the same time, costs will be even greater. Announcements of layoffs and plant closings often have favorable short-run effects on stock prices as investors anticipate improved cash flow and lower costs. However, in the 670 EXHIBIT 18.3 Core and Contingent Employees longer term, adverse effects such as loss of trained employees, unrealized productivity, and lowered morale often translate into lower financial gains than anticipated. Some evidence indicates that close attention to process and employee relations during workforce reductions can help financial results.12
  • 7. In addition, as we saw in Chapter 17, the regulatory environment differs from country to country. Many European countries have legislation as part of their social contracts that makes it very difficult to reduce headcount or wages. Managing labor costs is a greater struggle in such circumstances. Many employers seek to buffer themselves from getting into a position where layoffs are necessary. As discussed below, use of overtime is part of this strategy. In addition, organizations establish different relationships with different groups of workers. As Exhibit 18.3 depicts, the two groups are commonly referred to as core employees, with whom a long-term relationship is desired, and contingent workers, whose employment agreements may cover only short, specific time periods. Contingent workers can be employees, but can also be independent contractors/vendors or may be employed by staffing services firms/vendors. Rather than expand or contract the core workforce, many employers achieve flexibility and control labor costs by expanding or contracting the contingent workforce. Toyota, for example, while not cutting regular employees in either the United States or Japan during the recent recession, has cut its contract worker headcount. The segmented supply of nurses at St. Luke’s Hospital, discussed in Chapter 7 and shown in Exhibit 18.4, illustrates the variable costs from use of different sources of EXHIBIT 18.4 Segmented Supplies: St. Luke’s Labor Cost Model Source: © George T. Milkovich. nurses. Regular, pool, registry, and traveler nurses are paid differently. Some have benefits from St. Luke’s, others have them from the contracting agencies, and still others must purchase their own benefits (pool nurses). The tradeoffs in managing costs include balancing patient loads, nurse-to-patient ratios, costs of alternative sources, and quality of care.13Hours Rather than define employment as number of employees, hours of work is often used. For nonexempt employees in the United
  • 8. States, hours over 40 per week are more expensive (one-and-a- half times regular wage). Hence, another way to manage labor costs is to examine overtime hours versus hiring more employees. St. Luke’s may guarantee its regular nurses a specific number of hours, but contract nurses (pool, registry, or travelers) are “on call.” The four factors in the labor cost model—number of employees, hours worked, cash compensation, and benefit costs—are not independent. Overtime hours require higher wages but the incremental benefits cost is substantially lower than that incurred in hiring an additional regular nurse. The higher the fixed benefits costs, the more viable is the option to add overtime (even with the time and a half premium) rather than hiring another nurse. By not hiring, the organization avoids recruitment/selection costs. It also gains more flexibility to reduce labor costs if demand for its health care services declines in the future. In that case, rather than cutting headcount, it can reduce hours worked, which helps avoid employee relations problems as well as the monetary costs of reducing headcount. During the most recent recession, a number of firms reduced hours and costs through the use of mandatory unpaid leave or furloughs to cut hours and thus labor costs. For example, state employees in California were required to take two furlough days off per month, resulting in a 10 percent pay cut. Wendy Roberson, one such employee, partly as a joke, founded the “Fun Furlough Fridays Club.” Nobody wants a pay cut, but if you are going to get some extra time off, you might as well make the best of it and enjoy it, right? Well, as it turns out, although the pay cut was real, the time off in many cases was not. The amount of work to be done did not decrease, so many “furloughed” employees found themselves at work, rather than having Fun Furlough Fridays.14 Nevertheless, reducing hours and pay does mean that fewer headcount 672 reductions are necessary and by avoiding these, there will be
  • 9. less disruption and private sector organizations should be better positioned to respond when business picks up again, at least so long as top performers don’t find greener pastures in the meantime.15Benefits One of the most common approaches to reducing benefits costs recently has been for employers to suspend matching (made when employees contribute) to 401(k) retirement plans. Survey data show about one in four companies either have already suspended their matching contributions or are considering doing so. Even the American Association for Retired Persons (AARP) decided it needed to suspend its 401(k) retirement plan match, a decision that was presumably not taken lightly!16 The average company match is 50 cents on the dollar up to 6 percent of pay. More companies may move to a model that makes matching contributions dependent on profits.17 Another action we have seen is organizations eliminating benefits such as defined benefit (pension) plans as part of seeking bankruptcy protection from creditors. Examples include several airlines (e.g., United, Delta, USAir, Northwest), automobile companies (General Motors, Chrysler), and automobile parts companies (e.g., Delphi). As noted in Chapter 13, the Pension Benefit Guaranty Corporation (PBGC) provides benefits to employees who were covered under such plans. However, the maximum monthly retirement benefit from the PBGC is $5,011 at age 65, meaning that more highly paid employees (e.g., airline pilots) can experience a significant loss in pension benefits after bankruptcy. Other, more typical, ways of controlling or reducing benefits costs have to do with efforts by companies in the area of health care (as discussed in Chapters 12 and 13).Average Cash Compensation (Fixed and Variable Components) Average cash compensation includes average salary (fixed payments) level plus variable compensation payments such as bonuses, gain sharing, stock plans, and/or profit sharing. The fixed component is typically paid regardless of business performance. In contrast, the variable component of
  • 10. compensation, in theory, will rise and fall in line with business performance. For example, a profit-sharing plan will ordinarily have lower than normal profit-sharing payouts in years when profits are lower than normal. If other firms are experiencing similar profit declines, then there may be less danger of losing employees through turnover when this happens and the full advantage of “automatic” labor cost flexibility can be experienced. During the most recent recession (in 2009) almost one-half of firms froze salaries, giving no annual increase,18 resulting in an average salary increase budget across companies of just 1.9 percent. As Exhibit 18.5 indicates, salary increase budgets have increased since 2009. In addition, only 5 percent of firms froze salary increase budgets in 2011 (and in subsequent years), down from 21 percent in 2010, and 48 percent in 2009.19 Another major tool used by organizations to control salary costs, in both good and bad times, is variable pay (See Chapters 8 and 10.) As Exhibit 18.6 shows, while the size of the merit increase budget has come down over time, the size of the variable pay (e.g., lump sum merit increases, profit sharing) budget has gone up very significantly. Unlike base salary increases, variable pay does not become a permanent part of base salary. Thus, the variable aspect allows companies to reduce labor costs when times are tough and to share 673 EXHIBIT 18.5 Base Salary Increases in Recent Years, as Percentage of Payroll, Salaried Exempt Employees Source: Aon Hewitt, 2014 Annual Salary Increase Survey, August 2014. Percentage increase each year is based on average for salaried exempt, salaried nonexempt, and nonunion hourly employee groups. *Projected EXHIBIT 18.6 Traditional Base Salary Increases and Variable Pay, as Percentage of Payroll, Salaried Exempt Employees, Changes Over Time
  • 11. Source: Ken Abosch. Ensuring Effective Broad-Based Variable Pay. Total Rewards 2014 Conference, WorldatWork. Aon Hewitt, 2014 Annual Salary Increase Survey, August 2014. * Projected success with (and reward) employees when times are good. As we saw earlier, the Big Three U.S. automobile companies have followed this strategy in recent years. Adjustments to average cash compensation level (here, to simplify, we focus primarily on the salary component) can be made (1) top down, in which top management determines the amount of money to be spent on pay and allocates it “down” to each subunit for the plan year, and (2) bottom up, in which individual employees’ pay for the plan year is forecasted and summed to create an organization-wide salary budget.Budget Controls: Top Down Top-down budgeting begins with an estimate from top management of the pay increase budget for the entire organization. Once the total budget is determined, it is then allocated to each manager, who plans how to distribute it among subordinates. There are many approaches to top-down budgeting. A typical one, planned pay-level rise, is simply the percentage increase in average pay for the unit that is planned to occur. Several factors influence the decision on how much to increase the average pay level for the next period: how much the average level was increased this period, ability to pay, competitive market pressures, turnover effects, and cost of living.Current Year’s Rise This is the percentage by which the average wage changed in the past year; mathematically: Percent paylevel− rise=100×average pay at yearend−−average pay at year beginningaverage pay at year beginning 674Ability to Pay Any decision to increase the average pay level is in part a function of the organization’s financial circumstances.
  • 12. Financially healthy employers may wish to maintain their competitive positions in the labor market or share financial success through bonuses and profit sharing. Conversely, financially troubled employers may not be able to maintain competitive market positions. As noted, the conventional response has been to reduce employment. As shown earlier, by analyzing pay and staffing at each level, potential cost savings can be discovered. Other options are to reduce the rate of increase in average pay by controlling adjustments in base pay and/or variable pay. Raising employees’ copays and deductibles for benefits is another. Often as a last resort, firms decrease base wages (as well as variable pay). Airline pilots and mechanics have taken highly publicized pay cuts in recent years. Other alternatives also exist. Look again at the cost model for St. Luke’s and its segmented labor supply. The hospital can reduce costs by reducing the different sources of contract nurses.Competitive Market Pressures In Chapter 8, we discussed how managers determine an organization’s competitive position in relation to its competitors. Recall that a distribution of market rates for benchmark jobs was collected and analyzed into a single average wage for each benchmark. This “average market wage” becomes the “going market rate,” and this market rate changes each year in response to a variety of factors in the external market.Turnover Effects Sometimes referred to as “churn” or “slippage,” the turnover effect recognizes the fact that when people leave (through layoffs, quitting, retiring), they typically are replaced by employees who earn a lower wage. Exhibit 18.2 illustrates where an organization is overstaffed compared to competitors. Reducing levels at E5 and E4 and replacing them with E1s and E2s will reduce labor costs. However, keep in mind the potential impact on revenues and customer satisfaction, as well as possible violation of the Age Discrimination in Employment Act. The turnover effect can be calculated as annual turnover
  • 13. multiplied by the planned average increase. For example, assume that an organization whose labor costs equal $1 million a year has a turnover rate of 15 percent and a planned average increase of 6 percent. The turnover effect is .15 × .06 = 0.9%, or $9,000 (.009 × $1,000,000). So instead of budgeting an additional $60,000 to fund a 6 percent increase, only $51,000 is needed. The turnover effect will also reduce benefit costs linked to base pay, such as pensions.20Cost of Living Although there is little research to support cost of living increases, employees undoubtedly compare their pay increases to changes in their living costs. Unions consistently argue that increasing living costs justify increasing pay. It is important to distinguish among three related concepts: the cost of living, changes in prices in the product and service markets, and changes in wages in labor markets. As Exhibit 18.7 shows, changes in wages in labor markets are measured 675 EXHIBIT 18.7 Three Distinct but Related Concepts and Their Measures through pay surveys. These changes are incorporated into the system through market adjustments in the budget and updates of the policy line and range structure. Price changes for goods and services in the product and service markets are measured by several government indexes, one of which is the consumer price index (CPI). The third concept, the cost of living, refers to the expenditure patterns of individuals for goods and services. The cost of living is more difficult to measure because employees’ expenditures depend on many things: marital status, number of dependents and ages, personal preferences, location, and so on. Different employees experience different costs of living, and the only accurate way to measure them is to examine the personal expenditures of each employee. The three concepts are interrelated. Wages in the labor market are part of the cost of producing goods and services, and changes in wages create pressures on prices. Similarly, changes
  • 14. in the prices of goods and services create the need for increased wages in order to maintain the same lifestyle. Many people refer to the CPI as a “cost-of-living” index, and many employers choose, as a matter of pay policy or in response to union pressures, to tie wages to it. However, the CPI does not necessarily reflect an individual employee’s cost of living. Instead, it measures changes in prices over time. Changes in the CPI indicate whether prices have increased more or less rapidly in an area since the base period. For example, a CPI of 110 in Chicago and 140 in Atlanta does not necessarily mean 676 that it costs more to live in Atlanta. It does mean that prices have risen faster in Atlanta since the base year than they have in Chicago, since both cities started with bases of 100. e-Compensation A simple inflation calculator at www.westegg.com/inflation/ uses the consumer price index to adjust any given amount of data from 1800 on. Most governments calculate some kind of consumer price index for their country. The Web page for the U.S. Bureau of Labor Statistics provides many of these indexes (stats.bls.gov). They vary on how realistically they capture actual changes in prices. A word of caution: If you decide to use the CPI rather than labor market salary surveys to determine the merit budget, you basically are paying for inflation rather than performance or market changes. e-Compensation A quicker way to compare living costs is to use the “relocation salary calculator” at www.homefair.com/homefair/calc/salcalc.html. Enter your current city and potential new city to see what salary you need in the new city based on cost-of-living differences. How accurate is this website’s information? The CPI is of public interest because changes in it trigger changes in labor contracts, social security payments, federal and military pensions, and food stamp eligibility. Tying budgets or
  • 15. payments to the CPI is called indexing.Rolling It All Together Let us assume that the managers take into account all these factors—current year’s rise, ability to pay, market adjustments, turnover effects, changes in the cost of living, and geographic differentials—and decide that the planned rise in average salary for the next period is 6.3 percent. This means that the organization has set a target of 6.3 percent as the increase in average salary that will occur in the next budget period. It does not mean that everyone’s increase will be 6.3 percent. It means that at the end of the budget year, the average salary calculated to include all employees will be 6.3 percent higher than it is now. The next question is, How do we distribute that 6.3 percent budget in a way that accomplishes management’s objectives for the pay system and meets the organization’s goals?Distributing the Budget to Subunits A variety of methods exist for determining what percentage of the salary budget each manager should receive. Some use a uniform percentage, in which each 677 manager gets an equal percentage of the budget based on the salaries of each subunit’s employees. Others vary the percentage allocated to each manager based on pay-related issues—such as turnover or performance—that have been identified in that subunit. Once salary budgets are allocated to each subunit manager, they become a constraint: a limited fund of money that each manager has to allocate to subordinates. Typically, merit increase guidelines are used to help managers make these allocation decisions. Merit increase grids help ensure that different managers grant consistent increases to employees with similar performance ratings and in the same position in their ranges. Additionally, grids help control costs. Chapter 11 provides examples of merit increase grids. To limit the number of employees placed in high performance categories (and thus the number of employees receiving the largest merit increases),
  • 16. some companies used forced distribution approaches.Budget Controls: Bottom Up In contrast to top-down budgeting, where managers are told what their salary budget will be, bottom-up budgeting begins with managers’ pay increase recommendations for the upcoming plan year. Exhibit 18.8 shows the process involved. 1.Instruct managers in compensation policies and techniques. Train managers in the concepts of a sound pay-for-performance policy and in standard company compensation techniques such as the use of pay-increase guidelines and budgeting techniques. Communicate market data and the salary ranges. 2.Distribute forecasting instructions and worksheets. Furnish managers with the forms and instructions necessary to preplan increases. Most firms offer managers computer software to support these analyses and to enter information and perform what-if analyses.21 Adjustments for each individual are fed into the summary merit budget, promotion budget, equity adjustment budget, and so on, on a summary screen. These recommendations are then submitted electronically. The type of information available to each supervisor to guide him or her in making recommendations might include performance rating history, past raises, training background, and stock allocations are all included. Guidelines for increases based on merit, promotion, and equity adjustments are provided, and all the worksheets are linked so that the manager can model pay adjustments for employees and see the budgetary effects of those adjustments immediately. Some argue that providing such detailed data and recommendations to operating managers makes the process biased. How would you like your instructor to look at your overall GPA before giving you a grade in this course? Pay histories, however, ensure that managers are at least aware of this information and that pay increases for any one period are part of a continuing message to individual employees, not some ad-hoc response to short-term changes. 3.Provide consultation to managers. Offer advice and salary
  • 17. information services to managers upon request. Dell’s online approach makes it much easier to request and apply such guidance. 678 EXHIBIT 18.8 Compensation Forecasting and Budgeting Cycle 4.Check data and compile reports. Audit the increases forecasted to ensure that they do not exceed the pay guidelines and are consistent with appropriate ranges. Then use the data to feed back the outcomes of pay forecasts and budgets. 5.Analyze forecasts. Examine each manager’s forecast, and recommend changes based on noted inequities among different managers. 6.Review and revise forecasts and budgets with management. Consult with managers regarding the analysis and any recommended changes. Obtain top-management approval of forecasts. 7.Conduct feedback with management. Present statistical summaries of the forecasting data by department, and establish unit goals. 8.Monitor budgeted versus actual increases. Control the forecasted increases versus the actual increases by tracking and reporting periodic status to management. The result of the forecasting cycle is a budget for the upcoming plan year for each organization’s unit as well as estimated pay treatment for each employee. The budget does not lock in the manager to the exact pay change recommended for each employee. Rather, it represents a plan, and deviations due to unforeseen changes such as performance improvements and unanticipated promotions are common. The approach places responsibility for pay management on the managers by requiring them to plan the pay treatment for each of their employees. The compensation manager takes on the role of advisor to operating management’s use of the system.22 679Embedded (Design) Controls Controls on managers’ pay decisions come from two different
  • 18. aspects of the compensation process: (1) controls that are inherent in the design of the techniques, and (2) the formal budgeting process discussed above. Think back to the many techniques already discussed: job analysis and evaluation, skill- and competency-based plans, policy lines, range minimums and maximums, broad bands, performance evaluation, gain sharing, and salary-increase guidelines. In addition to their primary purposes, these techniques also regulate managers’ pay decisions by guiding what managers can and cannot do. Controls are built into these techniques to direct them toward the pay system objectives. A few of these controls are examined below.Range Maximums and Minimums Ranges set the maximum and minimum dollars to be paid for specific work. The maximum is an important cost control. Ideally, it represents the highest value the organization places on the output of the work. With job-based structures, skills and knowledge possessed by employees may be more valuable in another job, but the range maximum represents the maximum worth to an organization of work performed in a particular job. When Walmart installed range maximums and minimums for its jobs, its critics accused the company of “capping wages” of its workers. Those readers who recall Chapter 8’s discussion on designing ranges recognize that specific jobs may have a maximum rate (a cap) but individuals may still be able to increase their pay through promotions, profit sharing, and so on.23 When employees are paid above the range maximum, these rates are called red circle rates. Most employers “freeze” red circle rates until the ranges are shifted upward by market update adjustments so that the rate is back within the range again. An organization also has the option to combine a salary freeze with the use of merit bonuses, which unlike merit increases, do not become part of base salary. If red circle rates become common throughout an organization, then the design of the ranges and the evaluation of the jobs should be reexamined. Green circle rates refer to instances where employees are paid below the
  • 19. minimum. As with red circle rates, organizations typically take steps to make sure these are temporary. Range minimums are just that: the minimum value placed on the work. Often rates below the minimum are used for trainees. Pay below minimum may also occur if outstanding employees receive a number of rapid promotions and pay increases have not kept up.Broad Bands Broad bands are intended to offer managers greater flexibility compared to a grade-range design. Usually broad bands are accompanied by external market “reference rates” and “shadow ranges” that guide managers’ decisions. Bands may be more about career management than pay decisions. Rather, the control is in the salary budgets given to managers. The manager has flexibility in pay decisions, as long as the total pay comes in under the budget. 680Promotions and External versus Internal Hires Promotion-based pay increases are often substantial, meaning that cost control efforts must monitor both rates of promotion and the salary increase that is given with promotions. Some organizations limit the number of promotions permitted within a time period and some also limit the number of grades/levels that an employee can advance as well as the size of the promotion salary increase.24 Another, more strategic issue concerns the degree to which positions are filled from the inside via promotion versus the use of outside hires.25 Outside hires often command a pay premium and, to the degree that their higher pay is known to other employees, internal equity pressures may, in some cases, result in higher pay for current employees as a means to preserve current norms regarding relative pay.Compa- Ratios Range midpoints reflect the pay policy line of the employer in relationship to external competition. To assess how managers actually pay employees in relation to the midpoint, an index called a compa-ratio is often calculated: Comparatio−=average rate actual paidrange midpointCompa-
  • 20. ratio=average rate actual paidrange midpoint A compa-ratio of less than 1 means that, on average, employees in a range are paid below the midpoint. That is, managers are paying less than the intended policy. There may be several valid reasons for such a situation. The majority of employees may be new or recent hires; they may be poor performers; or promotion may be so rapid that few employees stay in the job long enough to get into the high end of the range. A compa-ratio greater than 1 means that, on average, the rates exceed the intended policy. The reasons for this are the reverse of those mentioned above: a majority of workers with high seniority, high performance, low turnover, few new hires, or low promotion rates. Compa-ratios may be calculated for individual employees, for each range, for organization units, or for functions. Other examples of controls designed into the pay techniques include the mutual sign-offs on job descriptions required of supervisors and subordinates. Another is slotting new jobs into the pay structure via job evaluation, which helps ensure that jobs are compared on the same factors. Similarly, an organization-wide performance management system is intended to ensure that all employees are evaluated on similar factors.Variable Pay The essence of variable pay is that it must be re-earned each period, in contrast to conventional merit pay increases or across-the-board increases that increase the base on which the following year’s increase is calculated. We have distinguished between fixed and variable pay and noted multiple times that organizations have moved toward greater reliance on variable pay. It is important enough that it bears repeating again. As we saw in Exhibit 18.6, organizations have increased their use of variable pay relative to traditional base pay increases. 681 Increases added into base pay have compounding effects on costs, and these costs are significant. For example, a $15-a- week take-home pay added onto a $40,000 base compounds into
  • 21. a cash flow of $503,116 over 10 years. In addition, costs for some benefits also increase. By comparison, the organization could use that same $503,000 to keep base pay at $40,000 a year and pay a 26.8 percent bonus every single year. As the example shows, the greater the ratio of variable pay to base pay, the more flexible the organization’s labor costs. Apply this flexibility to the general labor cost model in Exhibit 18.1. The greater the ratios of contingent to core workers and variable to base pay, the greater the variable component of labor costs and the greater the options available to managers to control these costs. A caution: Although variability in pay and employment may be an advantage for managing labor costs, it may be less appealing from the standpoint of managing effective treatment of employees. The inherent financial insecurity built into variable plans may adversely affect employees’ financial well-being, especially for lower-paid workers. Managing labor costs is only one objective for managing compensation.Analyzing Costs Costing out wage proposals is commonly done prior to recommending pay increases, especially for collective bargaining. For example, it is useful to bear in mind the dollar impact of a 1-cent-per-hour wage change or a 1 percent change in payroll as one goes into bargaining. Knowing these figures, negotiators can quickly compute the impact of a request for a 9 percent wage increase. Commercial compensation software is available to analyze almost every aspect of compensation information. Software can easily compare past estimates to what actually occurred (e.g., the percentage of employees that actually did receive a merit increase and the amount). It can simulate alternate wage proposals and compare their potential effects. It can also help evaluate salary survey data and simulate the cost impact of incentive and gain-sharing options.MANAGING REVENUES Although the cost of compensation is most easily measured (and managed/controlled), we cannot forget that compensation, via its incentive and sorting effects on the workforce and its central
  • 22. role in supporting strategy execution, is also central to driving future revenues. According to one study, only about one-third of organizations actually calculate the cost and value added by their pay programs.26 Not surprisingly, another survey reports that assessment of the impact of compensation on revenues falls especially short, with about 70 percent of the compensation specialists reporting their tools as “ineffective” to determine the value added. However, a handful of companies, supported by consultants and researchers, are beginning to analyze the value added (or return on investments) of pay decisions and how that influences revenues.27 This analysis requires a shift in how compensation is viewed. Compensation becomes an investment as well as an expense. Decisions are based on analysis of the return on this investment. The hope is to answer questions such as, “So what” returns are expected 682 from spending more on the offensive team (as do the Seattle Seahawks), or showering rewards on the top performers (as does General Electric), or on a new incentive plan based on a balanced scorecard (as does Citigroup)?28 Exhibit 18.9 illustrates the approach to assessing value gained in different ways, which directly or indirectly influence revenues. The company in this exhibit has already done an analysis that suggests that the top 10 percent of employees improve returns by about 2 to 5 percent of their average salary. Now the company is considering two actions: 1.Implement a bonus plan based on balanced scorecards for individual managers. 2.Increase the differentiation between top performers and average performers. The exhibit shows the analysis of potential value added by these two options. The returns are grouped into four types: recruiting and retaining top talent, reducing turnover of top performers, revenue enhancement, and productivity gains. The logic, assumptions, measures, and estimates of gains are described in the exhibit. The cautious reader will immediately see that the
  • 23. assumptions are critical and based on research evidence, best estimates, and judgments. The practice of analyzing the returns from compensation decisions is in its early stages. The promise is that it will direct thinking beyond treating compensation as only an expense to considering the returns gained as well. Our discussion of utility analysis in the Appendix to Chapter 7 is an example of one approach.29 Advocates want to develop compensation managers’ analytical literacy. Readers will recognize the similarity to topics in their finance and operations management classes. Nevertheless, managers still must use their heads as well as their models. Treating compensation as an investment and employees as human capital risks losing sight of them as people.30 The fairness objective must not get lost in the search for ROI. Using Compensation to Retain (and Recruit) Top Employees Recall that one aspect of the sorting effect is that high performers will tend to move from organizations that do not adequately compensate them for the high value they create to organizations that do. Some in this group will be “pushed” to look for another job because of their perception that they are not equitably paid. However, a substantial share of employees, especially high performers, leave their jobs because of being “pulled” by opportunities elsewhere. They leave not as a result of being dissatisfied with their current job and/or as a result of looking for a new job, but rather because an unsolicited opportunity from a proactive organization came their way.31 Indeed, Google’s top human resources executive takes the view that the best people are doing well where they are and that it is important to invest resources to learn who they are. They may not actively search or apply for jobs at Google, but Google wants to cultivate these “passive job seekers,” even if it takes years because Google sees successfully hiring such people as a path to higher revenues.32 The implication is that their current employer would do well to keep compensation current and competitive (given their skills and value/revenues
  • 24. generated) because other (proactive) organizations will eventually find them. It also means that organizations can be proactive too not just in terms of keeping valuable employees they already have, but in looking for people employed elsewhere who can come and create value and higher revenues. 683 EXHIBIT 18.9 Examples of How Compensation Can Influence Revenues (directly or indirectly) 684 MANAGING PAY TO SUPPORT STRATEGY AND CHANGE In Chapter 2, we noted the important role of pay in supporting the business strategy and the HR strategy. We saw that organizations with different business strategies often have correspondingly different compensation strategies. We also saw, using the ability-motivation-opportunity (AMO) framework that pay plays a crucial role. These alignment issues must be managed successfully to drive future revenues (and control costs). Compensation often plays a singular role when organizations restructure. Strategic changes in the business strategy mean the compensation strategy must be realigned as well. Looking back again to Chapter 2, pay’s incentive effects can help redirect and reenergize employee efforts. Its sorting effects can help replace current employees who fit the old system, but not the new system, with new employees who do fit. The bigger the change, the bigger the sorting effects and the more likely that there will a difficult period of adjustment as part of the change. The question is whether the short-term pain will be worth it to reposition the organization to better succeed going forward in terms of achieving the goals of stakeholders (owners, employees, customers, and so forth). Pay is a powerful signal of change; changing people’s pay captures their attention. At a broader level, pay changes can play two roles in any restructuring. Pay can be a leading catalyst for change or a follower of change. Shifts from conventional across-the-board annual increases to profit sharing
  • 25. or from narrow job descriptions and ranges to broad roles and bands signal major change to employees. Determining the role pay plays is an important part of a strategic perspective, as you will recall from the Chapter 2 discussion of strategic mapping. Microsoft’s shift from its uniquely aggressive stock options to less risky stock awards illustrates the point. Microsoft used its change in the pay mix to communicate a shift from a “workaholic—get rich quick” to a “work hard—get paid well” approach. Whether this shift acts as a catalyst or a support is open to debate. As a catalyst, it communicates change more strongly and vividly than any rhetoric could. It helps drive recruiting and retention. Yet it may be that Microsoft had already changed as an organization. Faced with murmuring employees (their options were underwater) and external conditions (an accounting rule change that required options to be treated as an expense) the shift in pay mix merely confirmed reality—that Microsoft had changed. Whether pay is a leading catalyst for change or a follower of change, compensation managers must learn how to implement and manage change. Not only must they know the strategic and technical aspects of compensation, they also must know how to bargain, resolve disputes, empower employees, and develop teams. Being able to grab bullets in midflight doesn’t hurt, either.33 COMMUNICATION: MANAGING THE MESSAGE Compensation communicates. It signals what is important and what is not. If you receive a pay increase for one more year of experience on your job, then one more year is important. If the pay increase is equal to any change in the CPI, then the CPI and its real meaning is important. If the increase is for moving to a bigger job or for 685 outstanding performance, then a bigger job or outstanding performance is important. Changes in a pay system also send a powerful message. Microsoft’s shift from stock options to grants tells everyone (current and future employees and
  • 26. stockholders) to expect lower risks and lower returns. Earlier in this book, we stressed that employees must understand the pay system. Their understanding is shaped indirectly through the paychecks they receive and directly via formal communication about their pay, their performance, and the markets in which the organization competes. An argument for employee involvement in the design of pay systems is that it increases understanding. Two surveys are revealing. A Watson Wyatt survey of 13,000 employees reported that about only 35 percent of them understood the link between their job performance and the pay they receive. (Watson Wyatt failed to point out that some workers may simply believe that in their organizations there is no real link!)34WorldatWork did a second survey of 6,000 employees. Only about one-third of them said they understood how pay ranges are determined or had a reasonable idea of what their increase would be if they were promoted. Fewer than half understood how their own pay increases are calculated.35Exhibit 18.10 provides further insight into employee (lack of) pay knowledge. Of note is that only 8 and 4 percent, respectively, of compensation professionals strongly agree that employees know their own pay range (e.g., the maximum they can earn without getting promoted), the pay range above them (so, how much they could earn if they were promoted). By contrast, 15 and 20 percent, respectively, strongly disagree that employees have this information, which presumably is relevant to their work motivation. Finally, only a minority of respondents agree that pay-related information is “shared openly” in their organizations. Two reasons are usually given for communicating pay information. The first is that considerable resources have been devoted to designing a fair and equitable system that is intended to attract and retain qualified people and motivate performance. For managers and employees to gain an accurate view of the pay system—one that perhaps influences their attitudes about it— they need to be informed. Of course, one might observe that
  • 27. increasing the accuracy of employee perceptions through pay openness is most useful in cases where the compensation system is well-designed and will be perceived as fair and credible by employees. In that case, from a motivational point of view, it would certainly make sense to communicate and demonstrate to employees that those with consistently high performance receive higher compensation (including via more promotions) than others.36 Thus, it is quite interesting (see Exhibit 18.10) that most (25% + 41% = 66%) U.S. private sector employees report working in organizations where pay secrecy is the policy and few (17%) report that pay information is made public. The lack of pay knowledge among employees discussed above now becomes easier to understand. As Exhibit 18.10 also shows, there is much more pay openness in the public sector (both because of higher union coverage and because taxpayers wish to know how their tax dollars are spent). Finally, it is important to keep in mind that a pay secrecy policy in private sector organizations may be illegal. Under the National Labor Relations Act, it is illegal if it interferes with “concerted action” by employees. In addition, Executive Order 13665, “Non-Retaliation for Disclosure of Compensation Information,” prohibits federal contractors or subcontractors from “discharging or discriminating in any other way 686 EXHIBIT 18.10 Pay Communication and Employee Knowledge of Pay Source: Dow Scott, Tom McMullen, Bill Bowbin, and John Shields. Alignment of Business Strategies, Organization Structures and Reward Programs: A Survey of Policies, Practices and Effectiveness. WorldatWork, May 2009. N = 442 to 446 responses from compensation professionals. against employees or applicants who inquire about, discuss, or disclose their own compensation or the compensation of another employee or applicant.”37 It serves to modify existing Executive Order 11246 with the aim of making it more
  • 28. effective. A major rationale given is that to the degree discrimination explains why men and women are paid differently, “strictures against revealing compensation can conceal compensation disparities among employees. This makes it impossible for an employee to know he or she is being underpaid compared to his or her peers. If compensation remains hidden, employees who are being unfairly paid less because of their gender or race will remain unaware of the problem and will be unable to exercise their rights by filing a complaint pursuant to the Executive Order.” The second (and related) reason for communicating pay information is that, according to some research, employees seem to misperceive the pay system. For example, they tend to overestimate the pay of those in lower-level jobs and to underestimate the pay of those in higher-level jobs. They assume that the pay structure is more compressed than it actually is. If differentials are underestimated, their motivational value is, as noted above, diminished, because they underestimate the payoff to high performance. Further, there is some evidence to suggest that the goodwill engendered by the act of being open about pay may also affect perceptions of pay equity. Interestingly, the research also shows that employees in companies with open pay communication policies are as inaccurate in estimating pay differentials as those in companies in which pay secrecy prevails.38 (Caution: Most of this research was done over 20 years ago.) However, employers in companies with open pay policies tend to express higher satisfaction with their pay and with the pay system.39 Other research indicates that employee reactions to pay secrecy versus pay openness depend on equity sensitivity, with those more sensitive to whether pay is fair given inputs like performance being most likely to respond favorably (higher performance, stronger perceived performance— pay instrumentality) to pay openness.40 Other research, in a university setting, found that making pay information on other employees in the university systems more explicitly available
  • 29. resulted in more pay comparisons by employees (especially with peers in the same department) and lower satisfaction and greater search intentions among 687 EXHIBIT 18.11 Pay Secrecy Policies, Private and Public Sector Source: Adapted from Institute for Women’s Policy Research, Pay Secrecy and Wage Discrimination. Fact Sheet IWPR #C382, June 2011, www.ipr.org.; accessed June 5, 2012. Data from national (U.S.) survey of 2,700 adults (18 and over). Percentages differ slightly from source because categories constrained here to sum to 100%. employees paid below the median for their department and occupation. This finding led the study authors to conclude that “employers have a strong incentive to impose pay secrecy rules,” but also noted that another result could be a change in the composition of the workforce.41Another way to put it is that being more open with pay information will decrease the satisfaction of some employees. So, an employer must be prepared to address that consequence. However, an employer will also want to consider who is dissatisfied and why. To the degree that pay is based on performance, being more open with pay could result in positive sorting effects over time to the extent that it is low performers who are dissatisfied and they leave and are replaced by higher performing employees. A laboratory study found some evidence that more open pay not only had positive incentive effects on performance (especially when performance was measured in relative terms), but also that there were positive sorting effects of the type just suggested.42 In the case of benefits too, communication plays a potentially important role. We know that employees greatly underestimate the value of their benefits, which is a major concern given that benefits add roughly 40 cents on top of every dollar spent on cash compensation.43 WorldatWork recommends a six-stage process of communication, similar to that shown in Exhibit 18.12.44
  • 30. Step 1 is, not surprisingly, defining the objectives of the communication program. Is it to ensure that employees fully understand all the components of the compensation system? Is it to change performance expectations? Or is it to help employees make informed health care choices? While specifying objectives as a first step seems obvious, doing so is often overlooked in the rush to design an attractive brochure, website, or CD. Step 2 is to collect information from executives, managers, and employees to assess their current perceptions, attitudes, and understanding of the subject. Information may be gathered through online opinion surveys and focus groups to identify problems in understanding the compensation system. 688 EXHIBIT 18.12 The Compensation Communication Cycle Step 3 is a communication program that will convey the information needed to accomplish the original objectives. There is no standard approach on what to communicate to individuals about their own pay or that of their colleagues. Some organizations adopt a marketing approach. That includes consumer attitude surveys about the product, snappy advertising about the pay policies, and elaborate websites expounding policies and rationale. The objective is to manage expectations and attitudes about pay. In contrast, the communication approachtends to focus on explaining practices, details, and the way pay is determined. The marketing approach focuses on the strategy, values, and advantages of overall policies and may be silent on specifics such as range maximums, increase guides, and the like. Steps 4 and 5 of the communication process are to determine the most effective media, in light of the message and the audience, and to conduct the campaign. The message can be fine-tuned, depending on the audience. Executives, for example, should be interested in how the compensation programs fit the business strategy. Managers need to know how to use the development and motivation aspects of the compensation program for the
  • 31. people they supervise. Employees may want to know the processes and policies as well as specifics about how their pay is determined. The danger is overload—information is so detailed that employees get snowed under sorting through it. Step 6 of the communication process suggests that the program be evaluated. Did it accomplish its goals? Pay communication often has unintended consequences.45 For example, improving employees’ knowledge about pay may cause 689 some initial short-term concerns. Over the years, employees may have rationalized a set of relationships between their pay and the perceived pay and efforts of others. Receiving accurate information may require that those perceptions be adjusted. e-Compensation One compensation manager reports having a great deal of difficulty with an employee who used the homefair website www.homefair.com to determine that he should receive a 30 percent pay differential to accompany his transfer from one office to another. In contrast, the manager’s information showed a differential of around 12 to 15 percent. How can you judge the accuracy of information obtained on the Web? How would you deal with the unhappy employee? Say What? (Or, What to Say?) As noted above, if the pay system is not based on work-related or business-related logic, then the wisest course is probably to avoid formal communication until the system is put in order. However, avoiding formal communication is not synonymous with avoiding communication. Employees are constantly getting intended and unintended messages through the pay treatment they receive. Some employers communicate the range for an incumbent’s present job and for all the jobs in a typical career path or progression to which employees can logically aspire. Some also communicate the typical pay increases that can be expected for poor, satisfactory, and top performance. The rationale given is that employees exchange data (not always factual) and/or guess
  • 32. at normal treatment and that the rumor mills are probably incorrect. However, as we saw just above, employee pay knowledge is often quite limited. How people process information and make decisions, as shown in Exhibit 18.13, offers some new ideas when contemplating compensation communications.46 Opening the Books There are some who advocate going beyond the sharing of pay information to the sharing of all financial information with employees.47Employees at engine rebuilder Springfield Remanufacturing receive weekly peeks at everything from revenues to labor costs. The employees, who own 31 percent of the company stock, believe that this “open-book” approach results in high commitment and an understanding of how to maintain competitiveness. Whole Foods’ open-paybook approach was described in Chapter 1. Most employers don’t share information with such gusto, but they are increasingly disclosing more to their employees. Some are even providing basic business and financial training to help employees better understand the information. Devotees of opening the books and providing financial training believe these methods will improve attitudes and performance, but there is no research to support this. With salary data available on the Internet (albeit often inaccurate and misleading), developing in-house compensation portals has appeal. 690 EXHIBIT 18.13 Guidance from the Research on Pay Communication At the minimum, the most important information to be communicated is the work-related and business-related rationales on which pay systems are based. Some employees may not agree with these rationales or the results, but at least it will be clear that pay is determined by something other than the whims of their supervisors. STRUCTURING THE COMPENSATION FUNCTION AND ITS
  • 33. ROLES Compensation professionals seem to be constantly reevaluating where within the organization the responsibility for the design and administration of pay systems should be located. The organizational arrangements of the compensation function vary widely.48 Other key issues include the use of enterprise information systems and ethics issues for compensation professionals. Centralization–Decentralization (and/or Outsourcing) An important issue related to structuring the function revolves around the degree of decentralization (or centralization) in the overall organization structure. Decentralized refers to a management strategy of giving separate business units the responsibility of designing and administering their own systems. This contrasts with a centralized strategy, which locates the design and administration responsibility at corporate headquarters. A centralized compensation strategy and function is more likely to be found in smaller and/or single line of business organizations. This “one size fits all” approach is more likely to make sense when the entire company mostly competes in a single product market. Examples include Herman Miller (furniture) and McDonald’s (quick service food).49 However, in organizations (e.g., IBM) that are larger and/or compete in different product (or geographic) markets, human resource and compensation strategies are more likely to need to be tailored to fit those different contexts. In such cases, compensation professionals are increasingly likely 691 to be embedded in each business unit. Typically, corporate will retain some number of compensation professionals, perhaps in what is known as a center for expertise. This group provides an internal consulting capability that human resource professionals in the business units, who are often human resource generalists, can be drawn on to assist in the design of compensation strategies. The mix of corporate and business unit compensation expertise is a balancing act. Too big of a corporate group risks
  • 34. becoming out of touch with specific business unit needs. Too many staff in the business units risks reinventing the wheel, duplication/redundancy of expertise, and higher costs. Over time, it is not unusual to see the pendulum swing within companies back and forth between more or less centralization. Other, more decentralized organizations, such as Eaton and GE, have relatively small corporate compensation staffs. Sometimes, their primary responsibility is to manage the systems by which executives and the corporate staff are paid (although GE corporate compensation drives the salary planning process company-wide). These professionals may operate in a purely advisory capacity to other organization sub-units. The subunits, in turn, may employ their own compensation specialists. Or the subunits may choose to employ only personnel generalists rather than compensation specialists and may turn to outside compensation consultants to purchase the expertise required on specific compensation issues. AES, an electric power company, has no compensation unit at all. They don’t even have an HR department. Compensation functions are handled by teams of managers. Decentralizing certain aspects of pay design and administration has considerable appeal. Pushing these responsibilities (and expenses) close to the units, managers, and employees affected by them may help ensure that decisions are business-related. However, decentralization is not without dilemmas. For example, it may be difficult to transfer employees from one business unit to another. A pay system may support a subunit’s objectives but run counter to the overall corporate objectives. Also, we have seen time and again that decentralization, which by definition includes less direct control of what managers do, can contribute to legal problems. As noted in Chapter 17, for example, Walmart is facing sex-discrimination claims in what would be the largest class action discrimination suit to date (1.6 million or more claimants). Interestingly, Walmart has argued that “establishing a national class is unwarranted because its store managers acted with discretion” in their decisions
  • 35. regarding promotion and pay of workers. So, in effect, Walmart’s defense is that if its managers discriminated, it was because Walmart did not have centralized control over their decisions.50Flexibility within Corporatewide Principles The answers to these and related problems of decentralization can be found in developing a set of corporatewide principles or guidelines that all must meet. The principles may differ for each major pay technique. For example, GE’s business units worldwide have the flexibility to design incentive plans tailored to each unique business unit’s strategies and cultures. The only guidance is to ensure that the plans adhere to GE’s basic beliefs, improve financial and business objectives, and maintain or enhance GE’s reputation. 692 Keep in mind that the pay system is one of many management systems used in the organization. Consequently, it must be congruent with these other systems. For example, it may be appealing, on paper at least, to decentralize some of the compensation functions. However, if financial data and other management systems are not also decentralized, the pay system may be at odds with other systems.Reengineering and Outsourcing Value chain analysis and Six Sigma are processes used to improve quality and ensure that value is added by each technique and at each stage in a process. For the compensation system, the basic question to ask is, “Does each specific activity (technique) directly contribute to our objectives?” If some added value isn’t apparent, then the question is, “How should it be redesigned? Or should it be dropped?” Of those activities that do add value, the next question is, “Who should do it?” “Should the activity be done in-house, or can others do it more effectively? That is, should it be outsourced?” Outsourcing is a viable alternative as organizations struggle with activities that do not directly contribute to objectives. These are often referred to as transactional activities, which are not unique to the organization and might be done cheaper (and
  • 36. perhaps also better) by an outside provider. On the other hand, more transformational or strategic activities (e.g., what pay-for- performance strategy would best align with the business strategy) are less likely to be outsourced.51 Cost savings are the major potential advantage of outsourcing. All those compensation pros can be laid off and/or retrained and reassigned to other work. Sometimes, the quality of the service provided may increase also. A firm that does nothing but administer retirement benefits may be able to do a better job than a firm whose primary business is something else (e.g., making furniture or cars, selling quick service food). Major potential disadvantages include less responsiveness to unique employee–manager problems, less control over decisions that are often critical to all employees (i.e., their pay), and information leaks to rivals and competitors. In addition, as with any contract, while an agreement may be signed stating that an outsourcing firm will provide a certain set of services and at a certain level, either side may subsequently find that their vision of the agreement and their experience of what is actually delivered may end up being different.52Balancing Flexibility and Control One of the major attacks on traditional compensation plans is that they often degenerate into bureaucratic nightmares that hinder the organization’s ability to respond to competitive pressures. Some recommend reducing the controls and guidelines inherent in any pay plan. Hence, banding eliminates or at least reduces the impact of range maximums and minimums. Replacing merit grids with bonuses eliminates the link between the pay increase and the employees’ salary position in the range and performance rating. Replacing job evaluation with skill- or competency-based plans permits assigning employees to a variety of work, regardless of their pay. Such approaches are consistent with the oft-heard plea that managers should be free to manage pay. Or, as some more bluntly claim, pay decisions are too important to
  • 37. 693 be left to compensation professionals. Yet, permitting managers to be free to pay employees as they judge best rests on a basic premise: Managers will use pay to achieve the organization’s objectives—efficiency, fairness, and compliance with regulations—rather than their own objectives. But the ongoing leadership scandals in some corporations and public agencies casts doubt on this premise. Clearly, some balance between hidebound controls and chaos is required to ensure that pay decisions are directed at the organization’s goals yet permit sufficient flexibility to respond to unique situations. Achieving the balance becomes the art of managing compensation. A final issue related to pay design and administration is the skills and competencies required in compensation managers. The grandest strategy and structure may seem well designed, well thought out in the abstract, but could be a disaster if people qualified to carry it out are not part of the staff. In view of the importance of a well-trained staff, both WorldatWork and the Society of Human Resource Managers (SHRM) have professional development programs to entice readers into the compensation field.Making Information Useful—Compensation Enterprise Systems A friend of ours e-mailed from Shanghai that “six months after we have acquired this operation from the government, I still cannot get an accurate headcount. I do not know how many people we actually employ or who should get paychecks!” That manager clearly needs more information. But most managers find themselves overwhelmed with too much information. The challenge is to make the information useful. Compensation software transforms data into useful information and guides decision making. Many software packages that serve a variety of purposes are available.53 Some of them support employee self-service, by which employees can access their personal information, make choices about which health care coverage they prefer, allocate savings between growth or
  • 38. value investment funds, access vacation schedules, or check out a list of child or elder care service providers. Manager self- service helps managers pay their employees appropriately. Communication portals, designed for employees or managers, explain compensation policies and practices, answer frequently asked questions, and explain how these systems affect their pay.54 Other software processes transactions. It standardizes forms, performs some analysis, and creates reports at the click of the mouse. The advantage is that all employees at all locations are on the same system. While compensation software is proliferating, what remains a scarcer resource is the intellectual capital: the compensation knowledge and judgment required to understand which information, analyses, and reports are useful. Part of this intellectual capital includes analytical (read “statistical and math”) skills. Another part is knowledge of the business. A shortage of this knowledge among compensation managers not only limits the usefulness of compensation software but also limits the contribution of compensation management. Computers inevitably bring up the issue of confidentiality. If personal compensation data are accessible to employees and managers, privacy and security issues as well as ethical and legal issues emerge. Regulations vary around the world. The European Union 694 has issued the Data Privacy Directive, which is significantly stronger than U.S. regulations.55 Unauthorized users, both inside and outside the corporation, remain a threat.Ethics: Managing or Manipulating? Compensation ethics is not an oxymoron. But absent a professional code of behaviors and values, it is a challenge for compensation managers to ensure that their actions are ethical. The Web page for the compensation society, WorldatWork, includes the topic of ethics. Public discussion of ethics in compensation topics such as executive pay or backdating option grants benefits from the voices of informed compensation
  • 39. practitioners. Managing compensation ethically is increasingly complicated for several reasons. First, pay really matters; it is important to all of us. Second is the fierce pressure to achieve results. The increased use of pay for performance, which is based on results achieved and exceeding targets, can contribute to these pressures. However, assessing results sometimes has a “smoke and mirrors” feel to it. At an organization’s compensation strategy session that we attended, the chief financial officer observed that it was possible to “manage our reported earnings within several percentage points of the target. We can exceed analysts’ and shareholder expectations by 1 to 10 percent.” This was relatively easy for this particular company since about one- third of its earnings came from liquid investments in other companies. The remainder was revenue from its products and services. The implication of managing earnings for employees’ profit-sharing payouts and executive stock valuations were not ignored. The point is that measures of financial performance do not provide an immutable gold standard. They can be “managed.”56Where Is the Compensation Professional? Performance-based pay is not the only area that presents ethical dilemmas. Misusing and even failing to understand survey statistics, manipulating job evaluations, peer-company competitive data, masking overtime and pay discrimination violations, failure to understand that correlation does not mean causation, and recommending pay programs without addressing their expected costs and returns should force us to take a hard look at what we are doing.57 Stephen Landry, the former HR director at Sycamore Networks, reports that the company’s chief financial officer pressured him to change the hiring dates of some employees to make their stock option grants worth more money. These actions were to be kept hidden from the company auditors. Instead, Landry told executives these actions were unethical and probably illegal. He was fired. Internal memos from the company reveal a “risk assessment” of the action becoming exposed. Changing the date
  • 40. on documents was judged a low risk since the original grant “has been deleted from the system in its entirety.” Landry is suing and the SEC is investigating. If Mr. Landry’s experience is not enough for the professional compensation community, over at Cablevision, they backdated stock grants to a dead executive.58 A starting point to judge the ethics of our behavior may be our compensation model, presented with the advice: “Strive to achieve both efficiency and fairness.” 695 Your Turn Communication by Copier Deb Allen’s life-altering discovery at work really “communicated” her company’s pay practices. Swamped with work at an asset-management firm, she went into the office over the weekend and found a document abandoned on the copy machine. The document contained the base compensation, raises, performance ratings, and bonus information for 80 of her colleagues. Ms. Allen was outraged that a noted screw-up was making $65,000 a year more than more competent colleagues, while some new hires were earning almost $200,000 more than their counterparts with more experience. The discovery led her to question why she was working weekends for less pay than others were getting. “I just couldn’t stand the inequity of it,” she says. Three months later she quit. But Ms. Allen couldn’t bring herself to share the information with her colleagues. “I would have been better off not knowing any of that,” she explains. “I couldn’t give it to people who were still working there because it would make them depressed, like it made me depressed.” 1.How would you have reacted if you were Ms. Allen? Explain why. 2.Put yourself in the place of the compensation director at Ms. Allen’s company. Based on the pay model and what you now know about compensation, are there any possible business- and
  • 41. work-related explanations for what Ms. Allen observed (i.e., the screw-up getting $65,000 more; new hires earning $200,000 more than more-experienced employees; and Ms. Allen making less pay than others)? 3.As the compensation director, what would you do if Ms. Allen had brought you this document, and asked for your help in understanding what was going on. (Firing the person who left it on the copier is not an option. It may have been you.) Still Your Turn Managing Compensation Costs, Headcount, and Participation/Communication Issues Cisco Systems, Hewlett-Packard, American Airlines, and General Motors are examples of companies that have cut employment or cut wages and/or benefits to reduce labor costs in hopes of becoming more competitive and more profitable. Indeed, American and GM went through bankruptcy in part to gain control over labor costs. In contrast, some companies— Southwest Airlines, Nucor, and Lincoln Electric—have a no- layoff practice and do not appear to have cut 696 wages or benefits even in years when sales have declined significantly (They have also not gone through bankruptcy). What is the difference between these two sets of companies? Is it simply that one set of companies cares more about its employees than the other set of companies cares about its employees? Or, is it also the case that Southwest, Nucor, and Lincoln Electric have set up their compensation strategies in a way that makes them more able (than Cisco, HP, American, and GM) to cut labor costs when times are tough? (For more background, go to google.com or another search engine and conduct a separate search for each company using its name and the term “layoff.”) What about protecting investment in employees and employee relations? What can an employer do to make labor costs flexible so that profits do not take as much of a beating during difficult economic times and so that fewer employees need to be laid
  • 42. off? If you were in charge of designing a compensation system for a company that is fairly new but is now reaching a stage and size where it needs a formal compensation system, how would you design the compensation system to have labor cost flexibility? To what degree would you have others at the company participate in the design of the new compensation system? Who would participate? Would you follow a policy of pay openness in communicating your compensation system? Provide a rationale for your decisions.Summary We have now completed the discussion of the pay management process. Management includes control: control of the way managers decide individual employees’ pay as well as control of overall costs of labor. As we noted, some controls are designed into the fabric of the pay system (embedded controls). The salary budgeting and forecasting processes impose additional controls. The formal budgeting process focuses on controlling labor costs and generating the financial plan for the pay system. The budget sets the limits within which the rest of the system operates. We also noted that with the continuous change in organizations, compensation managers must understand how to manage change and be knowledgeable business partners. They are responsible for communicating information about pay in a way that treats employees fairly and honestly. The basic point is that pay systems are tools, and like any tools they need to be evaluated in terms of usefulness in achieving an organization’s objectives.Review Questions 1.How can employers control labor costs? 2.How does the management of the pay system affect pay objectives? 3.Why is the structure of the compensation function important? 4.Give some examples of how employers use inherent controls. 5.What activities in managing the pay system are likely candidates to be outsourced? Why? 6.Use Exhibit 18.13 to explain how the research on individual decision making can be used in pay communication.
  • 43. ndnotes 1.Sanford Jacoby, The Embedded Corporation (Princeton: Princeton University Press, 2005). 2.Felix Barber and Rainer Strack, “The Surprising Economics of a ‘People Business’,” Harvard Business Review, June 2005, pp. 81–90. 3.D. Scott, D. Morajda, T. McMullen, and R. Sperling, “Evaluating Pay Program Effectiveness,” WorldatWork Journal, 15(2), Second Quarter 2006, pp. 50–59. 4.Lindsay Scott, “Managing Labor Costs Using Pay-for- Performance,” Lindsay Scott & Associates, Inc., www.npktools.com. 5.Reward Transformation: Turning Rewards from Costs into an Investment (New York: Deloitte, 2006), www.deloitte.com. 6.Personal communication from B. Dunn, president, McLagan Partners; D. Scott, D. Morajda, T. McMullen, and R. Sperling, “Evaluating Pay Program Effectiveness,” WorldatWork Journal 15(2), Second Quarter 2006, pp. 50–59; John Boudreau and Peter Ramstad, “From ‘Professional Business Partner’ to ‘Strategic Talent Leader:’ What’s Next for Human Resource Management,” CAHRS Working Paper 02–10, Ithaca, NY. 7.B. Dunn, president, McLagan Partners; The Lake Wobegon Salary Survey, Lindsay Scott & Associates, Inc., www.npktools.com, 2006. 8.Allen Smith, “Layoffs in Europe: Deal or No Deal?” HR Magazine, January 2009, pp. 71–73. 9.Charlie O. Trevor and Anthony J. Nyberg, “Keeping Your Headcount When All About You Are Losing Theirs: Downsizing, Voluntary Turnover Rates, and the Moderating Role of HR Practices,” Academy of Management Journal 51 (2008), pp. 259–276. 10.Timothy Aeppel and Justin Lahart, “Lean Factories Find It Hard to Cut Jobs Even in Slump,” The Wall Street Journal, March 9, 2009, p. A1. 11.Erin White, “Retaining Employees before an Upturn Hits,” The Wall Street Journal, May 8,
  • 44. 2009, http://online.wsj.com/article/SB124178707883900633.htm l, September 14, 2009; Gray Yohe, “A Delicate Balance,” Human Resource Executive, March 2, 2009, www.hreonline.com/HRE/story.jsp?storyId=1815633178q uery=morale, September 14, 2009. 12.Clint Chadwick, Larry W. Hunter, and Stephen Walston, “Effects of Downsizing Practices on the Performance of Hospitals,” Strategic Management Journal 25 (2004), pp. 405– 427. 13.Charles Duhigg, “Hospital Clients Nurture Firm’s Scheduling Software,” Los Angeles Times, June 21, 2006, p. C1. 14.Susan Saulny and Robbie Brown, “On a Furlough, but Never Leaving the Cubicle,” The New York Times, June 15, 2009; Jonathan Buck, “British Airways Urges Staff to Work without Pay,” The Wall Street Journal, June 16, 2009; “The Quiet Americans: Employees Are Social in the Face of Pay Cuts and Compulsory Unpaid Leave,” The Economist, June 25, 2009, www.economist.com/world/unitedstates/displaystory.cfm? story_id=13915822, September 14, 2009. 15.Riva Richmond, “How to Cut Payroll Without Layoffs,” BusinessWeek, April 3, 2009, www.businessweek.com/magazine/content/09_64/s090404 8707309.htm, September 14, 2009; Matthew Boyle, “Cutting Work Hours Without Cutting Staff,” BusinessWeek, February 25, 2009, www.businessweek.com/magazine/content/09_10/b412205 5789445.htm, September 14, 2009. 16.Ron Lieber, “Et Tu, AARP? Good Guys Cut 401(k)s, Too,” The New York Times, June 27, 2009, p. B1. 17.Sandra Block, “Companies Rethink 401(k) Plan Contributions for Employees,” USA Today, June 24, 2009, www.usatoday.com/money/perfi/retirement/2009-06-24- 401kcontributions-economy_N.htm, September 14, 2009. 698 18.Michael Sanserino, “Pay Raises Are the Smallest in Decades,
  • 45. Surveys Show,” The Wall Street Journal, July 21, 2009; Aon Hewitt, Annual Salary Increase Survey, September 2011. 19.Aon Hewitt, Annual Salary Increase Survey, September 2011. 20.Carlos Tejada and Gary McWilliams, “New Recipe for Cost Savings: Replace Expensive Workers,” The Wall Street Journal, June 11, 2003, pp. 1, A12. 21.John Watson, “Delivering Total Compensation Online at Dell,” ACA News 42(4), April 1999, pp. 14–19. 22.Ronald T. Albright and Bridge R. Compton, Internal Consulting Basics (Scottsdale, AZ: American Compensation Association, 1996); John Watson, “Delivering Total Compensation Online at Dell,” ACA News 42(4), April 1999, pp. 14–19. 23.Jennifer Hicks, an Oklahoma State University student, has coined the term “yellow circle rates” while working as a compensation specialist for FastCat. Yellow circle rates result where if you give an employee the percent raise indicated by the merit increase grid, that employee would become red circled. For Walmart information, see Steven Greenhouse and Michael Barbaro, “Wal-Mart to Add Caps and Part-Timers,” The New York Times, October 2, 2006, p. B1. 24.WorldatWork. Promotional Guidelines 2010. December 2010. www.worldatwork.org/waw/adimLink?id=45914; accessed June 22, 2012. 25.M.J. Bidwell and J.R. Keller, “Promote or Hire? Comparing Make or Buy and Competing Process Views in a Professional Service Firm,” working paper, Wharton School, University of Pennsylvania. See the related article: Rachel Emma Silverman and Lauren Weber, “An Inside Job: More Firms Opt to Recruit From Within,” The Wall Street Journal, May 29, 2012. 26.Reward Transformation: Turning Rewards from Costs Into an Investment (New York: Deloitte, 2006), www.deloitte.com;D. Scott, D. Morajda, T. McMullen, and R. Sperling, “Evaluating Pay Program Effectiveness,” WorldatWork Journal 15(2), Second Quarter 2006, pp. 50–59.
  • 46. 27.Wayne Cascio, Responsible Restructuring: Creative and Profitable Alternatives to Layoffs (San Francisco: Berrett- Koehler, 2002); John Boudreau and Peter Ramstad, “Beyond Cost per Hire and Time to Fill: Supply-Chain Measurements for Staffing” (Los Angeles: Center for Effective Organizations, 2006); Jaap deJonge, Watson Wyatt Human Capital Index (New York: Watson Wyatt, 2003); S. Raza, Optimizing Human Capital Investments for Superior Shareholder Returns (New York: Hewitt Associates, 2006); M. Huselid and B. Becker, “Improving HR Analytical Literacy: Lessons from Moneyball,” chapter 32 in M. Losey, S. Meisinger, and D. Ulrich, The Future of Human Resource Management (Hoboken, NJ: Wiley, 2005); J. Burton and S. Pollack, “ROI of Human Capital: The United States and Europe,” Workspan, November 2006, pp. 28–27. 28.Ibid. 29.M. C. Sturman, C. O. Trevor, J. W. Boudreau, and B. Gerhart, “Is It Worth It to Win the Talent War? Evaluating the Utility of Performance-Based Pay,” Personnel Psychology 56 (2003), pp. 997–1035; Wayne Cascio and John Boudreau, Investing in People (Saddle River, NJ: Pearson Education, 2008); Mark A. Huselid, Brian E. Becker, and Richard W. Beatty, The Workforce Scorecard (Boston: Harvard Business School Press, 2005). 30.Peter F. Drucker, “They’re Not Employees, They’re People,” Harvard Business Review, February 2002, pp. 70–77. 31.Lee, T. H., B. Gerhart, I. Weller, and C. O. Trevor, “Understanding Voluntary Turnover: Path-Specific Job Satisfaction Effects and the Importance of Unsolicited Job Offers,” Academy of Management Journal, 51 (2008), 651–671. 32.Laszlo Bock, Work Rules! (Twelve, 2015). Daniel, Freedman, “Silicon Valley Star Search.” Wall Street Journal, April 7, 2015., p. A11. Call, M. L., Nyberg, A. J., & 699 Thatcher, S. M. B. (2015, March 30). Stargazing: An Integrative Conceptual Review, Theoretical Reconciliation, and Extension for Star Employee Research. Journal of Applied Psychology.
  • 47. Advance online publication. 33.Michael Beer and Mitin Nohria, “Cracking the Code of Change,” Harvard Business Review, May–June 2000, pp. 133– 141; Dave Ulrich, “A New Mandate for Human Resources,” Harvard Business Review, January–February 1998, pp. 125–134. 34.“Growing Worker Confusion about Corporate Goals Complicates Recovery, Watson Wyatt WorkUSA Study Finds,” Watson Wyatt news release, September 9, 2002. 35.Robert L. Heneman, Paul W. Mulvey, and Peter V. LeBlanc, “Improve Base Pay ROI by Increasing Employee Knowledge,” WorldatWork Journal 11(4), Fourth Quarter 2002, pp. 22–27. 36.A. Bandura, Social Learning Theory (New York: General Learning Press, 1977); E.E. Lawler, Pay and Organizational Effectiveness: A Psychological View (New York: McGraw-Hill, 1977). 37.Federal Register/Vol. 79, No. 180/Wednesday, September 17, 2014/Proposed Rules. Department of Labor, Office of Federal Contract Compliance Programs, 41 CFR Part 60–1 RIN 1250–AA06. Government Contractors, Prohibitions Against Pay Secrecy Policies and Actions. Notice of proposed rulemaking. 38.Thomas A. Mahoney and William Weitzel, “Secrecy and Managerial Compensation,” Industrial Relations 17(2), 1978, pp. 245–251; Julio D. Burroughs, “Pay Secrecy and Performance: The Psychological Research,” Compensation Review, Third Quarter 1982, pp. 44–54; George Milkovich and P. H. Anderson, “Management Compensation and Secrecy Policies,” Personnel Psychology 25 (1972), pp. 293–302. 39.Adrienne Colella, Ramona Paetzold, Asghar Zardkoohi, and Michael Wesson, “Exposing Pay Secrecy,” Academy of Management Review 32 (2007), pp. 55–71; Renae Broderick and Barry Gerhart, “Non-Wage Compensation,” in The Human Resource Management Handbook, Part 3; David Lewin, Daniel J. B. Mitchell, and Mahmood A. Zaidi, eds. (Greenwich, CT: JAI Press, 1997), pp. 95–135.
  • 48. 40.P. Bamberger and E. Belogolovsky, “The Impact of Pay Secrecy on Individual Task Performance,” Personnel Psychology63, 2010, pp. 965–966. 41.Card, David, et al., “Inequality at Work: The Effect of Peer Salaries on Job Satisfaction,” The American Economic Review102(6), (2012): 2981–3003. 42.Belogolovsky, Elena, and Peter A. Bamberger, “Signaling in Secret: Pay for Performance and the Incentive and Sorting Effects of Pay Secrecy,” Academy of Management Journal 57(6), (2014): 1706–1733. 43.M. Wilson, G. B. Northcraft, and M. A. Neale, “The Perceived Value of Fringe Benefits,” Personnel Psychology 38 (1985), pp. 309–320. 44.John A. Rubino, Communicating Compensation Programs (Scottsdale, AZ: American Compensation Association, 1997). 45.Jared Sandberg, “Why You May Regret Looking at Papers Left on the Office Copier,” The Wall Street Journal, June 20, 2006, p. B1; John Case, “When Salaries Aren’t Secret,” case study, Harvard Business Review, May 2001. 46.A. Tversky and D. Kahneman, “The Framing of Decisions and the Psychology of Choice,” Science 211 (1981), pp. 453– 458; C. F. Camerer and U. Malmendier, “Behavioral Organizational Economics,” July 8, 2006, working paper available from www.hss.caltech.edu/camerer/SS200/SS200.html; Sharla A. Stewart, “Can Behavioral Economics Save Us From Ourselves?” University of Chicago Magazine 97(3), February 2005, www.magazine.uchicago.edu/0502/features/economics.sht ml. 700 47.Dori Meinert, “An Open Book: Involving Employees in Business Decisions Can Improve the Bottom Line. That’s Why Fans of Open-Book Management Are So Dedicated to the Approach,” HR Magazine, April 2013, pp. 43–46. “Rethinking Ways to Present Financial Information to
  • 49. Employees,” Employee Ownership Report, March/April 2000, pp. 7, 10; Jack Stack and Bo Burlingham, The Great Game of Business (New York: Currency Doubleday, 1992); Jack Stack and Bo Burlingham, A Stake in the Outcome (New York: Currency Doubleday, 2002); John Case, “Opening the Books,” Harvard Business Review, March–April, 1996, pp. 118–127. 48.HR Services Delivery Research Report, Towers Perrin, 2005, www.towersperrin.com; “The Psychology of Change Management,” McKinsey Quarterly, July 2006. 49.Dave Ulrich, Jon Younger, and Wayne Brockbank, “The Next Evolution of the HR Organization,” in The Routledge Companion to Strategic Human Resource Management, John Storey, Patrick M. Wright, and Dave Ulrich, eds. (London and New York: Routledge, 2009), pp. 182–203. 50.Alexandria Sage, “Wal-Mart Sex Discrimination Case Back in Court,” Reuters, March 25, 2009, www.reuters.com/article/topNews/idUSTRE52O0P820090 325. 51.Stephen Miller, “Companies Continue to Selectively Outsource HR Programs,” HRMagazine (2009), p. 76; Dave Ulrich and Wayne Brockbank, The HR Value Proposition (Boston, MA: Harvard Business School Press, 2005); Brian S. Klaas, “Outsourcing and the HR Function: An Examination of Trends and Developments Within North American Firms,” International Journal of Human Resource Management 19 (2008), pp. 1500–1514. 52.Michael Skapinker, “Much to Question on Outsourcing,” Financial Times, June 30, 2003, p. 4. 53.A useful guide on selecting HR software is James G. Meade, The Human Resources Software Handbook (San Francisco: Jossey-Bass/Pfeiffer, 2003); Mark L. Lengnick-Hall and Steve Moritz, “The Impact of e-HR on the Human Resource Management Function,” Journal of Labor Research, Summer 2003, pp. 365–379. 54.Diane Palframan, HR Technology Strategies (New York:
  • 50. Conference Board, 2003); James H. Dulebohn and Janet H. Marler, “e-Compensation: The Potential to Transform Practice?” in Brave New World of e-HR: Human Resources in the Digital Age, H. Gueutal and D. Stone, eds. (San Francisco: Jossey Bass, 2005), pp. 138–165. 55.Privacilla, www.privacilla.org/business/eudirective.html. 56.Flora Guidry, Andrew J. Leon, and Steve Rock, “Earnings- Based Bonus Plans and Earnings Management by Business-Unit Managers,” Journal of Accounting and Economics 26 (1999), pp. 113–142. 57.Joseph P. O’Connor, Jr., Richard L. Priem, Joseph E. Coombs, and K. Matthew Gilley, “Do CEO Stock Options Prevent or Promote Fraudulent Financial Reporting?” Academy of Management Journal, June 2006, pp. 483–500; Frederic W. Cook, “Compensation Ethics: An Oxymoron or Valid Area for Debate?” Featured speech at ACA International Conference Workshop, 1999; Barrie Litzky, Kimberly Eddleston, and Deborah Kidder, “The Good, the Bad, and the Misguided: How Managers Inadvertently Encourage Deviant Behaviors,” Academy of Management Perspectives, February 2006, pp. 91–102; Gretchen Morgenson, “Advice on Boss’s Pay May Not Be So Independent,”The New York Times, April 10, 2006, p. B1. The WorldatWork Ethics Initiative is described on their website, www.worldatwork.org. Also see their WorldatWork Standards of Professional Practice. 701 58.John Hechinger and James Bandler, “In Sycamore Suite, Memo Points to Backdating Claims,” The Wall Street Journal, July 12, 2006, p. A3. Also see C. Forelle, J. Bandler, and Steve Stecklaw, “Brocade Ex-CEO, 2 Others Charged in Options Probe,” The Wall Street Journal, July 21, 2006, p. A1, A8; Peter Grant, James Bandler, and Charles Forelle, “Cablevision Gave Backdated Grant to Dead Official,” The Wall Street Journal, September 22, 2006, pp. A1, A8; Della Bradshaw, “MBA Students ‘Cheat the Most,’” Financial Times, September 21, 2006, p. 8.
  • 51. Key figuresDeutsche Post AG - Interim Report as at 30 June 2017Selected key figuresH1 2016H1 2017+/- %Q2 2016Q2 2017+/- %Revenue€m28,06229,6965.814,19014,8134.4Profit from operating activities (EBIT)€m1,6251,7266.275284111.8Return on sales1%5.85.8- 5.35.7-EBIT after asset charge (EAC)€m8569328.936644521.6Consolidated net profit for the period2€m1,1801,2354.754160211.3Free cash flow€m-1,300- 4596.5-600385>100Net debt3€m2,2613,57558.1---Earnings per share4€0.981.024.10.450.5011.1Number of employees5508,036508,9280.2---1 EBIT/revenue.2 After deduction of non-controlling interests.3 Prior-period amount as at 31 December, for the calculation see page 6 of the Interim Group Management Report.4 Basic earnings per share.5 Headcount at the end of the first half of the year, including trainees; prior-period amount as at 31 December. Key figures Revenue (€m) Time (FY) Amount(€m) Revenue (€m) for DHL 1 Research Analysis for Business – The Logistics Business Environment In US 7 Research Analysis for Business – The Logistics Business Environment In US