SlideShare a Scribd company logo
1 of 10
Download to read offline
0.0
20.0
40.0
60.0
80.0
100.0
1999-2000 2003-2004
Rest of Maharashtra
Raigarh
Thane
Mumbai
Share of MCGM in Maharashtra’s Net Domestic Product
Source: Economic survey of Maharashtra.
2. ECONOMIC PROFILE
Mumbai Metropolitan Region accounts for about USD 15 bn out of Maharashtra’s economy
(NSDP) of about USD 37 bn – about 40 per cent of the total size of the state’s economy.
Greater Mumbai alone contributed about USD 10 bn to the state’s economy.
Mumbai contributes to 33% of income tax collections, 60% of customs duty collections, 20%
of central excise tax collections, 40% of India’s foreign trade and a significant quantum to
corporate taxes.
Although the city of Mumbai has prominently figured as the hub of economic activity in the
nineties, one is witnessing the reduction in contribution of MMR districts to India’s GDP.
Mumbai, at present, is in reverse gear, as regards the economic growth and quality of life.
Table 7: NDDP and Per Capita NDDP of Districts in MMR and their share in Maharashtra
NDDP (at Constant
Prices) in bn USD
% Share in NSDP Per Capita NDP (at
Constant Prices) in USD
Sl. District
1999-00 2003-04 1999-00 2003-04 1999-00 2003-04
1 Mumbai 7.82 9.66 24.96 26.45 670 781
2 Thane 3.05 3.71 9.74 10.16 398 412
3 Raigarh 1.02 0.91 3.26 2.49 472 399
4 Total MMR 11.89 11.96 37.90 39.10 554 604
5 Maharashtra 31.33 36.52 100.00 100.00 332 363
Source: Economic Survey of Maharashtra, 2003-04
The GDP growth in Greater
Mumbai is surprisingly low at
2.4 per cent per annum (1998-
2002). And this slow down has
undoubtedly affected the
growth of Maharashtra, since
Mumbai and its surrounding
regions contribute over 35 per
cent of the state's GDP. The
quality of life in Mumbai has
also worsened and the decline
is quite steep. Slums have
proliferated and congestion,
pollution and water problems have skyrocketed. The situation is likely to worsen over the
next decade with an increase in population, precipitating in an increased pressure for
provision of basic infrastructure services.
2.1. Industrial Development
Greater Mumbai is dominated by tertiary sector (wholesale and retail trade, transport, storage
and communications, finance, insurance, information technology, real estate, community,
social and personal services) followed by secondary sector (manufacturing and repair,
electricity, gas and water construction). This is in contrast to the situation in rest of MMR,
wherein secondary sector is dominating in NDP contribution.
Unlike the earlier dominance of heavy industry in contribution to economic output of the
region, sectors such as gems & jewellery, leather & leather products, IT & ITES along with
tourism/entertainment are contributing significantly to the economic growth of the region
today. Some of the key sectors contributing to the city’s economy are discussed below.
a. Gems & Jewellery: The exports of Gems & Jewellery from Mumbai have risen from Rs
5000 crore in 1990-91 to Rs 45,000 crore in 2003-042
. Exports of gems and jewellery
have provided significant employment in the region. On the other hand SEEPZ alone
handled import of Rs 2000 crore (2003-04) of rough diamonds, gold bars, stones, C&P
diamonds, silver bars and platinum.
b. Leather: Leather industry occupies a place of prominence in the Indian economy in view
of its massive potential for employment, growth and exports. India is the largest livestock
holding country, having an annual production value of USD 4 billion providing
employment to 2.50 million people. There is a potential for technology inflow and
foreign direct investment in the sector. Mumbai is the major production center of leather
and leather products in the Western region3
The leather industry is poised for major growth in the coming decade. It is hoped that
Maharashtra will play a significant role in increasing India’s share of international
leather trade. In fact, because of globalization of the Indian economy, numerous
opportunities are available for the state’s sustained growth in this sector. The leather
and leather product industries of Maharashtra are centered on Mumbai, the inherent
strengths being a comfortable raw material base, skilled labor and the already well-
established leather/leather goods industry.
2
Source: Gems & Jewellery Export Promotion Council
3
Source: Council of Leather Exports
c. IT & ITES: IT & ITES is another promising industry in the city. The State Government
has a visionary IT policy to make it attractive for companies to set up shop in the state.
Mumbai is home to some of the finest educational institutions in the country ensuring a
steady supply of trained technical manpower to the IT and ITES industry. The state
accounts for more than 30% of the country’s software exports, with over 1200 software
units based in the state, thus providing a familiar and friendly environment for IT
companies. Besides, over 35% of the country’s PC’s and 32% of internet subscribers are
in the state of Maharashtra.
d. Textiles: Textiles is another industry of strategic importance to the state, contributing to
27% of India’s total exports, holding immense future potential in global markets
particularly in value added segments like garments and ready to wear goods.
e. Entertainment: Another promising sector is the entertainment sector. A robust macro
economic environment with GDP target at an annual 8% growth will not only ensure a
conducive environment for the environment industry, but has also resulted in an
increased demand for entertainment. Indian film industry, one of the drivers of
entertainment in the country has revenues of Rs 4500 crore (2003) and expected to grow
at a compounded annual growth of 18% to gross Rs 10,100 crore by 20084
. The growth
drivers in this segment are increase in multiplexes, advent of digital technology, creating
films as brands through corporate tie-ups, merchandising etc and corporatization with
producers adopting a more structure approach to film production.
Besides, revenues from television are expected to grow at a compounded annual growth
rate of 17% over the next five years to gross Rs 28, 852 crore by 2008 and a significant
portion of this growth is expected from the subscription stream.
The Indian music industry has stabilized in 2003, after recording a significant correction
in 2002 – the revenues are approx Rs 1000 crore in 2003.
The live entertainment segment has grown by 60% over 2002 and is expected to sustain
this growth over the foreseeable future. For the organized sector, revenues stood at nearly
Rs 580 crore in 2003. Many event managers believe that the next big thing for this
segment will be sports based events, celebrity management and conventions and
seminars.
The Indian entertainment industry is in an enviable position – it operates within a robust
macro economic framework and the Indian creative product is fast becoming a global
power-brand. The domestic scenario is bursting with prospects and the industry seems
ideally positioned to capitalize on them.
Whether it is infrastructure that will guarantee an improved cinematic experience or a
television distribution mechanism that provides choice to a consumer at an affordable
4
Source: Ernst and Young
price and ensure fair sharing of revenues across players – by strengthening its
fundamentals, Mumbai, as the heart of film production and entertainment, should
leverage this opportunity to significantly enhance its economic growth in the next few
years.
As proactive step to promote industrial development in the city and the MMR, Government
of Maharashtra has proposed a new Industrial Location Policy, which is expected to be
announced shortly. This policy envisages promoting non-polluting, hi-tech and high value
added industries within Mumbai (all industries listed under Schedule 1 of the Policy).
2.2. Employment
Greater Mumbai is the major employment hub in MMR, accounting for about 74 per cent of
the total employment in MMR, followed by Navi Mumbai – which is an upcoming potential
economic hub – Kalyan, Bhiwandi and Thane.
As per latest available figures (1998), the total employment in Greater Mumbai is about 2.63
million, of which majority of the employment is in the tertiary sector. There has been a
steady shift in employment from the secondary to tertiary sector in Greater Mumbai, as
evident from Table 8. However, the growth in overall employment has been very low at just
about 1 per cent per annum during 1980 to 1998. While this decline may be attributed
partially to IT applications in the tertiary sector, it is largely due to growing unemployment in
the city and region as a whole.
Table 8: Employment Pattern and Growth Trends in Greater Mumbai
1980 1998
Sl. Sector
Employment % Share Employment % Share
CAGR (%)
1 Primary 24,009 1.09 7,059 0.27 -6.57
2 Secondary 805,468 36.62 492,030 18.74 -2.70
3 Tertiary 1,369,904 62.29 2,126,659 80.99 2.47
Total 2,199,381 100.00 2,625,748 100.00 0.99
Source: Population & Employment Profile of Mumbai Metropolitan Region, Planning Division, MMRDA,
September 2003.
The age specific work participation rates in the years 1981 and 91 are presented in the table
below. Less than 2% of the boys in the 5-15 age group and less than 1% of the girls in the
same age group were reported as workers in 1991. More significantly, in 1991, men were
economically less active for all age groups vis-à-vis the scenario in 1981.
Table 9: Age-specific Work Participation Rates
Age Group
(years)
Work Participation
Rates 1981 (%)
Work Participation
Rates 1991 (%)
Males Females Males Females
5-15 1.2 0.5 1.8 0.7
15-19 29.8 6.3 27.9 6.9
20-24 70.7 18.2 67.4 16.0
25-29 90.0 15.8 89.4 17.3
30-34 94.5 16.1 94.4 18.8
35-39 95.4 16.1 95.1 20.3
40-49 95.0 15.4 93.9 19.8
50-59 85.5 12.1 83.5 14.3
60+ 39.8 4.4 31.6 4.3
All Ages 54.9 8.6 54.3 10.5
15+ 77.0 13.3 74.8 15.1
Mumbai is the financial center of the country, with majority of the financial business
domiciled in the country. This is facilitated with the presence of the Bombay Stock
Exchange, National Stock Exchange, the financial sector regulators such as SEBI, the
headquarters of major banks and financial entities and lender of last resort, the headquarters
of the Reserve Bank of India. It is in this context that the city provides significant formal and
informal employment in the financial sector. An estimate of the same is presented in Table
10.
Table 10: Formal & In-formal Employment
Year
Total
employment
(Male + Female)
Formal employment
(Male + Female)
Informal
employment
(Male + Female)
Share of informal
in total
employment (%)
1992 114,621 79,071 35,550 31.11
1993 117,646 80,025 37,621 31.98
1994 120,782 80,621 40,161 33.25
1995 124,035 81,268 42,767 34.48
1996 127,412 82,319 45,093 35.39
1997 130,915 81,866 49,049 37.47
(CAGR %) 2.66 0.69 6.44
Total employment in the financial sector in Mumbai increased at 2.66 per cent per annum
compound between 1992 and 1997. The share of the formal sector in total employment
declined and that of the informal sector increased between 1992 and 1997
Within Greater Mumbai, there has been a shift in the spatial distribution of employment in
Greater Mumbai. The employment in the Island City, which constituted 71.8% of the total
employment in 1971, is reduced to 55.7% in 1990. This is mainly on account of marked
decline in the manufacturing sector employment. Similarly, the office sector employment,
which has increased in Greater Mumbai from 3.52 lakh in 1980 to 6.29 lakh in 1990, the
share of CBD of Greater Mumbai (A to D Ward) has reduced from 54.7% to 47.5% over this
period. Further, a trend of growth of smaller establishments i.e. those employing less than
five persons is now firmly set in Greater Mumbai.
2.3. Other Economic Indicators
Mumbai has been the hub of financial, trading and economic activity in the country. Jawahar
Lal Nehru port is the busiest port in the country. The average turnaround time at both JNPT
and MPT has been declining. The average output per ship berth day has shown an increase at
both JNPT and MPT. Although the ports are handling significant trade volumes, substantial
investments need to be undertaken in order to position them as truly world-class ports
capable of handling efficiently the ever-increasing trade of the country.
Table 11: Performance parameters for Major Ports
JNPT MPT
Item
1993-94 1998-99 1993-94 1998-99
Average turnaround time (days) 4.25 3.38 8.75 6.94
Average pre-berthing time (days) 0.83 1.38 2.41 1.91
Average output per ship berth days (tonnes) 2800 6886 2647 2800
Mumbai holds an envious position as regards the passenger traffic at airports, in handling
30% of the air passenger traffic in the country.
Table 12: Passenger Traffic at Airport
Year Mumbai Airport
All Airports
(India)
Mumbai Share (India%)
1995-96 11,117,400 37,013,800 30
1996-97 11,067,400 36,489,900 30
1997-98 11,010,606 36,530,693 30
1998-99 11,018,557 36,989,419 30
1999-00 11,532,144 39,004,933 30
Mumbai handles about 35% of the cargo traffic in the country. This generates substantial
employment, and a sizeable labor force resides nearby port area. Besides, such a quantum of
trade volume at the port places pressure on nearby infrastructure. The associated
infrastructure such as availability of dedicated road connectivity and its integration with rail
connectivity to the hinterland needs to be provided for in the development plan
Table 13: Cargo Traffic at Mumbai Airport
Year Mumbai All Airports
Mumbai's Share
in India %
Figures in Tonnes
1995-96 234,650 649,369 36
1996-97 254,600 680,100 37
1997-98 253,616 705,886 36
1998-99 243,584 699,150 36
1999-00 276,694 797,443 35
Of the Capital Investment in Large and Medium Industries across the state of Maharashtra,
Mumbai attracts significant investments. Approximately, 40% of the capital investments are
cornered by Mumbai
Table 14: Capital Investment in Large & Medium Industries
Greater Mumbai Maharashtra
Year
Rs Crore
% share of Mumbai in Maharashtra
1993 28,682 48,264 59
1996 28,701 54,398 53
1998 29,357 61,542 48
2000 30,573 72,873 42
Bulk of the financial business is conducted in Mumbai’s financial centers namely the
erstwhile Nariman Point and presently Bandra Kurla Complex. Dominance of Mumbai in
both the credit offtake and deposit mobilization can be assessed from Table 15.
Table 15: Scheduled Commercial Banks % share of Top Metro Centers in Credit
% share in Credits
March 1999 March 1991 March 1986
Cities
% share of credits in all-India total
Mumbai 20.93 17.76 19.62
Delhi 14.03 10.97 8.12
Chennai 6.03 5.28 4.38
Calcutta 4.7 6.08 6.32
All-India 100.0 100.0 100.0
Table 16: Scheduled Commercial Banks - Share of Metros in Deposits
% share in Deposits
March 1999 March 1991 March 1986
Cities
% share of deposits in all-India total
Mumbai 14.19 14.8 12.82
Delhi 10.43 9.09 9.61
Calcutta 4.09 6.03 6.81
Chennai 2.71 2.95 2.48
All-India 100.0 100.0 100.0
Scheduled commercial banks are able to mobilize 13% of the deposits in Mumbai and able to
disburse credit of approx 20% of the total credit given by banks at Mumbai.
2.3.1 Doing Business in Mumbai (Maharashtra)5
Every economy has established a complex system of laws and institutions intended to protect
the interest of workers and to guarantee a minimum standard of living for its population. The
attractiveness of a region/state in the country is a factor of indicators such as:
a. Entry Regulation: Punjab at 57 days takes the shortest time to start a business vis-à-vis
Andhra Pradesh (68 days). Maharashtra is way behind at 89 days. In terms of cost to start
a business Mumbai (Maharashtra) is 49.5% of per capita gross national income, in
comparison to Punjab (44.1%) and Tamil Nadu (47.3%). Analysis shows that
burdensome entry regulations hold back private investment, push more people into the
informal economy, increase consumer prices and fuel corruption.
b. Registering Property: In terms of taking time to register property, time taken is 67 days in
Mumbai (Maharashtra) in comparison to 35 days in Bangalore (Karnataka). The least
cost region as regards cost to register property is 10.2% of property value in Punjab,
whereas its is 13.9% for Mumbai (Maharashtra). Efficient property registration reduces
transaction costs and helps keep formal title from slipping to informal status. Simple
procedures to register property are also associated with more perceived security of
property rights and less corruption.
5
Doing Business in India 2005, World Bank and IFC Washington
c. Contract Enforcement: Contract enforcement is critical for business to engage with new
borrowers or customers. Although time to enforce a contract is the least at 425 days in
Mumbai (Maharashtra), the cost to enforce a contract is high at 43.1% of per capita gross
national income. In comparison, the cost to enforce a contract is significantly lower for
states such as Karnataka (12.9%), Andhra Pradesh (13.8%) and Punjab (24.7%).
d. Bankruptcy: Recent economic crises in emerging markets, from East Asia, to Latin
America, to Russia and Mexico, have raised concerns about the design of bankruptcy
systems and the ability of such systems to help reorganize viable companies and close
down unviable ones. An entity takes 10 years in Mumbai (Maharashtra) to go through
insolvency in comparison to 8.33 years in Karnataka and 9.5 years in Tamil Nadu and
Andhra Pradesh. On the other hand, the recovery rate (cents on the dollar) is only 12.50
for Mumbai (Maharashtra) in comparison to 16.61 for Bangalore (Karnataka) and 14.63
for Chennai (Tamil Nadu)
e. Construction Regulation: It takes 187 days to legally build warehouse in Mumbai
(Maharashtra) in comparison to 130 days in Hyderabad (Andhra Pradesh). In term of cost
to legally build a warehouse Mumbai (Maharashtra) is lagging behind at 880% of per
capita gross national income. The cost is 622% of per capita gross national income for
Andhra Pradesh.
In conclusion, with the vibrant economic profile, Mumbai offers several potential advantages
and can leverage this existing potential for growth. To evolve as a Regional Financial Center,
to capitalize on the entertainment industry exports or the leather and gems & jewellery
exports, Mumbai has to change its course for supporting its economy and businesses and
meet the challenges of transforming into a city offering world-class infrastructure, citizen
friendly services and a business friendly environment.
The economic growth therefore
needs to be carefully supported
with linkages and reforms.
Being constrained due to land
availability, Mumbai draws
upon support from neighboring
areas. Major ports (JNPT and
Rewas-Aware) and new airport
are positioned outside Mumbai.
The hinterland beyond Greater
Mumbai also serves as the area
potentially available for
development, which houses
workforce as well as markets. The connectivity to hinterland is therefore important
recognizing the fact that about 50% commuters traveling to Mumbai are from hinterland.
With proposed development of the hinterland and the felt need for better connectivity to
boost the economy of the region, transportation and avenues for public transport assume
significance. A number of strategic initiatives are proposed under the plan, which would
support the overall economic activity of the city as well as the Mumbai Metropolitan Region.
Economic development should therefore be all encompassing covering areas that will boost
economic activity (e.g. development of infrastructure and industrial/commercial activities
which will provide job opportunities), provision of support systems such as transportation,
water supply and sanitation, health and education, that would complement economic
development and the policy and legal frameworks that are required to facilitate investments
and bring about development.

More Related Content

Similar to Economic profile mumbai.pdf

global perspectives(mgmt-(8110)SEC-7(SEM-2019’FALL’)ASSIGNMENT.docx
global perspectives(mgmt-(8110)SEC-7(SEM-2019’FALL’)ASSIGNMENT.docxglobal perspectives(mgmt-(8110)SEC-7(SEM-2019’FALL’)ASSIGNMENT.docx
global perspectives(mgmt-(8110)SEC-7(SEM-2019’FALL’)ASSIGNMENT.docxshericehewat
 
MSME Financing - Key Issues and Solutions
MSME Financing - Key Issues and Solutions MSME Financing - Key Issues and Solutions
MSME Financing - Key Issues and Solutions Resurgent India
 
Impact of budget 2010 on capital market
Impact of budget 2010 on capital marketImpact of budget 2010 on capital market
Impact of budget 2010 on capital marketAbhishek
 
The future looks bright for msme sector
The future looks bright for msme sectorThe future looks bright for msme sector
The future looks bright for msme sectorjojisjoseph
 
It and ites sector in india
It and ites sector in indiaIt and ites sector in india
It and ites sector in indiaVivaswan Pathak
 
Final budget
Final budgetFinal budget
Final budgetMeda Rao
 
Indian cement industry report
Indian cement industry report Indian cement industry report
Indian cement industry report js slides
 
Retail evolution trends & business ppt @ bec doms
Retail evolution trends & business  ppt @ bec domsRetail evolution trends & business  ppt @ bec doms
Retail evolution trends & business ppt @ bec domsBabasab Patil
 
Role of make in india in economic development
Role of make in india in economic developmentRole of make in india in economic development
Role of make in india in economic developmentNEETHU S JAYAN
 
Ch 9 MSME & E D (1).pdf
Ch 9 MSME & E D (1).pdfCh 9 MSME & E D (1).pdf
Ch 9 MSME & E D (1).pdfSAISURYAN
 
Ppt presentation (2)
Ppt presentation (2)Ppt presentation (2)
Ppt presentation (2)Vikram Rapria
 
European businessgroup india and retail landscape 4th feb 10v1 5
European businessgroup   india and retail landscape 4th feb 10v1 5European businessgroup   india and retail landscape 4th feb 10v1 5
European businessgroup india and retail landscape 4th feb 10v1 5sanamkalra
 
Employment trends in india
Employment trends in indiaEmployment trends in india
Employment trends in indiaLal Sivaraj
 
High Growing Economic Sectors “Opportunity For Entrepreneurs ” in India fo...
  High Growing Economic Sectors  “Opportunity For Entrepreneurs ” in India fo...  High Growing Economic Sectors  “Opportunity For Entrepreneurs ” in India fo...
High Growing Economic Sectors “Opportunity For Entrepreneurs ” in India fo...karrox
 

Similar to Economic profile mumbai.pdf (20)

global perspectives(mgmt-(8110)SEC-7(SEM-2019’FALL’)ASSIGNMENT.docx
global perspectives(mgmt-(8110)SEC-7(SEM-2019’FALL’)ASSIGNMENT.docxglobal perspectives(mgmt-(8110)SEC-7(SEM-2019’FALL’)ASSIGNMENT.docx
global perspectives(mgmt-(8110)SEC-7(SEM-2019’FALL’)ASSIGNMENT.docx
 
MSME Financing - Key Issues and Solutions
MSME Financing - Key Issues and Solutions MSME Financing - Key Issues and Solutions
MSME Financing - Key Issues and Solutions
 
Impact of budget 2010 on capital market
Impact of budget 2010 on capital marketImpact of budget 2010 on capital market
Impact of budget 2010 on capital market
 
The future looks bright for msme sector
The future looks bright for msme sectorThe future looks bright for msme sector
The future looks bright for msme sector
 
It and ites sector in india
It and ites sector in indiaIt and ites sector in india
It and ites sector in india
 
Assignment of ied
Assignment of iedAssignment of ied
Assignment of ied
 
article_on_msme.pdf
article_on_msme.pdfarticle_on_msme.pdf
article_on_msme.pdf
 
Final budget
Final budgetFinal budget
Final budget
 
Indian cement industry report
Indian cement industry report Indian cement industry report
Indian cement industry report
 
Retail evolution trends & business ppt @ bec doms
Retail evolution trends & business  ppt @ bec domsRetail evolution trends & business  ppt @ bec doms
Retail evolution trends & business ppt @ bec doms
 
Role of make in india in economic development
Role of make in india in economic developmentRole of make in india in economic development
Role of make in india in economic development
 
Ch 9 MSME & E D (1).pdf
Ch 9 MSME & E D (1).pdfCh 9 MSME & E D (1).pdf
Ch 9 MSME & E D (1).pdf
 
Ppt presentation (2)
Ppt presentation (2)Ppt presentation (2)
Ppt presentation (2)
 
European businessgroup india and retail landscape 4th feb 10v1 5
European businessgroup   india and retail landscape 4th feb 10v1 5European businessgroup   india and retail landscape 4th feb 10v1 5
European businessgroup india and retail landscape 4th feb 10v1 5
 
Employment trends in india
Employment trends in indiaEmployment trends in india
Employment trends in india
 
Services Sector
Services SectorServices Sector
Services Sector
 
High Growing Economic Sectors “Opportunity For Entrepreneurs ” in India fo...
  High Growing Economic Sectors  “Opportunity For Entrepreneurs ” in India fo...  High Growing Economic Sectors  “Opportunity For Entrepreneurs ” in India fo...
High Growing Economic Sectors “Opportunity For Entrepreneurs ” in India fo...
 
Report on Procter & Gamble (P&G)
Report on Procter & Gamble (P&G) Report on Procter & Gamble (P&G)
Report on Procter & Gamble (P&G)
 
Growing sectors of india
Growing sectors of indiaGrowing sectors of india
Growing sectors of india
 
Mets 2010 Indicus - MaFoi Randstad
Mets 2010 Indicus - MaFoi RandstadMets 2010 Indicus - MaFoi Randstad
Mets 2010 Indicus - MaFoi Randstad
 

Recently uploaded

Week-01-2.ppt BBB human Computer interaction
Week-01-2.ppt BBB human Computer interactionWeek-01-2.ppt BBB human Computer interaction
Week-01-2.ppt BBB human Computer interactionfulawalesam
 
Unveiling Insights: The Role of a Data Analyst
Unveiling Insights: The Role of a Data AnalystUnveiling Insights: The Role of a Data Analyst
Unveiling Insights: The Role of a Data AnalystSamantha Rae Coolbeth
 
Carero dropshipping via API with DroFx.pptx
Carero dropshipping via API with DroFx.pptxCarero dropshipping via API with DroFx.pptx
Carero dropshipping via API with DroFx.pptxolyaivanovalion
 
VIP High Profile Call Girls Amravati Aarushi 8250192130 Independent Escort Se...
VIP High Profile Call Girls Amravati Aarushi 8250192130 Independent Escort Se...VIP High Profile Call Girls Amravati Aarushi 8250192130 Independent Escort Se...
VIP High Profile Call Girls Amravati Aarushi 8250192130 Independent Escort Se...Suhani Kapoor
 
Brighton SEO | April 2024 | Data Storytelling
Brighton SEO | April 2024 | Data StorytellingBrighton SEO | April 2024 | Data Storytelling
Brighton SEO | April 2024 | Data StorytellingNeil Barnes
 
Beautiful Sapna Vip Call Girls Hauz Khas 9711199012 Call /Whatsapps
Beautiful Sapna Vip  Call Girls Hauz Khas 9711199012 Call /WhatsappsBeautiful Sapna Vip  Call Girls Hauz Khas 9711199012 Call /Whatsapps
Beautiful Sapna Vip Call Girls Hauz Khas 9711199012 Call /Whatsappssapnasaifi408
 
Al Barsha Escorts $#$ O565212860 $#$ Escort Service In Al Barsha
Al Barsha Escorts $#$ O565212860 $#$ Escort Service In Al BarshaAl Barsha Escorts $#$ O565212860 $#$ Escort Service In Al Barsha
Al Barsha Escorts $#$ O565212860 $#$ Escort Service In Al BarshaAroojKhan71
 
100-Concepts-of-AI by Anupama Kate .pptx
100-Concepts-of-AI by Anupama Kate .pptx100-Concepts-of-AI by Anupama Kate .pptx
100-Concepts-of-AI by Anupama Kate .pptxAnupama Kate
 
dokumen.tips_chapter-4-transient-heat-conduction-mehmet-kanoglu.ppt
dokumen.tips_chapter-4-transient-heat-conduction-mehmet-kanoglu.pptdokumen.tips_chapter-4-transient-heat-conduction-mehmet-kanoglu.ppt
dokumen.tips_chapter-4-transient-heat-conduction-mehmet-kanoglu.pptSonatrach
 
April 2024 - Crypto Market Report's Analysis
April 2024 - Crypto Market Report's AnalysisApril 2024 - Crypto Market Report's Analysis
April 2024 - Crypto Market Report's Analysismanisha194592
 
VidaXL dropshipping via API with DroFx.pptx
VidaXL dropshipping via API with DroFx.pptxVidaXL dropshipping via API with DroFx.pptx
VidaXL dropshipping via API with DroFx.pptxolyaivanovalion
 
Market Analysis in the 5 Largest Economic Countries in Southeast Asia.pdf
Market Analysis in the 5 Largest Economic Countries in Southeast Asia.pdfMarket Analysis in the 5 Largest Economic Countries in Southeast Asia.pdf
Market Analysis in the 5 Largest Economic Countries in Southeast Asia.pdfRachmat Ramadhan H
 
Delhi Call Girls Punjabi Bagh 9711199171 ☎✔👌✔ Whatsapp Hard And Sexy Vip Call
Delhi Call Girls Punjabi Bagh 9711199171 ☎✔👌✔ Whatsapp Hard And Sexy Vip CallDelhi Call Girls Punjabi Bagh 9711199171 ☎✔👌✔ Whatsapp Hard And Sexy Vip Call
Delhi Call Girls Punjabi Bagh 9711199171 ☎✔👌✔ Whatsapp Hard And Sexy Vip Callshivangimorya083
 
꧁❤ Greater Noida Call Girls Delhi ❤꧂ 9711199171 ☎️ Hard And Sexy Vip Call
꧁❤ Greater Noida Call Girls Delhi ❤꧂ 9711199171 ☎️ Hard And Sexy Vip Call꧁❤ Greater Noida Call Girls Delhi ❤꧂ 9711199171 ☎️ Hard And Sexy Vip Call
꧁❤ Greater Noida Call Girls Delhi ❤꧂ 9711199171 ☎️ Hard And Sexy Vip Callshivangimorya083
 
Smarteg dropshipping via API with DroFx.pptx
Smarteg dropshipping via API with DroFx.pptxSmarteg dropshipping via API with DroFx.pptx
Smarteg dropshipping via API with DroFx.pptxolyaivanovalion
 
Industrialised data - the key to AI success.pdf
Industrialised data - the key to AI success.pdfIndustrialised data - the key to AI success.pdf
Industrialised data - the key to AI success.pdfLars Albertsson
 
Log Analysis using OSSEC sasoasasasas.pptx
Log Analysis using OSSEC sasoasasasas.pptxLog Analysis using OSSEC sasoasasasas.pptx
Log Analysis using OSSEC sasoasasasas.pptxJohnnyPlasten
 
VIP High Class Call Girls Jamshedpur Anushka 8250192130 Independent Escort Se...
VIP High Class Call Girls Jamshedpur Anushka 8250192130 Independent Escort Se...VIP High Class Call Girls Jamshedpur Anushka 8250192130 Independent Escort Se...
VIP High Class Call Girls Jamshedpur Anushka 8250192130 Independent Escort Se...Suhani Kapoor
 
VIP Call Girls Service Miyapur Hyderabad Call +91-8250192130
VIP Call Girls Service Miyapur Hyderabad Call +91-8250192130VIP Call Girls Service Miyapur Hyderabad Call +91-8250192130
VIP Call Girls Service Miyapur Hyderabad Call +91-8250192130Suhani Kapoor
 

Recently uploaded (20)

Week-01-2.ppt BBB human Computer interaction
Week-01-2.ppt BBB human Computer interactionWeek-01-2.ppt BBB human Computer interaction
Week-01-2.ppt BBB human Computer interaction
 
Unveiling Insights: The Role of a Data Analyst
Unveiling Insights: The Role of a Data AnalystUnveiling Insights: The Role of a Data Analyst
Unveiling Insights: The Role of a Data Analyst
 
Carero dropshipping via API with DroFx.pptx
Carero dropshipping via API with DroFx.pptxCarero dropshipping via API with DroFx.pptx
Carero dropshipping via API with DroFx.pptx
 
VIP High Profile Call Girls Amravati Aarushi 8250192130 Independent Escort Se...
VIP High Profile Call Girls Amravati Aarushi 8250192130 Independent Escort Se...VIP High Profile Call Girls Amravati Aarushi 8250192130 Independent Escort Se...
VIP High Profile Call Girls Amravati Aarushi 8250192130 Independent Escort Se...
 
Brighton SEO | April 2024 | Data Storytelling
Brighton SEO | April 2024 | Data StorytellingBrighton SEO | April 2024 | Data Storytelling
Brighton SEO | April 2024 | Data Storytelling
 
Beautiful Sapna Vip Call Girls Hauz Khas 9711199012 Call /Whatsapps
Beautiful Sapna Vip  Call Girls Hauz Khas 9711199012 Call /WhatsappsBeautiful Sapna Vip  Call Girls Hauz Khas 9711199012 Call /Whatsapps
Beautiful Sapna Vip Call Girls Hauz Khas 9711199012 Call /Whatsapps
 
Al Barsha Escorts $#$ O565212860 $#$ Escort Service In Al Barsha
Al Barsha Escorts $#$ O565212860 $#$ Escort Service In Al BarshaAl Barsha Escorts $#$ O565212860 $#$ Escort Service In Al Barsha
Al Barsha Escorts $#$ O565212860 $#$ Escort Service In Al Barsha
 
100-Concepts-of-AI by Anupama Kate .pptx
100-Concepts-of-AI by Anupama Kate .pptx100-Concepts-of-AI by Anupama Kate .pptx
100-Concepts-of-AI by Anupama Kate .pptx
 
dokumen.tips_chapter-4-transient-heat-conduction-mehmet-kanoglu.ppt
dokumen.tips_chapter-4-transient-heat-conduction-mehmet-kanoglu.pptdokumen.tips_chapter-4-transient-heat-conduction-mehmet-kanoglu.ppt
dokumen.tips_chapter-4-transient-heat-conduction-mehmet-kanoglu.ppt
 
April 2024 - Crypto Market Report's Analysis
April 2024 - Crypto Market Report's AnalysisApril 2024 - Crypto Market Report's Analysis
April 2024 - Crypto Market Report's Analysis
 
E-Commerce Order PredictionShraddha Kamble.pptx
E-Commerce Order PredictionShraddha Kamble.pptxE-Commerce Order PredictionShraddha Kamble.pptx
E-Commerce Order PredictionShraddha Kamble.pptx
 
VidaXL dropshipping via API with DroFx.pptx
VidaXL dropshipping via API with DroFx.pptxVidaXL dropshipping via API with DroFx.pptx
VidaXL dropshipping via API with DroFx.pptx
 
Market Analysis in the 5 Largest Economic Countries in Southeast Asia.pdf
Market Analysis in the 5 Largest Economic Countries in Southeast Asia.pdfMarket Analysis in the 5 Largest Economic Countries in Southeast Asia.pdf
Market Analysis in the 5 Largest Economic Countries in Southeast Asia.pdf
 
Delhi Call Girls Punjabi Bagh 9711199171 ☎✔👌✔ Whatsapp Hard And Sexy Vip Call
Delhi Call Girls Punjabi Bagh 9711199171 ☎✔👌✔ Whatsapp Hard And Sexy Vip CallDelhi Call Girls Punjabi Bagh 9711199171 ☎✔👌✔ Whatsapp Hard And Sexy Vip Call
Delhi Call Girls Punjabi Bagh 9711199171 ☎✔👌✔ Whatsapp Hard And Sexy Vip Call
 
꧁❤ Greater Noida Call Girls Delhi ❤꧂ 9711199171 ☎️ Hard And Sexy Vip Call
꧁❤ Greater Noida Call Girls Delhi ❤꧂ 9711199171 ☎️ Hard And Sexy Vip Call꧁❤ Greater Noida Call Girls Delhi ❤꧂ 9711199171 ☎️ Hard And Sexy Vip Call
꧁❤ Greater Noida Call Girls Delhi ❤꧂ 9711199171 ☎️ Hard And Sexy Vip Call
 
Smarteg dropshipping via API with DroFx.pptx
Smarteg dropshipping via API with DroFx.pptxSmarteg dropshipping via API with DroFx.pptx
Smarteg dropshipping via API with DroFx.pptx
 
Industrialised data - the key to AI success.pdf
Industrialised data - the key to AI success.pdfIndustrialised data - the key to AI success.pdf
Industrialised data - the key to AI success.pdf
 
Log Analysis using OSSEC sasoasasasas.pptx
Log Analysis using OSSEC sasoasasasas.pptxLog Analysis using OSSEC sasoasasasas.pptx
Log Analysis using OSSEC sasoasasasas.pptx
 
VIP High Class Call Girls Jamshedpur Anushka 8250192130 Independent Escort Se...
VIP High Class Call Girls Jamshedpur Anushka 8250192130 Independent Escort Se...VIP High Class Call Girls Jamshedpur Anushka 8250192130 Independent Escort Se...
VIP High Class Call Girls Jamshedpur Anushka 8250192130 Independent Escort Se...
 
VIP Call Girls Service Miyapur Hyderabad Call +91-8250192130
VIP Call Girls Service Miyapur Hyderabad Call +91-8250192130VIP Call Girls Service Miyapur Hyderabad Call +91-8250192130
VIP Call Girls Service Miyapur Hyderabad Call +91-8250192130
 

Economic profile mumbai.pdf

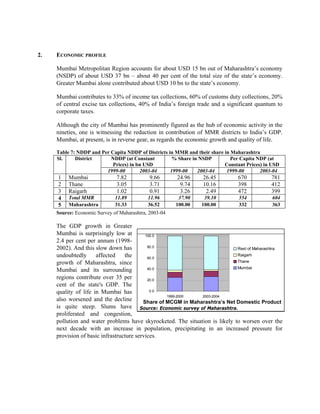
  • 1. 0.0 20.0 40.0 60.0 80.0 100.0 1999-2000 2003-2004 Rest of Maharashtra Raigarh Thane Mumbai Share of MCGM in Maharashtra’s Net Domestic Product Source: Economic survey of Maharashtra. 2. ECONOMIC PROFILE Mumbai Metropolitan Region accounts for about USD 15 bn out of Maharashtra’s economy (NSDP) of about USD 37 bn – about 40 per cent of the total size of the state’s economy. Greater Mumbai alone contributed about USD 10 bn to the state’s economy. Mumbai contributes to 33% of income tax collections, 60% of customs duty collections, 20% of central excise tax collections, 40% of India’s foreign trade and a significant quantum to corporate taxes. Although the city of Mumbai has prominently figured as the hub of economic activity in the nineties, one is witnessing the reduction in contribution of MMR districts to India’s GDP. Mumbai, at present, is in reverse gear, as regards the economic growth and quality of life. Table 7: NDDP and Per Capita NDDP of Districts in MMR and their share in Maharashtra NDDP (at Constant Prices) in bn USD % Share in NSDP Per Capita NDP (at Constant Prices) in USD Sl. District 1999-00 2003-04 1999-00 2003-04 1999-00 2003-04 1 Mumbai 7.82 9.66 24.96 26.45 670 781 2 Thane 3.05 3.71 9.74 10.16 398 412 3 Raigarh 1.02 0.91 3.26 2.49 472 399 4 Total MMR 11.89 11.96 37.90 39.10 554 604 5 Maharashtra 31.33 36.52 100.00 100.00 332 363 Source: Economic Survey of Maharashtra, 2003-04 The GDP growth in Greater Mumbai is surprisingly low at 2.4 per cent per annum (1998- 2002). And this slow down has undoubtedly affected the growth of Maharashtra, since Mumbai and its surrounding regions contribute over 35 per cent of the state's GDP. The quality of life in Mumbai has also worsened and the decline is quite steep. Slums have proliferated and congestion, pollution and water problems have skyrocketed. The situation is likely to worsen over the next decade with an increase in population, precipitating in an increased pressure for provision of basic infrastructure services.
  • 2. 2.1. Industrial Development Greater Mumbai is dominated by tertiary sector (wholesale and retail trade, transport, storage and communications, finance, insurance, information technology, real estate, community, social and personal services) followed by secondary sector (manufacturing and repair, electricity, gas and water construction). This is in contrast to the situation in rest of MMR, wherein secondary sector is dominating in NDP contribution. Unlike the earlier dominance of heavy industry in contribution to economic output of the region, sectors such as gems & jewellery, leather & leather products, IT & ITES along with tourism/entertainment are contributing significantly to the economic growth of the region today. Some of the key sectors contributing to the city’s economy are discussed below. a. Gems & Jewellery: The exports of Gems & Jewellery from Mumbai have risen from Rs 5000 crore in 1990-91 to Rs 45,000 crore in 2003-042 . Exports of gems and jewellery have provided significant employment in the region. On the other hand SEEPZ alone handled import of Rs 2000 crore (2003-04) of rough diamonds, gold bars, stones, C&P diamonds, silver bars and platinum. b. Leather: Leather industry occupies a place of prominence in the Indian economy in view of its massive potential for employment, growth and exports. India is the largest livestock holding country, having an annual production value of USD 4 billion providing employment to 2.50 million people. There is a potential for technology inflow and foreign direct investment in the sector. Mumbai is the major production center of leather and leather products in the Western region3 The leather industry is poised for major growth in the coming decade. It is hoped that Maharashtra will play a significant role in increasing India’s share of international leather trade. In fact, because of globalization of the Indian economy, numerous opportunities are available for the state’s sustained growth in this sector. The leather and leather product industries of Maharashtra are centered on Mumbai, the inherent strengths being a comfortable raw material base, skilled labor and the already well- established leather/leather goods industry. 2 Source: Gems & Jewellery Export Promotion Council 3 Source: Council of Leather Exports
  • 3. c. IT & ITES: IT & ITES is another promising industry in the city. The State Government has a visionary IT policy to make it attractive for companies to set up shop in the state. Mumbai is home to some of the finest educational institutions in the country ensuring a steady supply of trained technical manpower to the IT and ITES industry. The state accounts for more than 30% of the country’s software exports, with over 1200 software units based in the state, thus providing a familiar and friendly environment for IT companies. Besides, over 35% of the country’s PC’s and 32% of internet subscribers are in the state of Maharashtra. d. Textiles: Textiles is another industry of strategic importance to the state, contributing to 27% of India’s total exports, holding immense future potential in global markets particularly in value added segments like garments and ready to wear goods. e. Entertainment: Another promising sector is the entertainment sector. A robust macro economic environment with GDP target at an annual 8% growth will not only ensure a conducive environment for the environment industry, but has also resulted in an increased demand for entertainment. Indian film industry, one of the drivers of entertainment in the country has revenues of Rs 4500 crore (2003) and expected to grow at a compounded annual growth of 18% to gross Rs 10,100 crore by 20084 . The growth drivers in this segment are increase in multiplexes, advent of digital technology, creating films as brands through corporate tie-ups, merchandising etc and corporatization with producers adopting a more structure approach to film production. Besides, revenues from television are expected to grow at a compounded annual growth rate of 17% over the next five years to gross Rs 28, 852 crore by 2008 and a significant portion of this growth is expected from the subscription stream. The Indian music industry has stabilized in 2003, after recording a significant correction in 2002 – the revenues are approx Rs 1000 crore in 2003. The live entertainment segment has grown by 60% over 2002 and is expected to sustain this growth over the foreseeable future. For the organized sector, revenues stood at nearly Rs 580 crore in 2003. Many event managers believe that the next big thing for this segment will be sports based events, celebrity management and conventions and seminars. The Indian entertainment industry is in an enviable position – it operates within a robust macro economic framework and the Indian creative product is fast becoming a global power-brand. The domestic scenario is bursting with prospects and the industry seems ideally positioned to capitalize on them. Whether it is infrastructure that will guarantee an improved cinematic experience or a television distribution mechanism that provides choice to a consumer at an affordable 4 Source: Ernst and Young
  • 4. price and ensure fair sharing of revenues across players – by strengthening its fundamentals, Mumbai, as the heart of film production and entertainment, should leverage this opportunity to significantly enhance its economic growth in the next few years. As proactive step to promote industrial development in the city and the MMR, Government of Maharashtra has proposed a new Industrial Location Policy, which is expected to be announced shortly. This policy envisages promoting non-polluting, hi-tech and high value added industries within Mumbai (all industries listed under Schedule 1 of the Policy). 2.2. Employment Greater Mumbai is the major employment hub in MMR, accounting for about 74 per cent of the total employment in MMR, followed by Navi Mumbai – which is an upcoming potential economic hub – Kalyan, Bhiwandi and Thane. As per latest available figures (1998), the total employment in Greater Mumbai is about 2.63 million, of which majority of the employment is in the tertiary sector. There has been a steady shift in employment from the secondary to tertiary sector in Greater Mumbai, as evident from Table 8. However, the growth in overall employment has been very low at just about 1 per cent per annum during 1980 to 1998. While this decline may be attributed partially to IT applications in the tertiary sector, it is largely due to growing unemployment in the city and region as a whole. Table 8: Employment Pattern and Growth Trends in Greater Mumbai 1980 1998 Sl. Sector Employment % Share Employment % Share CAGR (%) 1 Primary 24,009 1.09 7,059 0.27 -6.57 2 Secondary 805,468 36.62 492,030 18.74 -2.70 3 Tertiary 1,369,904 62.29 2,126,659 80.99 2.47 Total 2,199,381 100.00 2,625,748 100.00 0.99 Source: Population & Employment Profile of Mumbai Metropolitan Region, Planning Division, MMRDA, September 2003. The age specific work participation rates in the years 1981 and 91 are presented in the table below. Less than 2% of the boys in the 5-15 age group and less than 1% of the girls in the same age group were reported as workers in 1991. More significantly, in 1991, men were economically less active for all age groups vis-à-vis the scenario in 1981.
  • 5. Table 9: Age-specific Work Participation Rates Age Group (years) Work Participation Rates 1981 (%) Work Participation Rates 1991 (%) Males Females Males Females 5-15 1.2 0.5 1.8 0.7 15-19 29.8 6.3 27.9 6.9 20-24 70.7 18.2 67.4 16.0 25-29 90.0 15.8 89.4 17.3 30-34 94.5 16.1 94.4 18.8 35-39 95.4 16.1 95.1 20.3 40-49 95.0 15.4 93.9 19.8 50-59 85.5 12.1 83.5 14.3 60+ 39.8 4.4 31.6 4.3 All Ages 54.9 8.6 54.3 10.5 15+ 77.0 13.3 74.8 15.1 Mumbai is the financial center of the country, with majority of the financial business domiciled in the country. This is facilitated with the presence of the Bombay Stock Exchange, National Stock Exchange, the financial sector regulators such as SEBI, the headquarters of major banks and financial entities and lender of last resort, the headquarters of the Reserve Bank of India. It is in this context that the city provides significant formal and informal employment in the financial sector. An estimate of the same is presented in Table 10. Table 10: Formal & In-formal Employment Year Total employment (Male + Female) Formal employment (Male + Female) Informal employment (Male + Female) Share of informal in total employment (%) 1992 114,621 79,071 35,550 31.11 1993 117,646 80,025 37,621 31.98 1994 120,782 80,621 40,161 33.25 1995 124,035 81,268 42,767 34.48 1996 127,412 82,319 45,093 35.39 1997 130,915 81,866 49,049 37.47 (CAGR %) 2.66 0.69 6.44 Total employment in the financial sector in Mumbai increased at 2.66 per cent per annum compound between 1992 and 1997. The share of the formal sector in total employment declined and that of the informal sector increased between 1992 and 1997 Within Greater Mumbai, there has been a shift in the spatial distribution of employment in Greater Mumbai. The employment in the Island City, which constituted 71.8% of the total employment in 1971, is reduced to 55.7% in 1990. This is mainly on account of marked decline in the manufacturing sector employment. Similarly, the office sector employment, which has increased in Greater Mumbai from 3.52 lakh in 1980 to 6.29 lakh in 1990, the
  • 6. share of CBD of Greater Mumbai (A to D Ward) has reduced from 54.7% to 47.5% over this period. Further, a trend of growth of smaller establishments i.e. those employing less than five persons is now firmly set in Greater Mumbai. 2.3. Other Economic Indicators Mumbai has been the hub of financial, trading and economic activity in the country. Jawahar Lal Nehru port is the busiest port in the country. The average turnaround time at both JNPT and MPT has been declining. The average output per ship berth day has shown an increase at both JNPT and MPT. Although the ports are handling significant trade volumes, substantial investments need to be undertaken in order to position them as truly world-class ports capable of handling efficiently the ever-increasing trade of the country. Table 11: Performance parameters for Major Ports JNPT MPT Item 1993-94 1998-99 1993-94 1998-99 Average turnaround time (days) 4.25 3.38 8.75 6.94 Average pre-berthing time (days) 0.83 1.38 2.41 1.91 Average output per ship berth days (tonnes) 2800 6886 2647 2800
  • 7. Mumbai holds an envious position as regards the passenger traffic at airports, in handling 30% of the air passenger traffic in the country. Table 12: Passenger Traffic at Airport Year Mumbai Airport All Airports (India) Mumbai Share (India%) 1995-96 11,117,400 37,013,800 30 1996-97 11,067,400 36,489,900 30 1997-98 11,010,606 36,530,693 30 1998-99 11,018,557 36,989,419 30 1999-00 11,532,144 39,004,933 30 Mumbai handles about 35% of the cargo traffic in the country. This generates substantial employment, and a sizeable labor force resides nearby port area. Besides, such a quantum of trade volume at the port places pressure on nearby infrastructure. The associated infrastructure such as availability of dedicated road connectivity and its integration with rail connectivity to the hinterland needs to be provided for in the development plan Table 13: Cargo Traffic at Mumbai Airport Year Mumbai All Airports Mumbai's Share in India % Figures in Tonnes 1995-96 234,650 649,369 36 1996-97 254,600 680,100 37 1997-98 253,616 705,886 36 1998-99 243,584 699,150 36 1999-00 276,694 797,443 35 Of the Capital Investment in Large and Medium Industries across the state of Maharashtra, Mumbai attracts significant investments. Approximately, 40% of the capital investments are cornered by Mumbai Table 14: Capital Investment in Large & Medium Industries Greater Mumbai Maharashtra Year Rs Crore % share of Mumbai in Maharashtra 1993 28,682 48,264 59 1996 28,701 54,398 53 1998 29,357 61,542 48 2000 30,573 72,873 42 Bulk of the financial business is conducted in Mumbai’s financial centers namely the erstwhile Nariman Point and presently Bandra Kurla Complex. Dominance of Mumbai in both the credit offtake and deposit mobilization can be assessed from Table 15.
  • 8. Table 15: Scheduled Commercial Banks % share of Top Metro Centers in Credit % share in Credits March 1999 March 1991 March 1986 Cities % share of credits in all-India total Mumbai 20.93 17.76 19.62 Delhi 14.03 10.97 8.12 Chennai 6.03 5.28 4.38 Calcutta 4.7 6.08 6.32 All-India 100.0 100.0 100.0 Table 16: Scheduled Commercial Banks - Share of Metros in Deposits % share in Deposits March 1999 March 1991 March 1986 Cities % share of deposits in all-India total Mumbai 14.19 14.8 12.82 Delhi 10.43 9.09 9.61 Calcutta 4.09 6.03 6.81 Chennai 2.71 2.95 2.48 All-India 100.0 100.0 100.0 Scheduled commercial banks are able to mobilize 13% of the deposits in Mumbai and able to disburse credit of approx 20% of the total credit given by banks at Mumbai. 2.3.1 Doing Business in Mumbai (Maharashtra)5 Every economy has established a complex system of laws and institutions intended to protect the interest of workers and to guarantee a minimum standard of living for its population. The attractiveness of a region/state in the country is a factor of indicators such as: a. Entry Regulation: Punjab at 57 days takes the shortest time to start a business vis-à-vis Andhra Pradesh (68 days). Maharashtra is way behind at 89 days. In terms of cost to start a business Mumbai (Maharashtra) is 49.5% of per capita gross national income, in comparison to Punjab (44.1%) and Tamil Nadu (47.3%). Analysis shows that burdensome entry regulations hold back private investment, push more people into the informal economy, increase consumer prices and fuel corruption. b. Registering Property: In terms of taking time to register property, time taken is 67 days in Mumbai (Maharashtra) in comparison to 35 days in Bangalore (Karnataka). The least cost region as regards cost to register property is 10.2% of property value in Punjab, whereas its is 13.9% for Mumbai (Maharashtra). Efficient property registration reduces transaction costs and helps keep formal title from slipping to informal status. Simple procedures to register property are also associated with more perceived security of property rights and less corruption. 5 Doing Business in India 2005, World Bank and IFC Washington
  • 9. c. Contract Enforcement: Contract enforcement is critical for business to engage with new borrowers or customers. Although time to enforce a contract is the least at 425 days in Mumbai (Maharashtra), the cost to enforce a contract is high at 43.1% of per capita gross national income. In comparison, the cost to enforce a contract is significantly lower for states such as Karnataka (12.9%), Andhra Pradesh (13.8%) and Punjab (24.7%). d. Bankruptcy: Recent economic crises in emerging markets, from East Asia, to Latin America, to Russia and Mexico, have raised concerns about the design of bankruptcy systems and the ability of such systems to help reorganize viable companies and close down unviable ones. An entity takes 10 years in Mumbai (Maharashtra) to go through insolvency in comparison to 8.33 years in Karnataka and 9.5 years in Tamil Nadu and Andhra Pradesh. On the other hand, the recovery rate (cents on the dollar) is only 12.50 for Mumbai (Maharashtra) in comparison to 16.61 for Bangalore (Karnataka) and 14.63 for Chennai (Tamil Nadu) e. Construction Regulation: It takes 187 days to legally build warehouse in Mumbai (Maharashtra) in comparison to 130 days in Hyderabad (Andhra Pradesh). In term of cost to legally build a warehouse Mumbai (Maharashtra) is lagging behind at 880% of per capita gross national income. The cost is 622% of per capita gross national income for Andhra Pradesh. In conclusion, with the vibrant economic profile, Mumbai offers several potential advantages and can leverage this existing potential for growth. To evolve as a Regional Financial Center, to capitalize on the entertainment industry exports or the leather and gems & jewellery exports, Mumbai has to change its course for supporting its economy and businesses and meet the challenges of transforming into a city offering world-class infrastructure, citizen friendly services and a business friendly environment. The economic growth therefore needs to be carefully supported with linkages and reforms. Being constrained due to land availability, Mumbai draws upon support from neighboring areas. Major ports (JNPT and Rewas-Aware) and new airport are positioned outside Mumbai. The hinterland beyond Greater Mumbai also serves as the area potentially available for development, which houses workforce as well as markets. The connectivity to hinterland is therefore important recognizing the fact that about 50% commuters traveling to Mumbai are from hinterland. With proposed development of the hinterland and the felt need for better connectivity to boost the economy of the region, transportation and avenues for public transport assume
  • 10. significance. A number of strategic initiatives are proposed under the plan, which would support the overall economic activity of the city as well as the Mumbai Metropolitan Region. Economic development should therefore be all encompassing covering areas that will boost economic activity (e.g. development of infrastructure and industrial/commercial activities which will provide job opportunities), provision of support systems such as transportation, water supply and sanitation, health and education, that would complement economic development and the policy and legal frameworks that are required to facilitate investments and bring about development.