Listed Equity REITs and Private Equity Real Estate: Income and Capital Appreciation

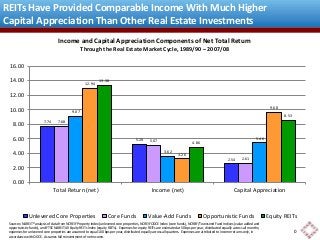
This chart shows the components of total return over the last full real estate market cycle for five ways of investing in real estate: unlevered core properties (NCREIF Property Index), core private equity funds (NCREIF ODCE Index), value add and opportunistic private equity funds (NCREIF/Townsend Fund Indices), and listed equity REITs (FTSE NAREIT All Equity REIT Index). Core investments on the private side have provided very little capital growth--in fact, with CPI inflation averaging 2.8% over the cycle, they actually lost value. The REIT index represents a passive investment in the universe of investable listed U.S. equity REITs, but this analysis assumes fees typical of actively managed portfolios. The private indices represent returns reported by active managers selected by large institutional investors, so likely overstate the universe of private real estate investments. Returns are not adjusted for leverage: value add and opportunistic funds typically use much greater leverage than listed equity REITs, while core funds use less. Questions? Contact me at bcase@nareit.com.
Recommended

Recommended
More Related Content
More from Brad Case, PhD, CFA, CAIA
More from Brad Case, PhD, CFA, CAIA (7)
Recently uploaded
Recently uploaded (20)
Listed Equity REITs and Private Equity Real Estate: Income and Capital Appreciation
- 1. REITs Have Provided Comparable Income With Much Higher Capital Appreciation Than Other Real Estate Investments Income and Capital Appreciation Components of Net Total Return Income Component Through the Real Estate Market Cycle, 1989/90 – 2007/08 2.54 2.61 5.46 Income Component 7.74 5.20 7.68 5.07 9.07 3.62 12.94 3.26 16.00 14.00 12.00 10.00 8.00 6.00 4.00 2.00 Sources: NAREIT® analysis of data from NCREIF Property Index (unlevered core properties, NCREIF ODCE Index (core funds), NCREIF/Townsend Fund Indices (value added and opportunistic funds), and FTSE NAREIT All Equity REITs Index (equity REITs). Expenses for equity REITs are estimated at 50 bps per year, distributed equally across all months; expenses for unlevered core properties are assumed to equal 100 bps per year, distributed equally across all quarters. Expenses are attributed to income returns only, in accordance with ODCE. Assumes full reinvestment of net income. 9.68 13.38 4.86 8.53 0.00 Total Return (net) Income (net) Capital Appreciation Unlevered Core Properties Core Funds Value-Add Funds Opportunistic Funds Equity REITs 0