More Related Content
Similar to Awsc avenida universitaria con avenida olimpica
Similar to Awsc avenida universitaria con avenida olimpica (8)
Awsc avenida universitaria con avenida olimpica
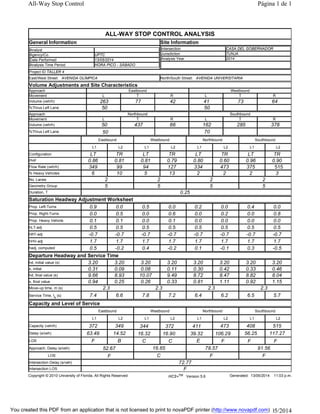
- 1. ALL-WAY STOP CONTROL ANALYSIS
General Information Site Information
Analyst
Agency/Co. UPTC
Date Performed 13/05/2014
Analysis Time Period HORA PICO - SÁBADO
Intersection CASA DEL GOBERNADOR
Jurisdiction TUNJA
Analysis Year 2014
Project ID TALLER 4
East/West Street: AVENIDA OLÍMPICA North/South Street: AVENIDA UNIVERSITARIA
Volume Adjustments and Site Characteristics
Approach Eastbound Westbound
Movement L T R L T R
Volume (veh/h) 263 77 42 41 73 64
%Thrus Left Lane 50 50
Approach Northbound Southbound
Movement L T R L T R
Volume (veh/h) 50 437 66 162 285 378
%Thrus Left Lane 50 70
Eastbound Westbound Northbound Southbound
L1 L2 L1 L2 L1 L2 L1 L2
Configuration LT TR LT TR LT TR LT TR
PHF 0.86 0.81 0.81 0.79 0.80 0.60 0.96 0.90
Flow Rate (veh/h) 349 99 94 127 334 473 375 515
% Heavy Vehicles 6 10 5 13 2 2 2 3
No. Lanes 2 2 2 2
Geometry Group 5 5 5 5
Duration, T 0.25
Saturation Headway Adjustment Worksheet
Prop. Left-Turns 0.9 0.0 0.5 0.0 0.2 0.0 0.4 0.0
Prop. Right-Turns 0.0 0.5 0.0 0.6 0.0 0.2 0.0 0.8
Prop. Heavy Vehicle 0.1 0.1 0.0 0.1 0.0 0.0 0.0 0.0
hLT-adj 0.5 0.5 0.5 0.5 0.5 0.5 0.5 0.5
hRT-adj -0.7 -0.7 -0.7 -0.7 -0.7 -0.7 -0.7 -0.7
hHV-adj 1.7 1.7 1.7 1.7 1.7 1.7 1.7 1.7
hadj, computed 0.5 -0.2 0.4 -0.2 0.1 -0.1 0.3 -0.5
Departure Headway and Service Time
hd, initial value (s) 3.20 3.20 3.20 3.20 3.20 3.20 3.20 3.20
x, initial 0.31 0.09 0.08 0.11 0.30 0.42 0.33 0.46
hd, final value (s) 9.66 8.93 10.07 9.49 8.72 8.47 8.82 8.04
x, final value 0.94 0.25 0.26 0.33 0.81 1.11 0.92 1.15
Move-up time, m (s) 2.3 2.3 2.3 2.3
Service Time, ts (s) 7.4 6.6 7.8 7.2 6.4 6.2 6.5 5.7
Capacity and Level of Service
Eastbound Westbound Northbound Southbound
L1 L2 L1 L2 L1 L2 L1 L2
Capacity (veh/h) 372 349 344 372 411 473 408 515
Delay (s/veh) 63.49 14.52 16.32 16.90 39.32 106.29 56.25 117.27
LOS F B C C E F F F
Approach: Delay (s/veh) 52.67 16.65 78.57 91.56
LOS F C F F
Intersection Delay (s/veh) 72.77
Intersection LOS F
Copyright © 2010 University of Florida, All Rights Reserved HCS+TM Version 5.6 Generated: 13/05/2014 11:03 p.m.
Página 1 de 1All-Way Stop Control
13/05/2014file://C:UsersCARLOSAppDataLocalTempu2kA858.tmpYou created this PDF from an application that is not licensed to print to novaPDF printer (http://www.novapdf.com)