More Related Content
Similar to synuclein (20)
More from cailynnjohnson (11)
synuclein
- 1. The abnormal aggregation of -synuclein (S) protein in humand
brain leads to a series of neurological disorders, known as
synucleopathies. The aggregation of -synuclein plays a critical role
in the development of Parkinson’s disease in human brain. Some
studies suggest that this aggregation may be triggered by factors
linked to apoptosis like the protein kinases inhibitor staurosporine.
-Synuclein Aggregation Fluorescent Cell-Based Assay
Development for the Screening of Drugs Against Parkinson
Disease
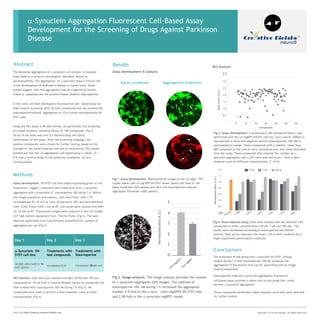
Aggregation Induction
Basal conditions
Fig 1. Assay development. Representative images of the S-tagG- FP2
(upper panel) and S-tag RFP SH-SY5Y (lower panel) cell lines in the
basal condicions (left panels) and after the staurosporine-induced
aggregates formation (right panels).
Conclusions
The treatment of the green/red -synuclein SH-SY5Y cellular
models during 1 h with Staurosporine 100 nM produces the
aggregation of the protein that can be quantified with an image
analysis equipment.
Staurosporine-induced -synuclein aggregation fluorescent
cell-based assay provides a robust tool to test drugs that could
prevent -synuclein aggregation.
Three compounds performed a dose-response curve and were selected
for further studies.
0 120
20 40 60
Compounds
80 100
HCS Analysis
3.5
Spot
count
(A.U.)
0.5
1.0
1.5
2.0
2.5
3.0
Fig 2. Image analysis. The image analysis provides the number
of -synuclein aggregates (left image). The addition of
staurosporine 100 nM during 1 h increased the aggregates
number 4.9-fold in the -synu- clein-tagGFP2 SH-SY5Y cells
and 2.96-fold in the -synuclein-tagRFP model.
Normalized
data
(A.U.)
10 M 1 M 100 nM
Fig 3. Assay development. A screening of 100-compound library was
performed with the S-tagRFP SHSY5Y cell line. Zero control (DMSO) is
represented in white and negative control (Staurosporine 100 nM) is
represented in orange. Those compounds with a viability lower than
60% compared to the control were considered toxic and were discarded
from the study. Those compounds that reduced the number of -
synuclein aggregates over a 25% were selected to per- form a dose-
response curve at different concentrations. Z´=0.61.
Fig 4. Dose-response Assay. Cells were treated with the selected test
compounds at three concentrations (10 M, 1 M and 100 nM). The
results were normalized according to staurosporine and vehicle
controls. Data points represent the mean ± SD at each condition for a
single experiment performed in triplicate.
In this work, we have developed a fluorescence cell- based assay for
High Content Screening (HCS) to find compounds that can prevent the
staurosporine-induced aggregation of S in human neuroblastoma SH-
SY5Y cells.
Using this HCS assay in 96 well format, we performed the screening
of a small synthetic chemical library of 100 compounds. The Z
factor of the assay was over 0.5 demostrating the robust
performance of the assay. After the screening campaign, the
positive compounds were chosen for further testing, based on the
strength of the initial response and lack of cytotoxicity. The results
pointed out that this S aggregation cell-based assay is robust (Z >
0.5) and a valid strategy to test potential candidates for pre-
clinical studies.
Assay development. SH-SY5Y cell lines stably expressing green or red
fluorescent tagged -synuclein were induced to form -synuclein
aggregates with a treatment of staurosporine 100 nM for 1 h. Before
the image acquisition and analysis, cells were fixed with 3.7%
formaldehyde for 10 min at room temperature (RT) and permeabilized
with 0.03% Triton-X100 3 min at RT. Cell nuclei were stained with DAPI
for 10 min at RT. Fluorescent images were acquired in the Cell insight
CX7 high content equipment from Thermo Fisher (Fig 1). The spot
detector application from Cell Software quantified the number of
aggregates per cell (Fig 2).
0.0
0.2
0.4
0.6
0.8
1.0
1.2
1.4
HCS Analysis. Cells were pre-treated overnight (O/N) with 100 test
compounds at 10 M from a Creative Biolabs' library of compounds and
then treated with staurosporine 100 nM during 1 h (Fig 3). Hit
compounds were used to perform a dose-response curve at three
concentrations (Fig 4).
Normalized
data
(A.U.)
0
1
2
3
4
5
Visit us at https://neuros.creative-biolabs.com Copyright © Creative Biolabs. All Rights Reserved.
Abstract
Methods
Day 1 Day 2 Day 3
-Synuclein SH-
SY5Y cell line
Treatments with
test compounds
Treatments with
Staurosporine
30,000 cells/well in 96
well-plates
Incubation O/N Incubation 30-60 min
Results
Assay development & analysis