SlideShare a Scribd company logo
1 of 30
G
BY EDITH OSTAPIK AND KEI-MU YI
Edith Ostapik
is a research
associate in the
Philadelphia
Fed’s Research
Department.
This article is
available free of
charge at www.
philadelphiafed.org/econ/br/index.
International Trade:
Why We Don’t Have More of It
Kei-Mu Yi is a
vice president
and economist
in the Research
Department of
the Philadelphia
Fed. He is also
head of the
department’s
Macroeconomics section.
1 Source: The World Bank’s World
Development Indicators (we use the world
export share of world GDP). Since world
exports = world imports, imports have risen by
the same amount.
2 Previous Business Review articles have
questioned the extent to which globalization
has taken place. The article by Janet Ceglowski
reviews research on barriers to international
trade. Examining another dimension of
globalization, Sylvain Leduc explores the lack
of international diversification of investment
portfolios.
3 They estimate an overall average increase
of 74 percent in the prices of goods in these
countries.
Globalization has many facets.
One of the most important is the enor-
mous increase in international trade.
Over the past 40 years, world exports
as a share of output have doubled to
almost 25 percent of world output.1
However, despite globalization and
the increasing share of output that is
exported and imported internationally,
economic evidence suggests that sig-
nificant barriers to international trade
still exist.2 We will summarize the lat-
est developments in the measurement
of international trade barriers, drawing
mainly from a recent comprehensive
survey on the subject by James Ander-
son and Eric van Wincoop. In their
lobalization has led to an enormous increase
in international trade. Over the past 40
years, world exports as a share of output have
doubled to almost 25 percent of world output.
However, despite this enormous increase, economic
evidence suggests that significant barriers to international
trade still exist. In this article, Edith Ostapik and Kei-Mu
Yi summarize the latest developments in the measurement
of international trade barriers.
survey, these authors report estimates
of the magnitudes of different catego-
ries of international trade costs. They
find that, on average, international
trade costs almost double the price of
goods in developed countries.3
The primary policy implication of
the existing research is that globaliza-
tion still has a long way to go, so that
there is still plenty of room for trade
to grow. Growth in trade will likely
occur primarily through technological
changes that reduce transportation or
communication costs or from long-
run policy choices, such as a national
currency or language. Reduction in
policy-related barriers, such as tariffs,
will also play a role.
WHY AND HOW TRADE COSTS
REDUCE TRADE
The core idea underlying the
benefits of international trade goes
back to Adam Smith and his famous
pin factory parable. According to
Smith, when each worker specializes in
doing only those tasks he is best suited
to do, a factory achieves its maximum
economic efficiency. Smith and later
economists extended this argument
from firms to countries. Economic
efficiency occurs when each country
specializes in making and exporting
only those goods it is relatively efficient
at producing. In turn, each country
imports those goods other countries
produce relatively efficiently.4
4 David Ricardo formalized the notion of
relative efficiency in his theory of comparative
advantage. One of the most powerful ideas
in economics, comparative advantage shows
that countries can gain from trading with each
other, even if one country is more productive
at producing every single good than another
country. Textbooks on international economics
(for example, the one by Richard Caves, Jeffrey
Frankel, and Ronald Jones or the one by Paul
Krugman and Maurice Obstfeld) provide a more
detailed description of comparative advantage.
20 Q3 2007 Business Review www.philadelphiafed.org
Business Review Q3 2007 21www.philadelphiafed.org
International trade enhances a society’s
economic well-being because it facilitates
specialization in production.
In other words, international trade
enhances a society’s economic well-
being because it facilitates specializa-
tion in production. With trade, prices
consumers pay for goods are lower
than those they would pay without
trade. According to Smith and later
economists, when trade is free and
unfettered, a society maximizes its
economic well-being.
Barriers to international trade pre-
vent the efficient outcome described
above from occurring. For example,
because these barriers raise the costs
of purchasing imported goods, U.S.
consumers would buy fewer foreign
goods, and foreign consumers would
buy fewer U.S. goods. To satisfy the
demand for products that previously
had been imported under free trade,
each country would now be making
more goods it is not relatively efficient
at producing. In the presence of inter-
national trade barriers, there would
be less specialization, prices would be
higher, and, overall, consumers in all
countries would be worse off.
THE TWO MAIN TYPES OF
TRADE COSTS
In 19th-century England, econo-
mist David Ricardo used these core
ideas of the benefits to international
trade to argue against a pressing politi-
cal barrier to trade: the Corn Laws,
which protected British agriculture
and kept domestic food prices high.
Since then, economists have studied
many other barriers to trade. We will
describe these barriers in terms of
costs, following the convention used by
Anderson and van Wincoop.5
Broadly, trade costs are all costs
incurred from the time a good leaves
5 Anderson and van Wincoop divide trade
costs into three broad categories: border-related
costs, international transportation costs, and
distribution costs. We focus only on those costs
associated with international trade: border-
related costs and international transport costs.
the factory or its place of production
to the time it is purchased by the
end-user. Such costs can be incurred
internationally (for example, at the
border) or domestically (that is, within
a country). In the case of consumer
goods such as automobiles, televisions,
clothing, and food, trade costs are the
difference between the price at the
“factory gate” and the retail price.6
International trade costs can be
broadly divided into two main catego-
ries: border-related costs and interna-
tional transportation costs. Border-re-
lated costs encompass the broad range
of trade barriers encountered between
nations, excluding international trans-
portation. These barriers include costs
that occur specifically at the border,
such as tariffs, quotas, and paperwork
due to customs and other regulations,
as well as those differences between
countries that could affect trade, such
as different currencies, languages, or
laws (contract enforcement).7 Together
with international transport costs,
these items make up the costs incurred
internationally.
Border-related costs can be
classified based on whether they are
attributable to (national) government
policies. This allows economists to
assess the importance of border costs
imposed by government policy relative
to other border costs. Border-related
costs imposed by government policy
are further separated by economists
into two categories: tariffs and nontar-
iff barriers.
Tariffs are additional charges
added to the price of a good imported
from another country. The charge is
usually levied as a proportion of the
price, similar to a sales tax. Nontariff
barriers8 are loosely defined as all other
trade barriers imposed by national
governments. The most familiar of
these are quotas, which are restrictions
on the quantity of a good that can be
imported from a country. They also
include voluntary export restraints,
which occur when the exporting
country “voluntarily” agrees to limit
its exports to the importing country;
anti-dumping actions, which are taken
when foreign firms are suspected of
selling their goods at a price below that
in their home market;9 paperwork and
regulatory procedures encountered
6 In the case of intermediate goods such
as automobile engines, semiconductors,
textiles, and wheat, trade costs are the
difference between the “factory gate” price
and the purchase price by the next firm in the
production sequence.
7 Economists have studied the importance of
international networks in reducing the negative
effect of these country-level differences on
trade. For example, James Rauch and Vitor
Trindade find that trade flows are greater
between countries with larger shares of
Chinese population. They hypothesize that
this linguistic and cultural network facilitates
trade by reducing information and contract
enforcement costs otherwise present between
pairs of countries.
8 The main data source for tariffs and nontariff
barriers is the United Nations’ Conference on
Trade and Development TRAINS database.
This database lists eight broad categories of
trade control measures, which can be further
broken down into 150 sub-categories.
9 Dumping occurs when exports are sold in
foreign markets at a price below their domestic
price or production costs (according to U.S.
policy). An anti-dumping action is the filing,
by a domestic firm or industry, of an accusation
that a foreign firm or industry has dumped
goods in the domestic market. If the foreign
firms are found guilty of dumping, the domestic
government levies a duty on the goods in
question for a fixed period of time.
22 Q3 2007 Business Review www.philadelphiafed.org
In its simplest form, the gravity model is a
statistical relationship that seeks to explain
trade between two countries (bilateral trade)
by three forces: the economic sizes of the two
countries and the distance between them.
specifically at the national border;
and “softer” measures, such as product
labeling and product quality standards.
Border barriers not due to govern-
ment policy include information costs
(costs incurred by potential import-
ers in finding out more about the
goods they are buying); costs due to
exchange rate uncertainty, linguistic
barriers, or other cultural differences;
and contract enforcement costs.
International transportation costs are
freight charges and transport time
associated with moving goods from the
exporting to the importing country.
These costs include all freight and
time costs associated with moving a
good from the factory in the export-
ing country to the first port of entry in
the importing country. Freight charges
include trucking, shipping, and air
charges.
MEASURING TRADE COSTS
We can measure trade costs two
ways. The first is to simply measure
them directly from concrete data. The
second involves an indirect approach
whereby the costs are inferred using
an economic model of bilateral trade
flows known as the gravity model.
Border-Related Costs. Tariffs
are the easiest to measure because they
are directly collected by U.S. Customs
officials. Detailed data are collected
on tariff rates for thousands of goods.
There are two approaches to combin-
ing the detailed tariff data into an
overall average tariff measure for the
country. One approach is to com-
pute an average across all tariff rates.
While this way is simple to implement,
it is problematic because it weighs all
goods equally, regardless of whether
imports of the good are $10,000 or $10
billion.
A second approach is to weigh the
tariff rates according to the volume
of imports. In the above example,
the tariff on the heavily imported
good would have a weight 1 million
times larger than the weight on the
other good. However, this approach
is problematic, as well. Suppose that
tariff rates on Canadian apples were
so high that U.S. consumers did not
import them at all. Clearly, the tariffs
on apples are negatively affecting
imports.10 But precisely because their
impact is so negative that imports fall
to zero, they would have a zero weight.
In other words, this approach tends
to underestimate the true impact of
tariffs. Despite this shortcoming, most
calculations of overall average tariff
rates employ this second approach.
Calculating other border-related
trade costs, especially nontariff trade
barriers, is considerably more difficult.
In his study, Patrick Messerlin con-
verts the nontariff barriers into a tariff
equivalent.11 For quotas, Messerlin uses
direct information from case studies
to do the conversion. For the anti-
dumping measures, he either directly
converts them to tariff-equivalents12 or
uses the ratio of the “dumping” price
10 The following historical example illustrates
the effect of a tariff on the volume of imports.
In April 1984, the U.S. government increased
the tariff rate on heavyweight motorcycles
from 4.4 to 45 percent. From 1983 to 1984, the
total customs value (the value at the “entry
gate” of a country) of heavyweight motorcycle
imports (700-790 cubic centimeters of engine
displacement) fell from $5.7 million to $55,000.
11 In their survey, Anderson and van Wincoop
cite Messerlin’s article.
12 Ad valorem duties, which are taxes levied as a
percentage of the value of the imported goods,
are converted directly.
to the standard world price to convert
the measures to tax equivalents. These
different measures are summed to
an overall tariff equivalent and then
combined with the average tariff rate
to yield an estimate of border-related
trade costs imposed by government
policy.
For border-related trade costs not
related to government policy, econo-
mists generally rely on a combination
of direct and indirect measurement
based on the gravity model. For exam-
ple, the costs of not sharing a common
currency or a common language, as
well as security costs and information
costs, are calculated using the gravity
model.
In its simplest form, the gravity
model is a statistical relationship that
seeks to explain trade between two
countries (bilateral trade) by three
forces: the economic sizes of the two
countries and the distance between
them. Economists perform a statistical
analysis called a regression in order
to obtain an estimate, for example, of
the effect of an increase in distance on
trade flows.
More sophisticated versions of the
gravity model include additional vari-
ables to further explain bilateral trade
flows. In our context, the additional
variables capture whether the two
countries share a common currency,
language, border, trade agreement, or
legal system. While the lack of a com-
mon currency, for example, will not
show up as a direct add-on to the price
of the imported good as does a tariff,
it will still reduce trade. The gravity
Business Review Q3 2007 23www.philadelphiafed.org
regression provides a statistical means
for measuring the tariff-equivalent of
this reduction in trade.13
International Transport Costs.
The four primary modes of transport
are boat, rail, truck, and airplane.
The two key transport costs are direct
freight, or shipping, costs and travel
time. Exporters must decide on the
most efficient mode (or combination
of modes) of transport for their goods,
balancing per unit shipping costs and
travel time. In general, transport
by air is more expensive in terms of
freight costs but cheaper in terms
of time. In addition, countries with
poorly developed infrastructure (for
example, roads, airports, and ports)
will generally have higher freight costs
compared with countries that have
large stocks of infrastructure.
Anderson and van Wincoop
explore research on measuring freight
costs, where shippers and handlers are
interviewed, industry trade journals
are examined, and customs data are
analyzed. Customs data provide both
total imports including freight charges
and total imports excluding freight
charges. These customs data facilitate
the calculation of total freight charges
associated with importing.14
Anderson and van Wincoop ulti-
mately draw from an article by David
Hummels for a measure of internation-
al transport costs because he incorpo-
rates time into transportation costs.15
In his article, Hummels develops meth-
odologies to translate time costs into
dollars, from which the costs can then
be expressed as a percentage of the
value of the good transported. Then,
the freight costs and the time costs can
be totaled to yield an overall measure
of international transport costs.
ESTIMATES OF TRADE COSTS
Before beginning the discussion of
estimating trade costs, we advise the
reader to review the table and figure.
The table contains a breakdown of
the two main international trade costs
and their components. The figure
illustrates the importance of tariffs
and other border-related costs, on the
one hand, and international trans-
port costs, on the other hand, via a
hypothetical example of a pair of shoes
produced in a foreign country and
shipped to the U.S.
Tariffs. To arrive at a single
overall tariff measure for a country,
economists typically calculate average
tariffs according to the trade-weighted
method discussed above. Average
tariffs can differ across countries for a
number of reasons, but the most obvi-
ous and basic reason is that tariff rates
on individual goods are higher in one
country than in another.16 Anderson
TABLE
A Breakdown of Trade Costs*
Description
Percent Markup over the
Price of the Good
time costs 9
+ shipping costs 11
Total Transport Costs 21
tariffs and NTBs 8
language costs 7
currency costs 14
information costs 6
+ security costs 3
Total Border-Related Barriers 44%
TOTAL 74%
* The table presents the various trade costs described in this
paper, along with categorical
sub-totals and the final total. In totaling these components of
the overall trade cost, recall the
multiplicative accounting procedure employed by Anderson and
van Wincoop, described in
detail on page 25.
13 The tariff-equivalent of the effect of not
having a common currency could be calculated
if the gravity regression includes both tariff
rates and a variable for whether or not the two
countries share a common currency. Then,
the regression would indicate how much a
one-percentage-point change in tariffs reduces
trade, and it would also indicate how much not
sharing a common currency would reduce trade.
From these two pieces of information, the tariff-
equivalent of not sharing a common currency
can be calculated.
14 From these two measures it is possible to
calculate the average free on board (f.o.b.)
price (the price on the mode of transport
before any trade costs) as well as the average
cost, insurance, and freight (c.i.f.) price. The
difference between these two numbers is one
way of measuring transport costs.
15 See the 2001a article by Hummels.
24 Q3 2007 Business Review www.philadelphiafed.org
FIGURE
following numbers from Anderson and
van Wincoop indicate. At the low end
in 1999, Switzerland, Hong Kong, and
Singapore had 0 percent tariffs. At the
high end, Australia and Canada had
average tariffs of about 4.5 percent. In
between were New Zealand and the
major advanced economies, includ-
ing Japan, the United States, and the
European Union (EU), which had
and van Wincoop report that in 1999,
this trade-weighted average tariff rate
ranged from 0 to 30 percent across
different countries. They find that
developed countries’ tariffs tended
to be considerably lower than tariffs
in developing countries: Developing
countries tend to have tariffs of more
than 10 percent, while developed
countries’ tariffs are in the range of 0
to 5 percent.
While average tariffs in devel-
oped countries are low, there is some
variation between countries, as the
Foreign Home
*The other border barriers do not represent direct add-ons to the
price,
as in the case of tariffs or NTBs, for example. Rather, they
represent the
increase in the overall price of the good that would generate the
same
reduction in trade as these barriers. (See text.)
Note: This diagram of the trade-related mark-ups on a pair of
shoes that
costs $100 before wholesale and retail distribution is not based
on an
actual case study. It is a hypothetical example of a commonly
traded
good. The path followed from start to finish illustrates the
effect of the
different trade costs discussed in the paper.
START HERE FINISH
Retail Store
F
o
re
ig
n
B
o
rd
e
r H
o
m
e
B
o
rd
e
r
Off-load
container
at home
port
Container vessel
Shoe factory
gate price:
$57
Foreign
Port:
load into
container
+ 6$
Govt. Border Barriers*
• Tarrifs and NTBs
+ 25$
Other Border Barriers*
• Security
• Information costs
• Language barriers
• Currency
+ 6$
Govt. Border Barriers*
• Tariffs and NTBs
+ 12$
International Transport
Costs
Shoe import
price before
distribution
= $100
16 Another reason would be if a country happens
to heavily import those goods that face high
tariff rates. This would be unusual, however,
because high tariff rates presumably discourage
imports.
Business Review Q3 2007 25www.philadelphiafed.org
average tariffs of about 2 to 3 percent.
Nontariff Barriers. Tradition-
ally, the tendency has been to apply
nontariff barriers broadly to goods in
a few sectors, as Anderson and van
Wincoop show using United Nations
data.17 For example, nontariff barriers
in 1999 were applied, respectively, to
74 percent, 71 percent, and 39 percent
of the categories of goods in the food,
textiles, and wood-related sectors.18
This contrasts with the overall picture
of nontariff barrier coverage in 1999,
where only 1.5 percent of all goods
were protected by such barriers. Ad-
ditionally, there has been a rise in
other types of nontariff barriers, most
notably anti-dumping actions. If these
anti-dumping actions were included
in the nontariff barriers, the share of
all goods protected increases to 27.2
percent in 1999.19
Incorporating all of these types
of trade policy barriers into models,
researchers have found that for the EU
in 1999, tariffs and nontariff barriers
can be translated into a 7.7 percent
“tax” on industrial goods. In light of
the tariff numbers presented above,
this estimate indicates that for the EU,
at least, nontariff barriers exert more of
a tax than do tariffs.
Other Border-Related Barriers.
Using the gravity model described
above, a number of researchers have
been able to estimate, for developed
countries, the indirect trade costs at
national borders. Anderson and van
Wincoop summarize the main find-
ings as follows: (1) The costs of not
sharing the same language are roughly
7 percent of the value of the goods
traded. (2) The cost of employing dif-
ferent currencies is about 14 percent.
(3) Information costs are 6 percent. (4)
Security costs are 3 percent.
Overall, these nonpolicy border-
related costs equal 33 percent. Note
that the combined effect is not ob-
tained by simply adding up each border
cost. Rather, because each border cost
is applied to the total value of trade
inclusive of all other border costs, a
multiplicative formula must be used:
(1.07)*(1.14)*(1.06)*(1.03)-1 = 0.33
(or 33 percent).20 Adding government
policy barriers to these barriers yields
a total border-related trade cost of
(1.33)*(1.077)-1 = 0.44 (or 44 percent).
International Transport Costs.
Anderson and van Wincoop report
results on transport costs from another
article by David Hummels.21 Using
U.S. national customs data to get de-
tailed data on transport costs and then
calculating a simple average across all
of the costs, Hummels obtains a freight
transport cost estimate of 10.7 percent.
Anderson and van Wincoop also
report results from Hummels on-time
costs.22 As of 1998, about half the
value of U.S. exports are shipped by
air. Hummels imputes a willingness to
pay for saved time and translates that
into a percentage of the value of the
goods shipped. His estimate of U.S.
time costs is 9 percent.23 Combining
the freight costs and the time cost
estimates yields a total transport cost
of (1.107*1.09-1) = 0.21, or 21 percent
of the price of the good at the factory
gate.
To summarize, Anderson and van
Wincoop list two main sources of trade
costs: border barriers and international
transport costs. They then draw on the
existing empirical research to obtain a
rough approximation of each of these
costs for the United States, as well as
an approximation of the overall costs.
All border barriers, including tariffs,
nontariff barriers, and nonpolicy bar-
riers, add up to a 44 percent “tax” on
imports. Transportation costs are an
additional 21 percent. Combining
these costs — again using the multi-
plicative formula — yields the final
overall tax-equivalent international
trade cost of 74 percent of the factory
gate price.
Barriers to
international trade
impede the free
flow of goods and
services, leading to
increased production
by relatively inefficient
firms, thereby
reducing the overall
economic well-being
of societies.
17 United Nations Conference on Trade and
Development’s Trade Analysis & Information
System: TRAINS, and general insight from
the work of Jon Haveman available at:
www.macalester.edu/research/economics/
PAGE/HAVEMAN/Trade.Resources/
TradeConcordances.html.
18 In 2005 the World Trade Organization’s
textile quota system known as the Multi-Fiber
Agreement (MFA) was phased out. However,
subsequent dramatic changes in trade flows
have caused countries to invoke other methods
to control the amount of textiles traded.
19 All percentages reported are simple averages
of the nontariff barrier coverage ratios over
the appropriate categories of goods (that is,
the share of total goods in a category that are
subjected to nontariff barriers).
20 When border costs are small, the
multiplicative formula yields numbers very
similar to what would be obtained by adding
up the costs. However, when border costs are
large, the formula yields numbers quite different
from those obtained by simple addition.
21 See Hummels’ 2001b article.
22 See Hummels’ 2001a article.
23 This is a sharp decrease from 32 percent in
1950.
CONCLUSION
Barriers to international trade
impede the free flow of goods and
services, leading to increased produc-
tion by relatively inefficient firms,
thereby reducing the overall economic
well-being of societies. While the glo-
balization of the world’s economies has
seized the attention of policymakers,
the media, and economists, researchers
have recently collected a great deal of
evidence that indicates that barriers
to trade remain quite high. The types
and magnitudes of these barriers in
developed countries are highlighted in
an important recent article by James
Anderson and Eric van Wincoop.
Combining the results from cur-
rent research on trade costs, Anderson
and van Wincoop find that border
barriers and international transport
costs are equivalent to a 74 percent tax
on the factory gate price — 74 percent
seems like a high number; imagine a
sales tax that high! How is it that in
a rapidly globalizing world the costs of
international trade are still so high?
For evidence of these high trade costs,
it is useful to look at the United States
data in relation to the predictions of
theories of international trade.
The United States is the world’s
largest economy, yet its output is still
less than one-third of the world total.
If there were no costs to international
trade – if it were as costless to ship
goods to Europe and China as it is to
send an e-mail – most existing trade
theories would predict that the United
States would export about two-thirds
of its output. In fact, exports are only
about 10 percent of U.S. GDP. From
the sharp divergence of the theory’s
prediction and the actual data, we can
infer that costs to international trade
are quite high.
Anderson and van Wincoop’s
article shows that nonpolicy barriers
account for the vast majority of total
trade costs. Policy barriers, such as
tariffs and quotas, play a smaller role.
Will these nonpolicy and policy barri-
ers ever be completely eliminated? The
answer certainly is no. It is not possible
that the economists’ idealized world
of frictionless trade in which trade
costs and barriers are zero will ever be
realized.
For the world’s developed econo-
mies, however, significant reductions
in trade costs and increases in trade
can come from technological improve-
ments that reduce international trans-
portation costs, or from long-run policy
changes, such as policies to reduce
currency and information costs (or
language and cultural barriers). One
example is the recent adoption of a
single currency, the euro, by 12 nations
within Europe in 1999.24 In addition,
Anderson and van Wincoop show that
for certain categories of goods, policy
barriers have been strongly persistent
over time. If these barriers were to be
reduced significantly or eliminated,
this would further increase interna-
tional trade. Regardless of which bar-
riers fall, firms and consumers, on the
whole, would be better off. BR
26 Q3 2007 Business Review www.philadelphiafed.org
24 Between 2000 and 2005, euro-area trade
increased by 10.3 percent, which was larger
than the increase between 1993 and 1998 (8.3
percent). This is consistent with (but not proof
of) the notion that the adoption of the euro
reduced trade costs, thus increasing trade.
REFERENCES
Anderson, James E., and Eric van
Wincoop. “Trade Costs,” Journal of
Economic Literature, 42 (September 2004),
pp. 692-751.
Caves, Richard E., Jeffrey A. Frankel,
and Ronald W. Jones. World Trade and
Payments: An Introduction, 10th edition.
Addison Wesley: New York, 2006.
Ceglowski, Janet. “Has Globalization
Created a Borderless World?” Federal
Reserve Bank of Philadelphia Business
Review (March/April 1998), pp. 17-27.
Harrigan, James. “OECD Imports and
Trade Barriers in 1983,” Journal of
International Economics, 34:1-2 (1993), pp.
91-111.
Hummels, David. “Time as a Trade
Barrier,” manuscript, Purdue University
(2001a).
Hummels, David. “Toward a Geography
of Trade Costs,” manuscript, Purdue
University (2001b).
Krugman, Paul, and Maurice Obstfeld.
International Economics: Theory and Policy,
6th edition. Addison Wesley: New York,
2002.
Leduc, Sylvain. “International Risk
Sharing: Globalization Is Weaker Than
You Think,” Federal Reserve Bank of
Philadelphia Business Review (Second
Quarter 2005), pp. 18-25.
Messerlin, Patrick. Measuring the Cost
of Protection in Europe. Institute of
International Economics: Washington,
D.C. (2001).
Rauch, James E., and Vitor Trindade.
“Ethnic Chinese Networks in International
Trade,” Review of Economics and Statistics,
84:1 (2002), pp. 116-29.
Business Review Q3 2007 27www.philadelphiafed.org

More Related Content

Similar to GBY EDITH OSTAPIK AND KEI-MU YIEdith Ostapik is a rese.docx

International Economic Theories
International Economic TheoriesInternational Economic Theories
International Economic Theoriesfathima habeeb
 
Chapter 20 Globalization and Protectionism in the text Princi.docx
Chapter 20 Globalization and Protectionism in the text Princi.docxChapter 20 Globalization and Protectionism in the text Princi.docx
Chapter 20 Globalization and Protectionism in the text Princi.docxwalterl4
 
Lecture 3 Globalization and Emerging market (1).ppt
Lecture 3 Globalization  and Emerging market (1).pptLecture 3 Globalization  and Emerging market (1).ppt
Lecture 3 Globalization and Emerging market (1).pptHotelGreenPalace
 
Lecture 3 Globalization and Emerging market.ppt
Lecture 3 Globalization  and Emerging market.pptLecture 3 Globalization  and Emerging market.ppt
Lecture 3 Globalization and Emerging market.pptHotelGreenPalace
 
Unit 2 foreign trade topic 2 3 4 5
Unit 2 foreign trade topic 2 3 4 5Unit 2 foreign trade topic 2 3 4 5
Unit 2 foreign trade topic 2 3 4 5Mansi Tyagi
 
International Trade, Comparative Advantage, and Protectionism
International Trade, Comparative Advantage, and ProtectionismInternational Trade, Comparative Advantage, and Protectionism
International Trade, Comparative Advantage, and ProtectionismNoel Buensuceso
 
international trade and ...business.pptx
international trade and ...business.pptxinternational trade and ...business.pptx
international trade and ...business.pptxNidhiBhatnagar19
 
international trade and ...business.pptx
international trade and ...business.pptxinternational trade and ...business.pptx
international trade and ...business.pptxNidhiBhatnagar19
 
freetradevsprotectionppt-210530020036.pdf
freetradevsprotectionppt-210530020036.pdffreetradevsprotectionppt-210530020036.pdf
freetradevsprotectionppt-210530020036.pdfwexop40522
 
Free trade vs protection
Free trade vs protectionFree trade vs protection
Free trade vs protectionSonam Sangwan
 
International trade
International tradeInternational trade
International tradeIRFAN BASHIR
 
International business management
International business managementInternational business management
International business managementAshok Sharma
 
International trade ppt
International trade pptInternational trade ppt
International trade pptAndrea Mendoza
 
WTO & Trade Issues - International Trade Environment.pptx
WTO & Trade Issues - International Trade Environment.pptxWTO & Trade Issues - International Trade Environment.pptx
WTO & Trade Issues - International Trade Environment.pptxDiksha Vashisht
 
Chapter 1
Chapter 1Chapter 1
Chapter 1sriram
 

Similar to GBY EDITH OSTAPIK AND KEI-MU YIEdith Ostapik is a rese.docx (19)

International Economic Theories
International Economic TheoriesInternational Economic Theories
International Economic Theories
 
Chapter 20 Globalization and Protectionism in the text Princi.docx
Chapter 20 Globalization and Protectionism in the text Princi.docxChapter 20 Globalization and Protectionism in the text Princi.docx
Chapter 20 Globalization and Protectionism in the text Princi.docx
 
Lecture 3 Globalization and Emerging market (1).ppt
Lecture 3 Globalization  and Emerging market (1).pptLecture 3 Globalization  and Emerging market (1).ppt
Lecture 3 Globalization and Emerging market (1).ppt
 
Lecture 3 Globalization and Emerging market.ppt
Lecture 3 Globalization  and Emerging market.pptLecture 3 Globalization  and Emerging market.ppt
Lecture 3 Globalization and Emerging market.ppt
 
Unit 2 foreign trade topic 2 3 4 5
Unit 2 foreign trade topic 2 3 4 5Unit 2 foreign trade topic 2 3 4 5
Unit 2 foreign trade topic 2 3 4 5
 
International Trade, Comparative Advantage, and Protectionism
International Trade, Comparative Advantage, and ProtectionismInternational Trade, Comparative Advantage, and Protectionism
International Trade, Comparative Advantage, and Protectionism
 
Ch19
Ch19Ch19
Ch19
 
international trade and ...business.pptx
international trade and ...business.pptxinternational trade and ...business.pptx
international trade and ...business.pptx
 
international trade and ...business.pptx
international trade and ...business.pptxinternational trade and ...business.pptx
international trade and ...business.pptx
 
freetradevsprotectionppt-210530020036.pdf
freetradevsprotectionppt-210530020036.pdffreetradevsprotectionppt-210530020036.pdf
freetradevsprotectionppt-210530020036.pdf
 
Free trade vs protection
Free trade vs protectionFree trade vs protection
Free trade vs protection
 
International trade
International tradeInternational trade
International trade
 
International business management
International business managementInternational business management
International business management
 
International trade ppt
International trade pptInternational trade ppt
International trade ppt
 
Free trade
Free tradeFree trade
Free trade
 
WTO & Trade Issues - International Trade Environment.pptx
WTO & Trade Issues - International Trade Environment.pptxWTO & Trade Issues - International Trade Environment.pptx
WTO & Trade Issues - International Trade Environment.pptx
 
International trade
International tradeInternational trade
International trade
 
Chapter 1
Chapter 1Chapter 1
Chapter 1
 
INTERNATIONAL BUSINESS
INTERNATIONAL BUSINESSINTERNATIONAL BUSINESS
INTERNATIONAL BUSINESS
 

More from budbarber38650

 Assignment 1 Discussion Question Prosocial Behavior and Altrui.docx
 Assignment 1 Discussion Question Prosocial Behavior and Altrui.docx Assignment 1 Discussion Question Prosocial Behavior and Altrui.docx
 Assignment 1 Discussion Question Prosocial Behavior and Altrui.docxbudbarber38650
 
● what is name of the new unit and what topics will Professor Moss c.docx
● what is name of the new unit and what topics will Professor Moss c.docx● what is name of the new unit and what topics will Professor Moss c.docx
● what is name of the new unit and what topics will Professor Moss c.docxbudbarber38650
 
…Multiple intelligences describe an individual’s strengths or capac.docx
…Multiple intelligences describe an individual’s strengths or capac.docx…Multiple intelligences describe an individual’s strengths or capac.docx
…Multiple intelligences describe an individual’s strengths or capac.docxbudbarber38650
 
• World Cultural Perspective Paper Final SubmissionResources.docx
• World Cultural Perspective Paper Final SubmissionResources.docx• World Cultural Perspective Paper Final SubmissionResources.docx
• World Cultural Perspective Paper Final SubmissionResources.docxbudbarber38650
 
•       Write a story; explaining and analyzing how a ce.docx
•       Write a story; explaining and analyzing how a ce.docx•       Write a story; explaining and analyzing how a ce.docx
•       Write a story; explaining and analyzing how a ce.docxbudbarber38650
 
•Use the general topic suggestion to form the thesis statement.docx
•Use the general topic suggestion to form the thesis statement.docx•Use the general topic suggestion to form the thesis statement.docx
•Use the general topic suggestion to form the thesis statement.docxbudbarber38650
 
•The topic is culture adaptation ( adoption )16 slides.docx
•The topic is culture adaptation ( adoption )16 slides.docx•The topic is culture adaptation ( adoption )16 slides.docx
•The topic is culture adaptation ( adoption )16 slides.docxbudbarber38650
 
•Choose 1 of the department work flow processes, and put together a .docx
•Choose 1 of the department work flow processes, and put together a .docx•Choose 1 of the department work flow processes, and put together a .docx
•Choose 1 of the department work flow processes, and put together a .docxbudbarber38650
 
‘The problem is not that people remember through photographs, but th.docx
‘The problem is not that people remember through photographs, but th.docx‘The problem is not that people remember through photographs, but th.docx
‘The problem is not that people remember through photographs, but th.docxbudbarber38650
 
·                                     Choose an articleo.docx
·                                     Choose an articleo.docx·                                     Choose an articleo.docx
·                                     Choose an articleo.docxbudbarber38650
 
·You have been engaged to prepare the 2015 federal income tax re.docx
·You have been engaged to prepare the 2015 federal income tax re.docx·You have been engaged to prepare the 2015 federal income tax re.docx
·You have been engaged to prepare the 2015 federal income tax re.docxbudbarber38650
 
·Time Value of MoneyQuestion A·Discuss the significance .docx
·Time Value of MoneyQuestion A·Discuss the significance .docx·Time Value of MoneyQuestion A·Discuss the significance .docx
·Time Value of MoneyQuestion A·Discuss the significance .docxbudbarber38650
 
·Reviewthe steps of the communication model on in Ch. 2 of Bus.docx
·Reviewthe steps of the communication model on in Ch. 2 of Bus.docx·Reviewthe steps of the communication model on in Ch. 2 of Bus.docx
·Reviewthe steps of the communication model on in Ch. 2 of Bus.docxbudbarber38650
 
·Research Activity Sustainable supply chain can be viewed as.docx
·Research Activity Sustainable supply chain can be viewed as.docx·Research Activity Sustainable supply chain can be viewed as.docx
·Research Activity Sustainable supply chain can be viewed as.docxbudbarber38650
 
·DISCUSSION 1 – VARIOUS THEORIES – Discuss the following in 150-.docx
·DISCUSSION 1 – VARIOUS THEORIES – Discuss the following in 150-.docx·DISCUSSION 1 – VARIOUS THEORIES – Discuss the following in 150-.docx
·DISCUSSION 1 – VARIOUS THEORIES – Discuss the following in 150-.docxbudbarber38650
 
·Module 6 Essay ContentoThe ModuleWeek 6 essay require.docx
·Module 6 Essay ContentoThe ModuleWeek 6 essay require.docx·Module 6 Essay ContentoThe ModuleWeek 6 essay require.docx
·Module 6 Essay ContentoThe ModuleWeek 6 essay require.docxbudbarber38650
 
·Observe a group discussing a topic of interest such as a focus .docx
·Observe a group discussing a topic of interest such as a focus .docx·Observe a group discussing a topic of interest such as a focus .docx
·Observe a group discussing a topic of interest such as a focus .docxbudbarber38650
 
·Identify any program constraints, such as financial resources, .docx
·Identify any program constraints, such as financial resources, .docx·Identify any program constraints, such as financial resources, .docx
·Identify any program constraints, such as financial resources, .docxbudbarber38650
 
·Double-spaced·12-15 pages each chapterThe followi.docx
·Double-spaced·12-15 pages each chapterThe followi.docx·Double-spaced·12-15 pages each chapterThe followi.docx
·Double-spaced·12-15 pages each chapterThe followi.docxbudbarber38650
 
© 2019 Cengage. All Rights Reserved. Linear RegressionC.docx
© 2019 Cengage. All Rights Reserved.  Linear RegressionC.docx© 2019 Cengage. All Rights Reserved.  Linear RegressionC.docx
© 2019 Cengage. All Rights Reserved. Linear RegressionC.docxbudbarber38650
 

More from budbarber38650 (20)

 Assignment 1 Discussion Question Prosocial Behavior and Altrui.docx
 Assignment 1 Discussion Question Prosocial Behavior and Altrui.docx Assignment 1 Discussion Question Prosocial Behavior and Altrui.docx
 Assignment 1 Discussion Question Prosocial Behavior and Altrui.docx
 
● what is name of the new unit and what topics will Professor Moss c.docx
● what is name of the new unit and what topics will Professor Moss c.docx● what is name of the new unit and what topics will Professor Moss c.docx
● what is name of the new unit and what topics will Professor Moss c.docx
 
…Multiple intelligences describe an individual’s strengths or capac.docx
…Multiple intelligences describe an individual’s strengths or capac.docx…Multiple intelligences describe an individual’s strengths or capac.docx
…Multiple intelligences describe an individual’s strengths or capac.docx
 
• World Cultural Perspective Paper Final SubmissionResources.docx
• World Cultural Perspective Paper Final SubmissionResources.docx• World Cultural Perspective Paper Final SubmissionResources.docx
• World Cultural Perspective Paper Final SubmissionResources.docx
 
•       Write a story; explaining and analyzing how a ce.docx
•       Write a story; explaining and analyzing how a ce.docx•       Write a story; explaining and analyzing how a ce.docx
•       Write a story; explaining and analyzing how a ce.docx
 
•Use the general topic suggestion to form the thesis statement.docx
•Use the general topic suggestion to form the thesis statement.docx•Use the general topic suggestion to form the thesis statement.docx
•Use the general topic suggestion to form the thesis statement.docx
 
•The topic is culture adaptation ( adoption )16 slides.docx
•The topic is culture adaptation ( adoption )16 slides.docx•The topic is culture adaptation ( adoption )16 slides.docx
•The topic is culture adaptation ( adoption )16 slides.docx
 
•Choose 1 of the department work flow processes, and put together a .docx
•Choose 1 of the department work flow processes, and put together a .docx•Choose 1 of the department work flow processes, and put together a .docx
•Choose 1 of the department work flow processes, and put together a .docx
 
‘The problem is not that people remember through photographs, but th.docx
‘The problem is not that people remember through photographs, but th.docx‘The problem is not that people remember through photographs, but th.docx
‘The problem is not that people remember through photographs, but th.docx
 
·                                     Choose an articleo.docx
·                                     Choose an articleo.docx·                                     Choose an articleo.docx
·                                     Choose an articleo.docx
 
·You have been engaged to prepare the 2015 federal income tax re.docx
·You have been engaged to prepare the 2015 federal income tax re.docx·You have been engaged to prepare the 2015 federal income tax re.docx
·You have been engaged to prepare the 2015 federal income tax re.docx
 
·Time Value of MoneyQuestion A·Discuss the significance .docx
·Time Value of MoneyQuestion A·Discuss the significance .docx·Time Value of MoneyQuestion A·Discuss the significance .docx
·Time Value of MoneyQuestion A·Discuss the significance .docx
 
·Reviewthe steps of the communication model on in Ch. 2 of Bus.docx
·Reviewthe steps of the communication model on in Ch. 2 of Bus.docx·Reviewthe steps of the communication model on in Ch. 2 of Bus.docx
·Reviewthe steps of the communication model on in Ch. 2 of Bus.docx
 
·Research Activity Sustainable supply chain can be viewed as.docx
·Research Activity Sustainable supply chain can be viewed as.docx·Research Activity Sustainable supply chain can be viewed as.docx
·Research Activity Sustainable supply chain can be viewed as.docx
 
·DISCUSSION 1 – VARIOUS THEORIES – Discuss the following in 150-.docx
·DISCUSSION 1 – VARIOUS THEORIES – Discuss the following in 150-.docx·DISCUSSION 1 – VARIOUS THEORIES – Discuss the following in 150-.docx
·DISCUSSION 1 – VARIOUS THEORIES – Discuss the following in 150-.docx
 
·Module 6 Essay ContentoThe ModuleWeek 6 essay require.docx
·Module 6 Essay ContentoThe ModuleWeek 6 essay require.docx·Module 6 Essay ContentoThe ModuleWeek 6 essay require.docx
·Module 6 Essay ContentoThe ModuleWeek 6 essay require.docx
 
·Observe a group discussing a topic of interest such as a focus .docx
·Observe a group discussing a topic of interest such as a focus .docx·Observe a group discussing a topic of interest such as a focus .docx
·Observe a group discussing a topic of interest such as a focus .docx
 
·Identify any program constraints, such as financial resources, .docx
·Identify any program constraints, such as financial resources, .docx·Identify any program constraints, such as financial resources, .docx
·Identify any program constraints, such as financial resources, .docx
 
·Double-spaced·12-15 pages each chapterThe followi.docx
·Double-spaced·12-15 pages each chapterThe followi.docx·Double-spaced·12-15 pages each chapterThe followi.docx
·Double-spaced·12-15 pages each chapterThe followi.docx
 
© 2019 Cengage. All Rights Reserved. Linear RegressionC.docx
© 2019 Cengage. All Rights Reserved.  Linear RegressionC.docx© 2019 Cengage. All Rights Reserved.  Linear RegressionC.docx
© 2019 Cengage. All Rights Reserved. Linear RegressionC.docx
 

Recently uploaded

internship ppt on smartinternz platform as salesforce developer
internship ppt on smartinternz platform as salesforce developerinternship ppt on smartinternz platform as salesforce developer
internship ppt on smartinternz platform as salesforce developerunnathinaik
 
How to Make a Pirate ship Primary Education.pptx
How to Make a Pirate ship Primary Education.pptxHow to Make a Pirate ship Primary Education.pptx
How to Make a Pirate ship Primary Education.pptxmanuelaromero2013
 
Earth Day Presentation wow hello nice great
Earth Day Presentation wow hello nice greatEarth Day Presentation wow hello nice great
Earth Day Presentation wow hello nice greatYousafMalik24
 
call girls in Kamla Market (DELHI) 🔝 >༒9953330565🔝 genuine Escort Service 🔝✔️✔️
call girls in Kamla Market (DELHI) 🔝 >༒9953330565🔝 genuine Escort Service 🔝✔️✔️call girls in Kamla Market (DELHI) 🔝 >༒9953330565🔝 genuine Escort Service 🔝✔️✔️
call girls in Kamla Market (DELHI) 🔝 >༒9953330565🔝 genuine Escort Service 🔝✔️✔️9953056974 Low Rate Call Girls In Saket, Delhi NCR
 
Full Stack Web Development Course for Beginners
Full Stack Web Development Course  for BeginnersFull Stack Web Development Course  for Beginners
Full Stack Web Development Course for BeginnersSabitha Banu
 
Alper Gobel In Media Res Media Component
Alper Gobel In Media Res Media ComponentAlper Gobel In Media Res Media Component
Alper Gobel In Media Res Media ComponentInMediaRes1
 
EPANDING THE CONTENT OF AN OUTLINE using notes.pptx
EPANDING THE CONTENT OF AN OUTLINE using notes.pptxEPANDING THE CONTENT OF AN OUTLINE using notes.pptx
EPANDING THE CONTENT OF AN OUTLINE using notes.pptxRaymartEstabillo3
 
Interactive Powerpoint_How to Master effective communication
Interactive Powerpoint_How to Master effective communicationInteractive Powerpoint_How to Master effective communication
Interactive Powerpoint_How to Master effective communicationnomboosow
 
Biting mechanism of poisonous snakes.pdf
Biting mechanism of poisonous snakes.pdfBiting mechanism of poisonous snakes.pdf
Biting mechanism of poisonous snakes.pdfadityarao40181
 
How to Configure Email Server in Odoo 17
How to Configure Email Server in Odoo 17How to Configure Email Server in Odoo 17
How to Configure Email Server in Odoo 17Celine George
 
ECONOMIC CONTEXT - LONG FORM TV DRAMA - PPT
ECONOMIC CONTEXT - LONG FORM TV DRAMA - PPTECONOMIC CONTEXT - LONG FORM TV DRAMA - PPT
ECONOMIC CONTEXT - LONG FORM TV DRAMA - PPTiammrhaywood
 
CELL CYCLE Division Science 8 quarter IV.pptx
CELL CYCLE Division Science 8 quarter IV.pptxCELL CYCLE Division Science 8 quarter IV.pptx
CELL CYCLE Division Science 8 quarter IV.pptxJiesonDelaCerna
 
Introduction to AI in Higher Education_draft.pptx
Introduction to AI in Higher Education_draft.pptxIntroduction to AI in Higher Education_draft.pptx
Introduction to AI in Higher Education_draft.pptxpboyjonauth
 
KSHARA STURA .pptx---KSHARA KARMA THERAPY (CAUSTIC THERAPY)————IMP.OF KSHARA ...
KSHARA STURA .pptx---KSHARA KARMA THERAPY (CAUSTIC THERAPY)————IMP.OF KSHARA ...KSHARA STURA .pptx---KSHARA KARMA THERAPY (CAUSTIC THERAPY)————IMP.OF KSHARA ...
KSHARA STURA .pptx---KSHARA KARMA THERAPY (CAUSTIC THERAPY)————IMP.OF KSHARA ...M56BOOKSTORE PRODUCT/SERVICE
 
Organic Name Reactions for the students and aspirants of Chemistry12th.pptx
Organic Name Reactions  for the students and aspirants of Chemistry12th.pptxOrganic Name Reactions  for the students and aspirants of Chemistry12th.pptx
Organic Name Reactions for the students and aspirants of Chemistry12th.pptxVS Mahajan Coaching Centre
 
भारत-रोम व्यापार.pptx, Indo-Roman Trade,
भारत-रोम व्यापार.pptx, Indo-Roman Trade,भारत-रोम व्यापार.pptx, Indo-Roman Trade,
भारत-रोम व्यापार.pptx, Indo-Roman Trade,Virag Sontakke
 

Recently uploaded (20)

internship ppt on smartinternz platform as salesforce developer
internship ppt on smartinternz platform as salesforce developerinternship ppt on smartinternz platform as salesforce developer
internship ppt on smartinternz platform as salesforce developer
 
How to Make a Pirate ship Primary Education.pptx
How to Make a Pirate ship Primary Education.pptxHow to Make a Pirate ship Primary Education.pptx
How to Make a Pirate ship Primary Education.pptx
 
Earth Day Presentation wow hello nice great
Earth Day Presentation wow hello nice greatEarth Day Presentation wow hello nice great
Earth Day Presentation wow hello nice great
 
call girls in Kamla Market (DELHI) 🔝 >༒9953330565🔝 genuine Escort Service 🔝✔️✔️
call girls in Kamla Market (DELHI) 🔝 >༒9953330565🔝 genuine Escort Service 🔝✔️✔️call girls in Kamla Market (DELHI) 🔝 >༒9953330565🔝 genuine Escort Service 🔝✔️✔️
call girls in Kamla Market (DELHI) 🔝 >༒9953330565🔝 genuine Escort Service 🔝✔️✔️
 
9953330565 Low Rate Call Girls In Rohini Delhi NCR
9953330565 Low Rate Call Girls In Rohini  Delhi NCR9953330565 Low Rate Call Girls In Rohini  Delhi NCR
9953330565 Low Rate Call Girls In Rohini Delhi NCR
 
Full Stack Web Development Course for Beginners
Full Stack Web Development Course  for BeginnersFull Stack Web Development Course  for Beginners
Full Stack Web Development Course for Beginners
 
Model Call Girl in Tilak Nagar Delhi reach out to us at 🔝9953056974🔝
Model Call Girl in Tilak Nagar Delhi reach out to us at 🔝9953056974🔝Model Call Girl in Tilak Nagar Delhi reach out to us at 🔝9953056974🔝
Model Call Girl in Tilak Nagar Delhi reach out to us at 🔝9953056974🔝
 
ESSENTIAL of (CS/IT/IS) class 06 (database)
ESSENTIAL of (CS/IT/IS) class 06 (database)ESSENTIAL of (CS/IT/IS) class 06 (database)
ESSENTIAL of (CS/IT/IS) class 06 (database)
 
Alper Gobel In Media Res Media Component
Alper Gobel In Media Res Media ComponentAlper Gobel In Media Res Media Component
Alper Gobel In Media Res Media Component
 
EPANDING THE CONTENT OF AN OUTLINE using notes.pptx
EPANDING THE CONTENT OF AN OUTLINE using notes.pptxEPANDING THE CONTENT OF AN OUTLINE using notes.pptx
EPANDING THE CONTENT OF AN OUTLINE using notes.pptx
 
Interactive Powerpoint_How to Master effective communication
Interactive Powerpoint_How to Master effective communicationInteractive Powerpoint_How to Master effective communication
Interactive Powerpoint_How to Master effective communication
 
Biting mechanism of poisonous snakes.pdf
Biting mechanism of poisonous snakes.pdfBiting mechanism of poisonous snakes.pdf
Biting mechanism of poisonous snakes.pdf
 
How to Configure Email Server in Odoo 17
How to Configure Email Server in Odoo 17How to Configure Email Server in Odoo 17
How to Configure Email Server in Odoo 17
 
ECONOMIC CONTEXT - LONG FORM TV DRAMA - PPT
ECONOMIC CONTEXT - LONG FORM TV DRAMA - PPTECONOMIC CONTEXT - LONG FORM TV DRAMA - PPT
ECONOMIC CONTEXT - LONG FORM TV DRAMA - PPT
 
CELL CYCLE Division Science 8 quarter IV.pptx
CELL CYCLE Division Science 8 quarter IV.pptxCELL CYCLE Division Science 8 quarter IV.pptx
CELL CYCLE Division Science 8 quarter IV.pptx
 
Introduction to AI in Higher Education_draft.pptx
Introduction to AI in Higher Education_draft.pptxIntroduction to AI in Higher Education_draft.pptx
Introduction to AI in Higher Education_draft.pptx
 
KSHARA STURA .pptx---KSHARA KARMA THERAPY (CAUSTIC THERAPY)————IMP.OF KSHARA ...
KSHARA STURA .pptx---KSHARA KARMA THERAPY (CAUSTIC THERAPY)————IMP.OF KSHARA ...KSHARA STURA .pptx---KSHARA KARMA THERAPY (CAUSTIC THERAPY)————IMP.OF KSHARA ...
KSHARA STURA .pptx---KSHARA KARMA THERAPY (CAUSTIC THERAPY)————IMP.OF KSHARA ...
 
Organic Name Reactions for the students and aspirants of Chemistry12th.pptx
Organic Name Reactions  for the students and aspirants of Chemistry12th.pptxOrganic Name Reactions  for the students and aspirants of Chemistry12th.pptx
Organic Name Reactions for the students and aspirants of Chemistry12th.pptx
 
Model Call Girl in Bikash Puri Delhi reach out to us at 🔝9953056974🔝
Model Call Girl in Bikash Puri  Delhi reach out to us at 🔝9953056974🔝Model Call Girl in Bikash Puri  Delhi reach out to us at 🔝9953056974🔝
Model Call Girl in Bikash Puri Delhi reach out to us at 🔝9953056974🔝
 
भारत-रोम व्यापार.pptx, Indo-Roman Trade,
भारत-रोम व्यापार.pptx, Indo-Roman Trade,भारत-रोम व्यापार.pptx, Indo-Roman Trade,
भारत-रोम व्यापार.pptx, Indo-Roman Trade,
 

GBY EDITH OSTAPIK AND KEI-MU YIEdith Ostapik is a rese.docx

  • 1. G BY EDITH OSTAPIK AND KEI-MU YI Edith Ostapik is a research associate in the Philadelphia Fed’s Research Department. This article is available free of charge at www. philadelphiafed.org/econ/br/index. International Trade: Why We Don’t Have More of It Kei-Mu Yi is a vice president and economist in the Research Department of the Philadelphia Fed. He is also head of the department’s Macroeconomics section. 1 Source: The World Bank’s World Development Indicators (we use the world export share of world GDP). Since world
  • 2. exports = world imports, imports have risen by the same amount. 2 Previous Business Review articles have questioned the extent to which globalization has taken place. The article by Janet Ceglowski reviews research on barriers to international trade. Examining another dimension of globalization, Sylvain Leduc explores the lack of international diversification of investment portfolios. 3 They estimate an overall average increase of 74 percent in the prices of goods in these countries. Globalization has many facets. One of the most important is the enor- mous increase in international trade. Over the past 40 years, world exports as a share of output have doubled to almost 25 percent of world output.1 However, despite globalization and the increasing share of output that is exported and imported internationally, economic evidence suggests that sig- nificant barriers to international trade still exist.2 We will summarize the lat- est developments in the measurement of international trade barriers, drawing mainly from a recent comprehensive survey on the subject by James Ander- son and Eric van Wincoop. In their lobalization has led to an enormous increase
  • 3. in international trade. Over the past 40 years, world exports as a share of output have doubled to almost 25 percent of world output. However, despite this enormous increase, economic evidence suggests that significant barriers to international trade still exist. In this article, Edith Ostapik and Kei-Mu Yi summarize the latest developments in the measurement of international trade barriers. survey, these authors report estimates of the magnitudes of different catego- ries of international trade costs. They find that, on average, international trade costs almost double the price of goods in developed countries.3 The primary policy implication of the existing research is that globaliza- tion still has a long way to go, so that there is still plenty of room for trade to grow. Growth in trade will likely occur primarily through technological changes that reduce transportation or communication costs or from long- run policy choices, such as a national currency or language. Reduction in policy-related barriers, such as tariffs, will also play a role. WHY AND HOW TRADE COSTS REDUCE TRADE The core idea underlying the benefits of international trade goes
  • 4. back to Adam Smith and his famous pin factory parable. According to Smith, when each worker specializes in doing only those tasks he is best suited to do, a factory achieves its maximum economic efficiency. Smith and later economists extended this argument from firms to countries. Economic efficiency occurs when each country specializes in making and exporting only those goods it is relatively efficient at producing. In turn, each country imports those goods other countries produce relatively efficiently.4 4 David Ricardo formalized the notion of relative efficiency in his theory of comparative advantage. One of the most powerful ideas in economics, comparative advantage shows that countries can gain from trading with each other, even if one country is more productive at producing every single good than another country. Textbooks on international economics (for example, the one by Richard Caves, Jeffrey Frankel, and Ronald Jones or the one by Paul Krugman and Maurice Obstfeld) provide a more detailed description of comparative advantage. 20 Q3 2007 Business Review www.philadelphiafed.org Business Review Q3 2007 21www.philadelphiafed.org International trade enhances a society’s economic well-being because it facilitates
  • 5. specialization in production. In other words, international trade enhances a society’s economic well- being because it facilitates specializa- tion in production. With trade, prices consumers pay for goods are lower than those they would pay without trade. According to Smith and later economists, when trade is free and unfettered, a society maximizes its economic well-being. Barriers to international trade pre- vent the efficient outcome described above from occurring. For example, because these barriers raise the costs of purchasing imported goods, U.S. consumers would buy fewer foreign goods, and foreign consumers would buy fewer U.S. goods. To satisfy the demand for products that previously had been imported under free trade, each country would now be making more goods it is not relatively efficient at producing. In the presence of inter- national trade barriers, there would be less specialization, prices would be higher, and, overall, consumers in all countries would be worse off. THE TWO MAIN TYPES OF TRADE COSTS In 19th-century England, econo- mist David Ricardo used these core
  • 6. ideas of the benefits to international trade to argue against a pressing politi- cal barrier to trade: the Corn Laws, which protected British agriculture and kept domestic food prices high. Since then, economists have studied many other barriers to trade. We will describe these barriers in terms of costs, following the convention used by Anderson and van Wincoop.5 Broadly, trade costs are all costs incurred from the time a good leaves 5 Anderson and van Wincoop divide trade costs into three broad categories: border-related costs, international transportation costs, and distribution costs. We focus only on those costs associated with international trade: border- related costs and international transport costs. the factory or its place of production to the time it is purchased by the end-user. Such costs can be incurred internationally (for example, at the border) or domestically (that is, within a country). In the case of consumer goods such as automobiles, televisions, clothing, and food, trade costs are the difference between the price at the “factory gate” and the retail price.6 International trade costs can be broadly divided into two main catego- ries: border-related costs and interna-
  • 7. tional transportation costs. Border-re- lated costs encompass the broad range of trade barriers encountered between nations, excluding international trans- portation. These barriers include costs that occur specifically at the border, such as tariffs, quotas, and paperwork due to customs and other regulations, as well as those differences between countries that could affect trade, such as different currencies, languages, or laws (contract enforcement).7 Together with international transport costs, these items make up the costs incurred internationally. Border-related costs can be classified based on whether they are attributable to (national) government policies. This allows economists to assess the importance of border costs imposed by government policy relative to other border costs. Border-related costs imposed by government policy are further separated by economists into two categories: tariffs and nontar- iff barriers. Tariffs are additional charges added to the price of a good imported from another country. The charge is usually levied as a proportion of the price, similar to a sales tax. Nontariff barriers8 are loosely defined as all other
  • 8. trade barriers imposed by national governments. The most familiar of these are quotas, which are restrictions on the quantity of a good that can be imported from a country. They also include voluntary export restraints, which occur when the exporting country “voluntarily” agrees to limit its exports to the importing country; anti-dumping actions, which are taken when foreign firms are suspected of selling their goods at a price below that in their home market;9 paperwork and regulatory procedures encountered 6 In the case of intermediate goods such as automobile engines, semiconductors, textiles, and wheat, trade costs are the difference between the “factory gate” price and the purchase price by the next firm in the production sequence. 7 Economists have studied the importance of international networks in reducing the negative effect of these country-level differences on trade. For example, James Rauch and Vitor Trindade find that trade flows are greater between countries with larger shares of Chinese population. They hypothesize that this linguistic and cultural network facilitates trade by reducing information and contract enforcement costs otherwise present between pairs of countries. 8 The main data source for tariffs and nontariff barriers is the United Nations’ Conference on
  • 9. Trade and Development TRAINS database. This database lists eight broad categories of trade control measures, which can be further broken down into 150 sub-categories. 9 Dumping occurs when exports are sold in foreign markets at a price below their domestic price or production costs (according to U.S. policy). An anti-dumping action is the filing, by a domestic firm or industry, of an accusation that a foreign firm or industry has dumped goods in the domestic market. If the foreign firms are found guilty of dumping, the domestic government levies a duty on the goods in question for a fixed period of time. 22 Q3 2007 Business Review www.philadelphiafed.org In its simplest form, the gravity model is a statistical relationship that seeks to explain trade between two countries (bilateral trade) by three forces: the economic sizes of the two countries and the distance between them. specifically at the national border; and “softer” measures, such as product labeling and product quality standards. Border barriers not due to govern- ment policy include information costs (costs incurred by potential import- ers in finding out more about the goods they are buying); costs due to exchange rate uncertainty, linguistic
  • 10. barriers, or other cultural differences; and contract enforcement costs. International transportation costs are freight charges and transport time associated with moving goods from the exporting to the importing country. These costs include all freight and time costs associated with moving a good from the factory in the export- ing country to the first port of entry in the importing country. Freight charges include trucking, shipping, and air charges. MEASURING TRADE COSTS We can measure trade costs two ways. The first is to simply measure them directly from concrete data. The second involves an indirect approach whereby the costs are inferred using an economic model of bilateral trade flows known as the gravity model. Border-Related Costs. Tariffs are the easiest to measure because they are directly collected by U.S. Customs officials. Detailed data are collected on tariff rates for thousands of goods. There are two approaches to combin- ing the detailed tariff data into an overall average tariff measure for the country. One approach is to com- pute an average across all tariff rates. While this way is simple to implement, it is problematic because it weighs all
  • 11. goods equally, regardless of whether imports of the good are $10,000 or $10 billion. A second approach is to weigh the tariff rates according to the volume of imports. In the above example, the tariff on the heavily imported good would have a weight 1 million times larger than the weight on the other good. However, this approach is problematic, as well. Suppose that tariff rates on Canadian apples were so high that U.S. consumers did not import them at all. Clearly, the tariffs on apples are negatively affecting imports.10 But precisely because their impact is so negative that imports fall to zero, they would have a zero weight. In other words, this approach tends to underestimate the true impact of tariffs. Despite this shortcoming, most calculations of overall average tariff rates employ this second approach. Calculating other border-related trade costs, especially nontariff trade barriers, is considerably more difficult. In his study, Patrick Messerlin con- verts the nontariff barriers into a tariff equivalent.11 For quotas, Messerlin uses direct information from case studies to do the conversion. For the anti- dumping measures, he either directly
  • 12. converts them to tariff-equivalents12 or uses the ratio of the “dumping” price 10 The following historical example illustrates the effect of a tariff on the volume of imports. In April 1984, the U.S. government increased the tariff rate on heavyweight motorcycles from 4.4 to 45 percent. From 1983 to 1984, the total customs value (the value at the “entry gate” of a country) of heavyweight motorcycle imports (700-790 cubic centimeters of engine displacement) fell from $5.7 million to $55,000. 11 In their survey, Anderson and van Wincoop cite Messerlin’s article. 12 Ad valorem duties, which are taxes levied as a percentage of the value of the imported goods, are converted directly. to the standard world price to convert the measures to tax equivalents. These different measures are summed to an overall tariff equivalent and then combined with the average tariff rate to yield an estimate of border-related trade costs imposed by government policy. For border-related trade costs not related to government policy, econo- mists generally rely on a combination of direct and indirect measurement based on the gravity model. For exam- ple, the costs of not sharing a common
  • 13. currency or a common language, as well as security costs and information costs, are calculated using the gravity model. In its simplest form, the gravity model is a statistical relationship that seeks to explain trade between two countries (bilateral trade) by three forces: the economic sizes of the two countries and the distance between them. Economists perform a statistical analysis called a regression in order to obtain an estimate, for example, of the effect of an increase in distance on trade flows. More sophisticated versions of the gravity model include additional vari- ables to further explain bilateral trade flows. In our context, the additional variables capture whether the two countries share a common currency, language, border, trade agreement, or legal system. While the lack of a com- mon currency, for example, will not show up as a direct add-on to the price of the imported good as does a tariff, it will still reduce trade. The gravity Business Review Q3 2007 23www.philadelphiafed.org regression provides a statistical means for measuring the tariff-equivalent of
  • 14. this reduction in trade.13 International Transport Costs. The four primary modes of transport are boat, rail, truck, and airplane. The two key transport costs are direct freight, or shipping, costs and travel time. Exporters must decide on the most efficient mode (or combination of modes) of transport for their goods, balancing per unit shipping costs and travel time. In general, transport by air is more expensive in terms of freight costs but cheaper in terms of time. In addition, countries with poorly developed infrastructure (for example, roads, airports, and ports) will generally have higher freight costs compared with countries that have large stocks of infrastructure. Anderson and van Wincoop explore research on measuring freight costs, where shippers and handlers are interviewed, industry trade journals are examined, and customs data are analyzed. Customs data provide both total imports including freight charges and total imports excluding freight charges. These customs data facilitate the calculation of total freight charges associated with importing.14 Anderson and van Wincoop ulti- mately draw from an article by David
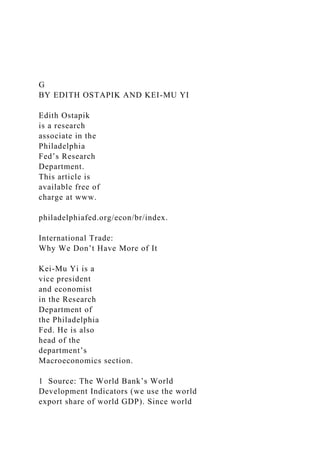
  • 15. Hummels for a measure of internation- al transport costs because he incorpo- rates time into transportation costs.15 In his article, Hummels develops meth- odologies to translate time costs into dollars, from which the costs can then be expressed as a percentage of the value of the good transported. Then, the freight costs and the time costs can be totaled to yield an overall measure of international transport costs. ESTIMATES OF TRADE COSTS Before beginning the discussion of estimating trade costs, we advise the reader to review the table and figure. The table contains a breakdown of the two main international trade costs and their components. The figure illustrates the importance of tariffs and other border-related costs, on the one hand, and international trans- port costs, on the other hand, via a hypothetical example of a pair of shoes produced in a foreign country and shipped to the U.S. Tariffs. To arrive at a single overall tariff measure for a country, economists typically calculate average tariffs according to the trade-weighted method discussed above. Average tariffs can differ across countries for a
  • 16. number of reasons, but the most obvi- ous and basic reason is that tariff rates on individual goods are higher in one country than in another.16 Anderson TABLE A Breakdown of Trade Costs* Description Percent Markup over the Price of the Good time costs 9 + shipping costs 11 Total Transport Costs 21 tariffs and NTBs 8 language costs 7 currency costs 14 information costs 6 + security costs 3 Total Border-Related Barriers 44% TOTAL 74% * The table presents the various trade costs described in this paper, along with categorical
  • 17. sub-totals and the final total. In totaling these components of the overall trade cost, recall the multiplicative accounting procedure employed by Anderson and van Wincoop, described in detail on page 25. 13 The tariff-equivalent of the effect of not having a common currency could be calculated if the gravity regression includes both tariff rates and a variable for whether or not the two countries share a common currency. Then, the regression would indicate how much a one-percentage-point change in tariffs reduces trade, and it would also indicate how much not sharing a common currency would reduce trade. From these two pieces of information, the tariff- equivalent of not sharing a common currency can be calculated. 14 From these two measures it is possible to calculate the average free on board (f.o.b.) price (the price on the mode of transport before any trade costs) as well as the average cost, insurance, and freight (c.i.f.) price. The difference between these two numbers is one way of measuring transport costs. 15 See the 2001a article by Hummels. 24 Q3 2007 Business Review www.philadelphiafed.org FIGURE following numbers from Anderson and
  • 18. van Wincoop indicate. At the low end in 1999, Switzerland, Hong Kong, and Singapore had 0 percent tariffs. At the high end, Australia and Canada had average tariffs of about 4.5 percent. In between were New Zealand and the major advanced economies, includ- ing Japan, the United States, and the European Union (EU), which had and van Wincoop report that in 1999, this trade-weighted average tariff rate ranged from 0 to 30 percent across different countries. They find that developed countries’ tariffs tended to be considerably lower than tariffs in developing countries: Developing countries tend to have tariffs of more than 10 percent, while developed countries’ tariffs are in the range of 0 to 5 percent. While average tariffs in devel- oped countries are low, there is some variation between countries, as the Foreign Home *The other border barriers do not represent direct add-ons to the price, as in the case of tariffs or NTBs, for example. Rather, they represent the increase in the overall price of the good that would generate the same reduction in trade as these barriers. (See text.)
  • 19. Note: This diagram of the trade-related mark-ups on a pair of shoes that costs $100 before wholesale and retail distribution is not based on an actual case study. It is a hypothetical example of a commonly traded good. The path followed from start to finish illustrates the effect of the different trade costs discussed in the paper. START HERE FINISH Retail Store F o re ig n B o rd e r H o m e B
  • 20. o rd e r Off-load container at home port Container vessel Shoe factory gate price: $57 Foreign Port: load into container + 6$ Govt. Border Barriers* • Tarrifs and NTBs + 25$ Other Border Barriers* • Security • Information costs • Language barriers • Currency
  • 21. + 6$ Govt. Border Barriers* • Tariffs and NTBs + 12$ International Transport Costs Shoe import price before distribution = $100 16 Another reason would be if a country happens to heavily import those goods that face high tariff rates. This would be unusual, however, because high tariff rates presumably discourage imports. Business Review Q3 2007 25www.philadelphiafed.org average tariffs of about 2 to 3 percent. Nontariff Barriers. Tradition- ally, the tendency has been to apply nontariff barriers broadly to goods in a few sectors, as Anderson and van Wincoop show using United Nations data.17 For example, nontariff barriers in 1999 were applied, respectively, to 74 percent, 71 percent, and 39 percent of the categories of goods in the food,
  • 22. textiles, and wood-related sectors.18 This contrasts with the overall picture of nontariff barrier coverage in 1999, where only 1.5 percent of all goods were protected by such barriers. Ad- ditionally, there has been a rise in other types of nontariff barriers, most notably anti-dumping actions. If these anti-dumping actions were included in the nontariff barriers, the share of all goods protected increases to 27.2 percent in 1999.19 Incorporating all of these types of trade policy barriers into models, researchers have found that for the EU in 1999, tariffs and nontariff barriers can be translated into a 7.7 percent “tax” on industrial goods. In light of the tariff numbers presented above, this estimate indicates that for the EU, at least, nontariff barriers exert more of a tax than do tariffs. Other Border-Related Barriers. Using the gravity model described above, a number of researchers have been able to estimate, for developed countries, the indirect trade costs at national borders. Anderson and van Wincoop summarize the main find- ings as follows: (1) The costs of not sharing the same language are roughly 7 percent of the value of the goods
  • 23. traded. (2) The cost of employing dif- ferent currencies is about 14 percent. (3) Information costs are 6 percent. (4) Security costs are 3 percent. Overall, these nonpolicy border- related costs equal 33 percent. Note that the combined effect is not ob- tained by simply adding up each border cost. Rather, because each border cost is applied to the total value of trade inclusive of all other border costs, a multiplicative formula must be used: (1.07)*(1.14)*(1.06)*(1.03)-1 = 0.33 (or 33 percent).20 Adding government policy barriers to these barriers yields a total border-related trade cost of (1.33)*(1.077)-1 = 0.44 (or 44 percent). International Transport Costs. Anderson and van Wincoop report results on transport costs from another article by David Hummels.21 Using U.S. national customs data to get de- tailed data on transport costs and then calculating a simple average across all of the costs, Hummels obtains a freight transport cost estimate of 10.7 percent. Anderson and van Wincoop also report results from Hummels on-time costs.22 As of 1998, about half the value of U.S. exports are shipped by air. Hummels imputes a willingness to pay for saved time and translates that
  • 24. into a percentage of the value of the goods shipped. His estimate of U.S. time costs is 9 percent.23 Combining the freight costs and the time cost estimates yields a total transport cost of (1.107*1.09-1) = 0.21, or 21 percent of the price of the good at the factory gate. To summarize, Anderson and van Wincoop list two main sources of trade costs: border barriers and international transport costs. They then draw on the existing empirical research to obtain a rough approximation of each of these costs for the United States, as well as an approximation of the overall costs. All border barriers, including tariffs, nontariff barriers, and nonpolicy bar- riers, add up to a 44 percent “tax” on imports. Transportation costs are an additional 21 percent. Combining these costs — again using the multi- plicative formula — yields the final overall tax-equivalent international trade cost of 74 percent of the factory gate price. Barriers to international trade impede the free flow of goods and services, leading to increased production by relatively inefficient firms, thereby
  • 25. reducing the overall economic well-being of societies. 17 United Nations Conference on Trade and Development’s Trade Analysis & Information System: TRAINS, and general insight from the work of Jon Haveman available at: www.macalester.edu/research/economics/ PAGE/HAVEMAN/Trade.Resources/ TradeConcordances.html. 18 In 2005 the World Trade Organization’s textile quota system known as the Multi-Fiber Agreement (MFA) was phased out. However, subsequent dramatic changes in trade flows have caused countries to invoke other methods to control the amount of textiles traded. 19 All percentages reported are simple averages of the nontariff barrier coverage ratios over the appropriate categories of goods (that is, the share of total goods in a category that are subjected to nontariff barriers). 20 When border costs are small, the multiplicative formula yields numbers very similar to what would be obtained by adding up the costs. However, when border costs are large, the formula yields numbers quite different from those obtained by simple addition. 21 See Hummels’ 2001b article. 22 See Hummels’ 2001a article.
  • 26. 23 This is a sharp decrease from 32 percent in 1950. CONCLUSION Barriers to international trade impede the free flow of goods and services, leading to increased produc- tion by relatively inefficient firms, thereby reducing the overall economic well-being of societies. While the glo- balization of the world’s economies has seized the attention of policymakers, the media, and economists, researchers have recently collected a great deal of evidence that indicates that barriers to trade remain quite high. The types and magnitudes of these barriers in developed countries are highlighted in an important recent article by James Anderson and Eric van Wincoop. Combining the results from cur- rent research on trade costs, Anderson and van Wincoop find that border barriers and international transport costs are equivalent to a 74 percent tax on the factory gate price — 74 percent seems like a high number; imagine a sales tax that high! How is it that in a rapidly globalizing world the costs of international trade are still so high? For evidence of these high trade costs, it is useful to look at the United States
  • 27. data in relation to the predictions of theories of international trade. The United States is the world’s largest economy, yet its output is still less than one-third of the world total. If there were no costs to international trade – if it were as costless to ship goods to Europe and China as it is to send an e-mail – most existing trade theories would predict that the United States would export about two-thirds of its output. In fact, exports are only about 10 percent of U.S. GDP. From the sharp divergence of the theory’s prediction and the actual data, we can infer that costs to international trade are quite high. Anderson and van Wincoop’s article shows that nonpolicy barriers account for the vast majority of total trade costs. Policy barriers, such as tariffs and quotas, play a smaller role. Will these nonpolicy and policy barri- ers ever be completely eliminated? The answer certainly is no. It is not possible that the economists’ idealized world of frictionless trade in which trade costs and barriers are zero will ever be realized. For the world’s developed econo- mies, however, significant reductions in trade costs and increases in trade
  • 28. can come from technological improve- ments that reduce international trans- portation costs, or from long-run policy changes, such as policies to reduce currency and information costs (or language and cultural barriers). One example is the recent adoption of a single currency, the euro, by 12 nations within Europe in 1999.24 In addition, Anderson and van Wincoop show that for certain categories of goods, policy barriers have been strongly persistent over time. If these barriers were to be reduced significantly or eliminated, this would further increase interna- tional trade. Regardless of which bar- riers fall, firms and consumers, on the whole, would be better off. BR 26 Q3 2007 Business Review www.philadelphiafed.org 24 Between 2000 and 2005, euro-area trade increased by 10.3 percent, which was larger than the increase between 1993 and 1998 (8.3 percent). This is consistent with (but not proof of) the notion that the adoption of the euro reduced trade costs, thus increasing trade. REFERENCES Anderson, James E., and Eric van Wincoop. “Trade Costs,” Journal of Economic Literature, 42 (September 2004), pp. 692-751.
  • 29. Caves, Richard E., Jeffrey A. Frankel, and Ronald W. Jones. World Trade and Payments: An Introduction, 10th edition. Addison Wesley: New York, 2006. Ceglowski, Janet. “Has Globalization Created a Borderless World?” Federal Reserve Bank of Philadelphia Business Review (March/April 1998), pp. 17-27. Harrigan, James. “OECD Imports and Trade Barriers in 1983,” Journal of International Economics, 34:1-2 (1993), pp. 91-111. Hummels, David. “Time as a Trade Barrier,” manuscript, Purdue University (2001a). Hummels, David. “Toward a Geography of Trade Costs,” manuscript, Purdue University (2001b). Krugman, Paul, and Maurice Obstfeld. International Economics: Theory and Policy, 6th edition. Addison Wesley: New York, 2002. Leduc, Sylvain. “International Risk Sharing: Globalization Is Weaker Than You Think,” Federal Reserve Bank of Philadelphia Business Review (Second Quarter 2005), pp. 18-25. Messerlin, Patrick. Measuring the Cost
  • 30. of Protection in Europe. Institute of International Economics: Washington, D.C. (2001). Rauch, James E., and Vitor Trindade. “Ethnic Chinese Networks in International Trade,” Review of Economics and Statistics, 84:1 (2002), pp. 116-29. Business Review Q3 2007 27www.philadelphiafed.org