SlideShare a Scribd company logo
1 of 2
Download to read offline
FEDERAL FINANCE (OUR CHILDREN'S AND GRANDCHILDREN'S FUTURE)
                                                   Federal Receipts, Outlays and Debt

In the fourth month of fiscal 2009, there was a deficit of $569 billion, compared with a deficit of $89 billion a year earlier. 
According to historical annual increases in Government outlays, our country will experience a 57% increase in Federal Income Taxes. And a 
increase of 167% in our Accumulated Federal Debt by the year 2020.


                              Federal        Increase/    Government    Increase in     Surplus/                   Federal       Increase/
                            Tax Receipts      decrease     Spending    Government       Deficit                     Debt         Decrease
                                                            Outlays      Spending
      1992                     $1,091                       $1,381                       ‐$290                     $4,001
      1993    CLINTON          $1,154          5.46%        $1,409        1.99%          ‐$255                     $4,351         8.04%
      1994    CLINTON          $1,258          8.27%        $1,461        3.56%          ‐$203                     $4,643         6.29%
      1995    CLINTON          $1,351          6.88%        $1,515        3.56%          ‐$164                     $4,920         5.63%
      1996    CLINTON          $1,453          7.02%        $1,560        2.88%          ‐$107                     $5,181         5.04%
      1997    CLINTON          $1,579
                               $1 579          7.98%
                                               7 98%        $1,601
                                                            $1 601        2.56%
                                                                          2 56%          ‐$22                      $5,369
                                                                                                                   $5 369         3.50%
                                                                                                                                  3 50%
      1998    CLINTON          $1,722          8.30%        $1,652        3.09%           $70                      $5,478         1.99%
      1999    CLINTON          $1,827          5.75%        $1,702        2.94%          $125                      $5,605         2.27%
      2000    CLINTON          $2,025          9.78%        $1,789        4.86%          $236                      $5,628         0.41%
      2001     BUSH            $1,991          ‐1.71%       $1,863        3.97%          $128                      $5,769         2.44%
      2002     BUSH            $1,853          ‐7.45%       $2,011        7.36%          ‐$158                     $6,198         6.92%
      2003     BUSH            $1,782          ‐3.98%       $2,160        6.90%          ‐$378                     $6,760         8.31%
      2004     BUSH            $1,880          5.21%        $2,293        5.80%          ‐$413                     $7,354         8.08%
      2005     BUSH            $2,153         12.68%        $2,472        7.24%          ‐$319                     $7,905         6.97%
      2006     BUSH            $2,407         10.55%        $2,655        6.89%          ‐$248                     $8,451         6.46%
      2007     BUSH            $2,568          6.27%        $2,730        2.75%          ‐$162                     $8,950         5.58%
      2008     BUSH            $2,524          ‐1.74%       $2,982        8.45%          ‐$458                     $9,985         10.37%
      2009    OBAMA            $2,186         ‐15.46%       $3,938        24.28%        ‐$1,752                    $12,704        21.40%
      2010    OBAMA            $2,186
                               $2 186          0.00%
                                               0 00%        $3,938
                                                            $3 938        0.00%
                                                                          0 00%         ‐$1,752
                                                                                         $1 752                    $14,456
                                                                                                                   $14 456        12.12%
                                                                                                                                  12 12%
      2011    OBAMA            $2,186          0.00%        $3,938        0.00%         ‐$1,752                    $16,208        10.81%
      2012    OBAMA            $2,186          0.00%        $3,938        0.00%         ‐$1,752                    $17,960        9.76%
      2013    OBAMA            $2,186          0.00%        $3,938        0.00%         ‐$1,752                    $19,712        8.89%
      2014    OBAMA            $2,186          0.00%        $3,938        0.00%         ‐$1,752                    $21,464        8.16%
      2015    OBAMA            $2,186          0.00%        $3,938        0.00%         ‐$1,752                    $23,216        7.55%
      2016    OBAMA            $2,186          0.00%        $3,938        0.00%         ‐$1,752                    $24,968        7.02%
      2017    OBAMA            $2,186          0.00%        $3,938        0.00%         ‐$1,752                    $26,720        6.56%
      2018    OBAMA            $2,186          0.00%        $3,938        0.00%         ‐$1,752                    $28,472        6.15%
      2019    OBAMA            $2,186          0.00%        $3,938        0.00%         ‐$1,752                    $30,224        5.80%
                                                                                                                                    7%
United States Federal, State and Local Government Spending
Fiscal Year 2009
Fiscal Year 2009          GDP: $14,291.0 billion(1)
                          GDP: $14,291.0 billion(1)
Amounts in $ billion
                          rate of tax increase                                         5%
                          rate of increase (Gov. Spending)                             4%
                                                                        YEAR
Government Expense                   2009          2010         2011       2012       2013       2014       2015
          Social Security            $712          $740         $770       $801       $833       $866       $901
             Medicare                $724          $753         $783       $814       $847       $881       $916
            Education                 $99          $103         $107       $111       $116       $120       $125
             Defense                 $819          $852         $886       $921       $958       $996      $1,036
             Welfare                 $283          $294         $306       $318       $331       $344       $358
            Protection                $51           $53          $55        $57        $60        $62        $65
         Transportation               $83           $86          $90        $93        $97       $101       $105
      General Government
      General Government              $23           $24          $25        $26        $27        $28        $29
         Other Spending              $976          $300         $312       $324       $337       $351       $365
         BAILOUT MONEY            ACCUM           $1,276       $1,588     $1,912     $2,250     $2,601     $2,966
  Interest on our National Debt      $168          $175         $182       $189       $197       $204       $213


Annual Government Spending          $3,938        $3,380       $3,516     $3,656     $3,803     $3,955     $4,113
                                   $2,186        $2,295       $2,410     $2,531     $2,657     $2,790     $2,929
2009 Fed. Tax Revenue
                                   $1,752        $1,085       $1,106     $1,126     $1,145     $1,165     $1,183
Annual Federal Deficit


                                  $12,704      $13,789     $14,895      $16,021    $17,166    $18,331    $19,514
Accumulated Federal Debt
                             2%   $14,291      $14,577     $14,868      $15,166    $15,469    $15,778    $16,094
GDP Growth


Federal Debt as %
                                     89%           95%         100%       106%       111%       116%       121%
of GDP
of GDP


                                             ©Bruce Kaufman

More Related Content

What's hot

Hexter Fair Economic Forecast 021909 Allen
Hexter Fair Economic Forecast 021909 AllenHexter Fair Economic Forecast 021909 Allen
Hexter Fair Economic Forecast 021909 AllenSheriStinson
 
H W 2010 Q1 De 12 Mo
H W 2010 Q1 De 12 MoH W 2010 Q1 De 12 Mo
H W 2010 Q1 De 12 Mochipwags
 
Chicago Real Estate Market Data - Broken Down by City
Chicago Real Estate Market Data - Broken Down by CityChicago Real Estate Market Data - Broken Down by City
Chicago Real Estate Market Data - Broken Down by Citybethrepta
 
Napco Better Result
Napco Better ResultNapco Better Result
Napco Better Resultpmoskie
 
Grendene - 2nd Annual Brazil Conference Itaú Securies
Grendene - 2nd Annual Brazil Conference Itaú SecuriesGrendene - 2nd Annual Brazil Conference Itaú Securies
Grendene - 2nd Annual Brazil Conference Itaú SecuriesGrendene
 
Commercial Market Monitor March 2011
Commercial Market Monitor March 2011Commercial Market Monitor March 2011
Commercial Market Monitor March 2011stacy_lau
 
Math in the News: 11/21/11
Math in the News: 11/21/11Math in the News: 11/21/11
Math in the News: 11/21/11Media4math
 
Chicagoland Quarterly Supply/Demand Report - 7/1/2011
Chicagoland Quarterly Supply/Demand Report - 7/1/2011Chicagoland Quarterly Supply/Demand Report - 7/1/2011
Chicagoland Quarterly Supply/Demand Report - 7/1/2011chipwags
 
Wag Report 2009 Q4 De 12 Mo
Wag Report 2009 Q4 De 12 MoWag Report 2009 Q4 De 12 Mo
Wag Report 2009 Q4 De 12 Mochipwags
 
omnicom group Q3 2006 Investor Presentation
omnicom group  Q3 2006 Investor Presentationomnicom group  Q3 2006 Investor Presentation
omnicom group Q3 2006 Investor Presentationfinance22
 
39348363 google-earnings-slides-q3-2010
39348363 google-earnings-slides-q3-201039348363 google-earnings-slides-q3-2010
39348363 google-earnings-slides-q3-2010Pranav Bhatnagar
 
J.S. Die & Mold - Operations Review 2006-12-21
J.S. Die & Mold - Operations Review 2006-12-21J.S. Die & Mold - Operations Review 2006-12-21
J.S. Die & Mold - Operations Review 2006-12-21Bob Sloma
 

What's hot (20)

Houston Market Report April 2010
Houston Market Report April 2010Houston Market Report April 2010
Houston Market Report April 2010
 
Hexter Fair Economic Forecast 021909 Allen
Hexter Fair Economic Forecast 021909 AllenHexter Fair Economic Forecast 021909 Allen
Hexter Fair Economic Forecast 021909 Allen
 
Houston Market Report February 2010
Houston Market Report February 2010Houston Market Report February 2010
Houston Market Report February 2010
 
H W 2010 Q1 De 12 Mo
H W 2010 Q1 De 12 MoH W 2010 Q1 De 12 Mo
H W 2010 Q1 De 12 Mo
 
Chicago Real Estate Market Data - Broken Down by City
Chicago Real Estate Market Data - Broken Down by CityChicago Real Estate Market Data - Broken Down by City
Chicago Real Estate Market Data - Broken Down by City
 
Napco Better Result
Napco Better ResultNapco Better Result
Napco Better Result
 
Grendene - 2nd Annual Brazil Conference Itaú Securies
Grendene - 2nd Annual Brazil Conference Itaú SecuriesGrendene - 2nd Annual Brazil Conference Itaú Securies
Grendene - 2nd Annual Brazil Conference Itaú Securies
 
Houston Market Report August 2010
Houston Market Report August 2010Houston Market Report August 2010
Houston Market Report August 2010
 
Ohl Apr Eng
Ohl Apr EngOhl Apr Eng
Ohl Apr Eng
 
Houston Market Report January 2010
Houston Market Report January 2010Houston Market Report January 2010
Houston Market Report January 2010
 
Commercial Market Monitor March 2011
Commercial Market Monitor March 2011Commercial Market Monitor March 2011
Commercial Market Monitor March 2011
 
Teacher Concessions
Teacher ConcessionsTeacher Concessions
Teacher Concessions
 
Math in the News: 11/21/11
Math in the News: 11/21/11Math in the News: 11/21/11
Math in the News: 11/21/11
 
Houston Market Report March 2010
Houston Market Report March 2010Houston Market Report March 2010
Houston Market Report March 2010
 
Chicagoland Quarterly Supply/Demand Report - 7/1/2011
Chicagoland Quarterly Supply/Demand Report - 7/1/2011Chicagoland Quarterly Supply/Demand Report - 7/1/2011
Chicagoland Quarterly Supply/Demand Report - 7/1/2011
 
Wag Report 2009 Q4 De 12 Mo
Wag Report 2009 Q4 De 12 MoWag Report 2009 Q4 De 12 Mo
Wag Report 2009 Q4 De 12 Mo
 
omnicom group Q3 2006 Investor Presentation
omnicom group  Q3 2006 Investor Presentationomnicom group  Q3 2006 Investor Presentation
omnicom group Q3 2006 Investor Presentation
 
Coldwell Banker C&C Properties Sales Dec 2010
Coldwell Banker C&C Properties Sales Dec 2010Coldwell Banker C&C Properties Sales Dec 2010
Coldwell Banker C&C Properties Sales Dec 2010
 
39348363 google-earnings-slides-q3-2010
39348363 google-earnings-slides-q3-201039348363 google-earnings-slides-q3-2010
39348363 google-earnings-slides-q3-2010
 
J.S. Die & Mold - Operations Review 2006-12-21
J.S. Die & Mold - Operations Review 2006-12-21J.S. Die & Mold - Operations Review 2006-12-21
J.S. Die & Mold - Operations Review 2006-12-21
 

Similar to Federal Finance Future

Naa Annual Newspaper Ad Expenditures 09
Naa Annual Newspaper Ad Expenditures 09Naa Annual Newspaper Ad Expenditures 09
Naa Annual Newspaper Ad Expenditures 09Juan Varela
 
2008 Annual Newspaper Ad Expenditures
2008 Annual Newspaper Ad Expenditures2008 Annual Newspaper Ad Expenditures
2008 Annual Newspaper Ad ExpendituresJuan Varela
 
Caída Publicidad EEUU 2009
Caída Publicidad EEUU 2009Caída Publicidad EEUU 2009
Caída Publicidad EEUU 2009Juan Varela
 
Cavit Financial Model(1)
Cavit Financial Model(1)Cavit Financial Model(1)
Cavit Financial Model(1)guest4e1120
 
Swifton - The Capital Network - Financial Projections
Swifton - The Capital Network - Financial ProjectionsSwifton - The Capital Network - Financial Projections
Swifton - The Capital Network - Financial ProjectionsDavid Fogel
 
Swifton CFOs - McCarter English - Fin Proj 100511
Swifton CFOs - McCarter English - Fin Proj 100511Swifton CFOs - McCarter English - Fin Proj 100511
Swifton CFOs - McCarter English - Fin Proj 100511David Fogel
 
2010 q3 google_earnings_slides
2010 q3 google_earnings_slides2010 q3 google_earnings_slides
2010 q3 google_earnings_slidesrabier
 
pitney bowes Monahan_2
pitney bowes  Monahan_2pitney bowes  Monahan_2
pitney bowes Monahan_2finance47
 
pitney bowes Monahan_2
pitney bowes  Monahan_2pitney bowes  Monahan_2
pitney bowes Monahan_2finance47
 
ecolab 2003AnnualReport
ecolab  2003AnnualReportecolab  2003AnnualReport
ecolab 2003AnnualReportfinance37
 
southwest airline ar97
southwest airline ar97southwest airline ar97
southwest airline ar97finance40
 
Budget Work Example
Budget Work ExampleBudget Work Example
Budget Work ExampleDavid Urbia
 
Swifton CFOs LLC - Boston BizSpark presentation - Financial Projections for I...
Swifton CFOs LLC - Boston BizSpark presentation - Financial Projections for I...Swifton CFOs LLC - Boston BizSpark presentation - Financial Projections for I...
Swifton CFOs LLC - Boston BizSpark presentation - Financial Projections for I...David Fogel
 
Asta data spots_howmanytravelagents&agenciesarethere_slideshow
Asta data spots_howmanytravelagents&agenciesarethere_slideshowAsta data spots_howmanytravelagents&agenciesarethere_slideshow
Asta data spots_howmanytravelagents&agenciesarethere_slideshowAmerican Society of Travel Agents
 

Similar to Federal Finance Future (20)

Naa Annual Newspaper Ad Expenditures 09
Naa Annual Newspaper Ad Expenditures 09Naa Annual Newspaper Ad Expenditures 09
Naa Annual Newspaper Ad Expenditures 09
 
Hhaf Defaultprob
Hhaf DefaultprobHhaf Defaultprob
Hhaf Defaultprob
 
Dcf
DcfDcf
Dcf
 
2008 Annual Newspaper Ad Expenditures
2008 Annual Newspaper Ad Expenditures2008 Annual Newspaper Ad Expenditures
2008 Annual Newspaper Ad Expenditures
 
Terminatorchart
TerminatorchartTerminatorchart
Terminatorchart
 
Caída Publicidad EEUU 2009
Caída Publicidad EEUU 2009Caída Publicidad EEUU 2009
Caída Publicidad EEUU 2009
 
2006Q4 google earnings
2006Q4 google earnings2006Q4 google earnings
2006Q4 google earnings
 
Houston Market Report May 2010
Houston Market Report May 2010Houston Market Report May 2010
Houston Market Report May 2010
 
Cavit Financial Model(1)
Cavit Financial Model(1)Cavit Financial Model(1)
Cavit Financial Model(1)
 
Swifton - The Capital Network - Financial Projections
Swifton - The Capital Network - Financial ProjectionsSwifton - The Capital Network - Financial Projections
Swifton - The Capital Network - Financial Projections
 
Swifton CFOs - McCarter English - Fin Proj 100511
Swifton CFOs - McCarter English - Fin Proj 100511Swifton CFOs - McCarter English - Fin Proj 100511
Swifton CFOs - McCarter English - Fin Proj 100511
 
2010 q3 google_earnings_slides
2010 q3 google_earnings_slides2010 q3 google_earnings_slides
2010 q3 google_earnings_slides
 
pitney bowes Monahan_2
pitney bowes  Monahan_2pitney bowes  Monahan_2
pitney bowes Monahan_2
 
pitney bowes Monahan_2
pitney bowes  Monahan_2pitney bowes  Monahan_2
pitney bowes Monahan_2
 
Google Earnings Slides 2009 Q2
Google Earnings Slides 2009 Q2Google Earnings Slides 2009 Q2
Google Earnings Slides 2009 Q2
 
ecolab 2003AnnualReport
ecolab  2003AnnualReportecolab  2003AnnualReport
ecolab 2003AnnualReport
 
southwest airline ar97
southwest airline ar97southwest airline ar97
southwest airline ar97
 
Budget Work Example
Budget Work ExampleBudget Work Example
Budget Work Example
 
Swifton CFOs LLC - Boston BizSpark presentation - Financial Projections for I...
Swifton CFOs LLC - Boston BizSpark presentation - Financial Projections for I...Swifton CFOs LLC - Boston BizSpark presentation - Financial Projections for I...
Swifton CFOs LLC - Boston BizSpark presentation - Financial Projections for I...
 
Asta data spots_howmanytravelagents&agenciesarethere_slideshow
Asta data spots_howmanytravelagents&agenciesarethere_slideshowAsta data spots_howmanytravelagents&agenciesarethere_slideshow
Asta data spots_howmanytravelagents&agenciesarethere_slideshow
 

Federal Finance Future

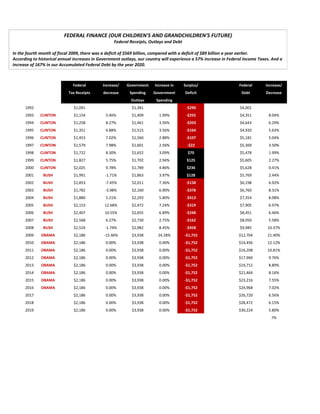
  • 1. FEDERAL FINANCE (OUR CHILDREN'S AND GRANDCHILDREN'S FUTURE) Federal Receipts, Outlays and Debt In the fourth month of fiscal 2009, there was a deficit of $569 billion, compared with a deficit of $89 billion a year earlier.  According to historical annual increases in Government outlays, our country will experience a 57% increase in Federal Income Taxes. And a  increase of 167% in our Accumulated Federal Debt by the year 2020. Federal Increase/ Government Increase in Surplus/ Federal Increase/ Tax Receipts decrease Spending Government Deficit Debt Decrease Outlays Spending 1992 $1,091 $1,381 ‐$290 $4,001 1993 CLINTON $1,154 5.46% $1,409 1.99% ‐$255 $4,351 8.04% 1994 CLINTON $1,258 8.27% $1,461 3.56% ‐$203 $4,643 6.29% 1995 CLINTON $1,351 6.88% $1,515 3.56% ‐$164 $4,920 5.63% 1996 CLINTON $1,453 7.02% $1,560 2.88% ‐$107 $5,181 5.04% 1997 CLINTON $1,579 $1 579 7.98% 7 98% $1,601 $1 601 2.56% 2 56% ‐$22 $5,369 $5 369 3.50% 3 50% 1998 CLINTON $1,722 8.30% $1,652 3.09% $70 $5,478 1.99% 1999 CLINTON $1,827 5.75% $1,702 2.94% $125 $5,605 2.27% 2000 CLINTON $2,025 9.78% $1,789 4.86% $236 $5,628 0.41% 2001 BUSH $1,991 ‐1.71% $1,863 3.97% $128 $5,769 2.44% 2002 BUSH $1,853 ‐7.45% $2,011 7.36% ‐$158 $6,198 6.92% 2003 BUSH $1,782 ‐3.98% $2,160 6.90% ‐$378 $6,760 8.31% 2004 BUSH $1,880 5.21% $2,293 5.80% ‐$413 $7,354 8.08% 2005 BUSH $2,153 12.68% $2,472 7.24% ‐$319 $7,905 6.97% 2006 BUSH $2,407 10.55% $2,655 6.89% ‐$248 $8,451 6.46% 2007 BUSH $2,568 6.27% $2,730 2.75% ‐$162 $8,950 5.58% 2008 BUSH $2,524 ‐1.74% $2,982 8.45% ‐$458 $9,985 10.37% 2009 OBAMA $2,186 ‐15.46% $3,938 24.28% ‐$1,752 $12,704 21.40% 2010 OBAMA $2,186 $2 186 0.00% 0 00% $3,938 $3 938 0.00% 0 00% ‐$1,752 $1 752 $14,456 $14 456 12.12% 12 12% 2011 OBAMA $2,186 0.00% $3,938 0.00% ‐$1,752 $16,208 10.81% 2012 OBAMA $2,186 0.00% $3,938 0.00% ‐$1,752 $17,960 9.76% 2013 OBAMA $2,186 0.00% $3,938 0.00% ‐$1,752 $19,712 8.89% 2014 OBAMA $2,186 0.00% $3,938 0.00% ‐$1,752 $21,464 8.16% 2015 OBAMA $2,186 0.00% $3,938 0.00% ‐$1,752 $23,216 7.55% 2016 OBAMA $2,186 0.00% $3,938 0.00% ‐$1,752 $24,968 7.02% 2017 OBAMA $2,186 0.00% $3,938 0.00% ‐$1,752 $26,720 6.56% 2018 OBAMA $2,186 0.00% $3,938 0.00% ‐$1,752 $28,472 6.15% 2019 OBAMA $2,186 0.00% $3,938 0.00% ‐$1,752 $30,224 5.80% 7%
  • 2. United States Federal, State and Local Government Spending Fiscal Year 2009 Fiscal Year 2009 GDP: $14,291.0 billion(1) GDP: $14,291.0 billion(1) Amounts in $ billion rate of tax increase 5% rate of increase (Gov. Spending) 4% YEAR Government Expense 2009 2010 2011 2012 2013 2014 2015 Social Security $712 $740 $770 $801 $833 $866 $901 Medicare $724 $753 $783 $814 $847 $881 $916 Education $99 $103 $107 $111 $116 $120 $125 Defense $819 $852 $886 $921 $958 $996 $1,036 Welfare $283 $294 $306 $318 $331 $344 $358 Protection $51 $53 $55 $57 $60 $62 $65 Transportation $83 $86 $90 $93 $97 $101 $105 General Government General Government $23 $24 $25 $26 $27 $28 $29 Other Spending $976 $300 $312 $324 $337 $351 $365 BAILOUT MONEY ACCUM $1,276 $1,588 $1,912 $2,250 $2,601 $2,966 Interest on our National Debt $168 $175 $182 $189 $197 $204 $213 Annual Government Spending $3,938 $3,380 $3,516 $3,656 $3,803 $3,955 $4,113 $2,186 $2,295 $2,410 $2,531 $2,657 $2,790 $2,929 2009 Fed. Tax Revenue $1,752 $1,085 $1,106 $1,126 $1,145 $1,165 $1,183 Annual Federal Deficit $12,704 $13,789 $14,895 $16,021 $17,166 $18,331 $19,514 Accumulated Federal Debt 2% $14,291 $14,577 $14,868 $15,166 $15,469 $15,778 $16,094 GDP Growth Federal Debt as % 89% 95% 100% 106% 111% 116% 121% of GDP of GDP ©Bruce Kaufman