

Recommended
More Related Content
Similar to Facebook stats
Similar to Facebook stats (14)
Recently uploaded
Recently uploaded (20)
Facebook stats
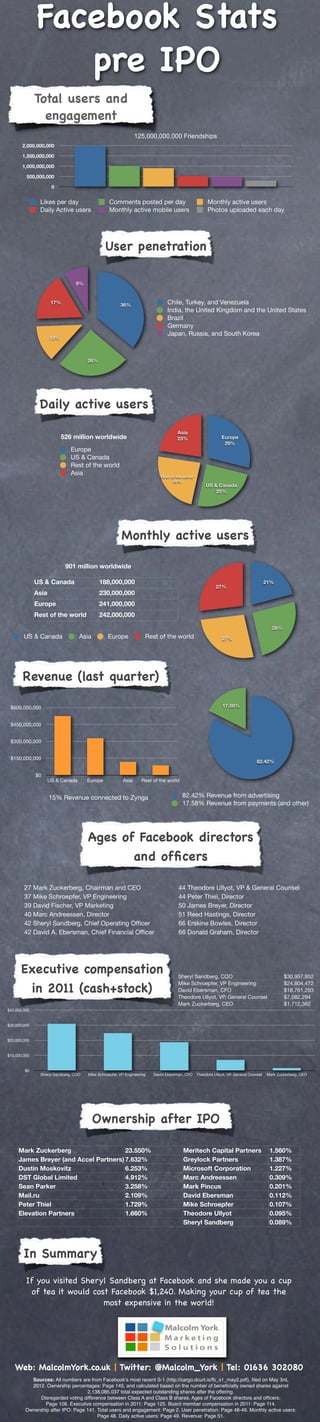
- 1. Facebook Stats pre IPO Total users and engagement 125,000,000,000 Friendships 2,000,000,000 1,500,000,000 1,000,000,000 500,000,000 0 Likes per day Comments posted per day Monthly active users Daily Active users Monthly active mobile users Photos uploaded each day User penetration 9% 17% 36% Chile, Turkey, and Venezuela India, the United Kingdom and the United States Brazil Germany Japan, Russia, and South Korea 13% 26% Daily active users Asia 526 million worldwide 23% Europe 29% Europe US & Canada Rest of the world Asia Rest of the world 24% US & Canada 25% Monthly active users 901 million worldwide US & Canada 188,000,000 21% 27% Asia 230,000,000 Europe 241,000,000 Rest of the world 242,000,000 26% US & Canada Asia Europe Rest of the world 27% Revenue (last quarter) $600,000,000 17.58% $450,000,000 $300,000,000 $150,000,000 82.42% $0 US & Canada Europe Asia Rest of the world 15% Revenue connected to Zynga 82.42% Revenue from advertising 17.58% Revenue from payments (and other) Ages of Facebook directors and officers 27 Mark Zuckerberg, Chairman and CEO 44 Theodore Ullyot, VP & General Counsel 37 Mike Schroepfer, VP Engineering 44 Peter Thiel, Director 39 David Fischer, VP Marketing 50 James Breyer, Director 40 Marc Andreessen, Director 51 Reed Hastings, Director 42 Sheryl Sandberg, Chief Operating Officer 66 Erskine Bowles, Director 42 David A. Ebersman, Chief Financial Officer 66 Donald Graham, Director Executive compensation Sheryl Sandberg, COO $30,957,952 in 2011 (cash+stock) Mike Schroepfer, VP Engineering $24,804,472 David Ebersman, CFO $18,761,293 Theodore Ullyot, VP, General Counsel $7,082,294 Mark Zuckerberg, CEO $1,712,362 $40,000,000 $30,000,000 $20,000,000 $10,000,000 $0 Sheryl Sandberg, COO Mike Schroepfer, VP Engineering David Ebersman, CFO Theodore Ullyot, VP, General Counsel Mark Zuckerberg, CEO Ownership after IPO Mark Zuckerberg 23.550% Meritech Capital Partners 1.560% James Breyer (and Accel Partners) 7.632% Greylock Partners 1.387% Dustin Moskovitz 6.253% Microsoft Corporation 1.227% DST Global Limited 4.912% Marc Andreessen 0.309% Sean Parker 3.258% Mark Pincus 0.201% Mail.ru 2.109% David Ebersman 0.112% Peter Thiel 1.729% Mike Schroepfer 0.107% Elevation Partners 1.660% Theodore Ullyot 0.095% Sheryl Sandberg 0.089% In Summary If you visited Sheryl Sandberg at Facebook and she made you a cup of tea it would cost Facebook $1,240. Making your cup of tea the most expensive in the world! Web: MalcolmYork.co.uk | Twitter: @Malcolm_York | Tel: 01636 302080 Sources: All numbers are from Facebook's most recent S-1 (http://cargo.dcurt.is/fb_s1_may2.pdf), filed on May 3rd, 2012. Ownership percentages: Page 145, and calculated based on the number of beneficially owned shares against 2,138,085,037 total expected outstanding shares after the offering. Disregarded voting difference between Class A and Class B shares. Ages of Facebook directors and officers: Page 108. Executive compensation in 2011: Page 125. Board member compensation in 2011: Page 114. Ownership after IPO: Page 141. Total users and engagement: Page 2. User penetration: Page 48-49. Monthly active users: Page 48. Daily active users: Page 49. Revenue: Page 51.
Editor's Notes
- \n