Download as PDF, PPTX
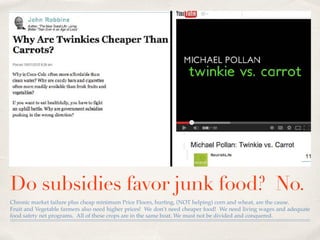
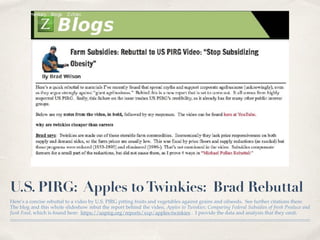
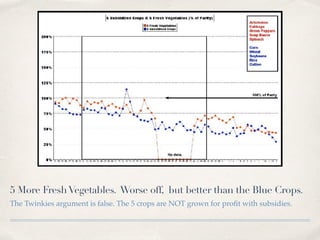
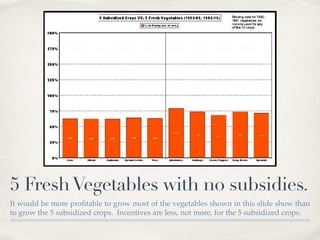
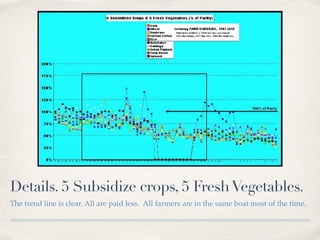
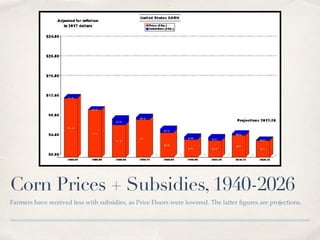
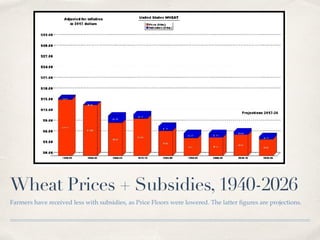
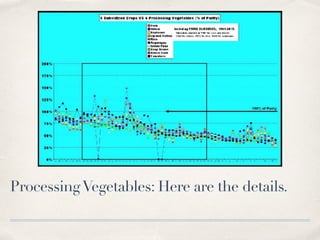
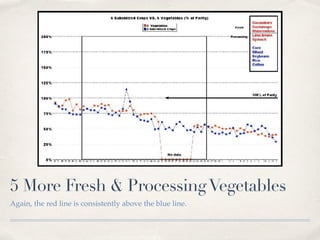
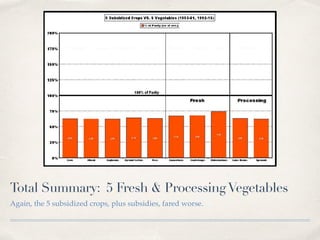
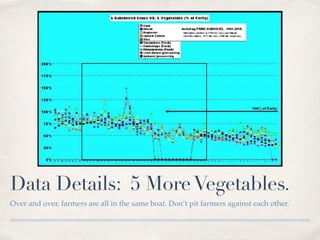
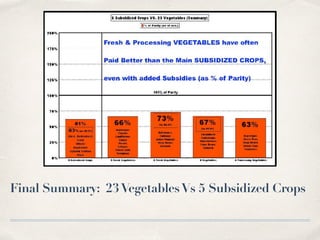
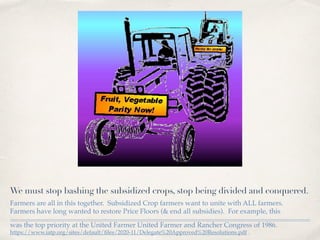

The document argues against the misconception that subsidies favor junk food over fruits and vegetables, asserting that both types of crops face chronic market failures and need better pricing and support. It refutes claims that fruit and vegetable farmers are neglected in subsidy programs, presenting evidence that they have historically fared better than subsidized grains despite the lack of dedicated subsidies. The document emphasizes the need for unity among farmers and advocates for restoring price floors to ensure fair wages rather than relying solely on subsidies.