Income statement 2015Cisco Systems, Inc.Income statement for peri.docx
•Download as DOCX, PDF•
0 likes•3 views
The document provides financial data for Cisco Systems for the year ending July 25, 2015. It includes income statements, balance sheets, and cash flow statements. The income statement shows total revenue of $49.16 billion, with a gross profit of $29.68 billion and net income of $8.98 billion. The balance sheet lists total assets of $113.48 billion, including current assets of $76.28 billion, and total liabilities of $53.78 billion. The cash flow statement indicates $12.55 billion in cash from operating activities and negative cash flows from investing and financing activities.
Report
Share
Report
Share
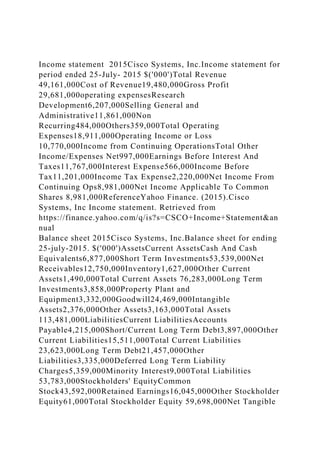
![Assets 32,853,000References Yahoo Finance. (2015).Cisco
Systems, Inc Balance sheet. Retrieved from
https://finance.yahoo.com/q/bs?s=CSCO+Balance+Sheet&annua
l
cashflow statement 2015Cisco Systems, Inc.Periodic 25-july-
2015 $('000')Net Income 8,981,000Operating Activities, Cash
Flows Provided By or Used
InDepreciation2,442,000Adjustments To Net
Income1,165,000(Changes In Accounts
Receivables)(1,047,000)Changes In
Liabilities1,497,000Changes In Inventories(116,000)Changes In
Other Operating Activities(370,000)Total Cash Flow From
Operating Activities 12,552,000Investing Activities, Cash
Flows Provided By or Used InCapital
Expenditures(1,227,000)Investments(8,379,000)Other Cash
flows from Investing Activities(482,000)Total Cash Flows From
Investing Activities (10,088,000)Financing Activities, Cash
Flows Provided By or Used InDividends Paid(4,086,000)Sale
Purchase of Stock(2,810,000)Net Borrowings4,469,000Other
Cash Flows from Financing Activities(14,000)Total Cash Flows
From Financing Activities (2,313,000)Effect Of Exchange Rate
Changes- Change In Cash and Cash Equivalents 151,000
ReferencesYahoo Finance. (2015).Cisco Systems, Inc Cash
flow. Retrieved from
https://finance.yahoo.com/q/cf?s=CSCO+Cash+Flow&annual
Stock pricesCisco Systems, Inc.Historical stock prices( 7
Days)DateAdj Close price17-Dec-1526.7216-Dec-1527.2415-
Dec-1526.8514-Dec-1526.4911-Dec-1526.1610-Dec-1526.779-
Dec-1526.73Rate of Return=[(Stock price of the last day- stock
price of the first day)/Stock price of the first day]*100Last Day
26.72First day26.73Change-0.01Rate of Return-
0.0374111485ReferencesYahoo Finance. (2015).Cisco Systems,
Inc historical prices. Retrieved from
https://finance.yahoo.com/q/hp?s=CSCO+Historical+Prices](data:image/gif;base64,R0lGODlhAQABAIAAAAAAAP///yH5BAEAAAAALAAAAAABAAEAAAIBRAA7)
Recommended
Recommended
More Related Content
Similar to Income statement 2015Cisco Systems, Inc.Income statement for peri.docx
Similar to Income statement 2015Cisco Systems, Inc.Income statement for peri.docx (14)
ACCOUNTING PROGRAM OVERVIEW: SEC 10K REPORT PROJECT FOR ACCT 321
ACCOUNTING PROGRAM OVERVIEW: SEC 10K REPORT PROJECT FOR ACCT 321
CC 322 FINAL PROJECT TWO: NONPROFIT ACCOUNTING GUIDELINES AND RUBRIC OVERVIEW
CC 322 FINAL PROJECT TWO: NONPROFIT ACCOUNTING GUIDELINES AND RUBRIC OVERVIEW
COVENTRY UNIVERSTYFaculty of Business Environment and Society.docx
COVENTRY UNIVERSTYFaculty of Business Environment and Society.docx
Originally developed for WRIT 300 – Advanced Expository Wri.docx
Originally developed for WRIT 300 – Advanced Expository Wri.docx
WELCOMEFinancial Projections ModelFor Business PlansFran.docx
WELCOMEFinancial Projections ModelFor Business PlansFran.docx
WELCOMEFinancial Projections ModelFor Business PlansFran.docx
WELCOMEFinancial Projections ModelFor Business PlansFran.docx
More from bradburgess22840
More from bradburgess22840 (20)
Develop a detailed outline for the data collection plan to include .docx
Develop a detailed outline for the data collection plan to include .docx
Develop a 3–4 page research paper based on a selected case study rel.docx
Develop a 3–4 page research paper based on a selected case study rel.docx
Develop a 5- to 6-slide PowerPoint presentation for a staff meet.docx
Develop a 5- to 6-slide PowerPoint presentation for a staff meet.docx
Develop a 5–10-year strategic plan for achieving specific health.docx
Develop a 5–10-year strategic plan for achieving specific health.docx
Develop a 2–4-page proposal for a policy that should help to imp.docx
Develop a 2–4-page proposal for a policy that should help to imp.docx
Develop a 10- to 12- slide PowerPoint Presentation designed for .docx
Develop a 10- to 12- slide PowerPoint Presentation designed for .docx
DetailsPlease answer the following questions. 1. Desc.docx
DetailsPlease answer the following questions. 1. Desc.docx
Despite the literature supporting technology use in schools as ben.docx
Despite the literature supporting technology use in schools as ben.docx
Details httpsource.sakaiproject.orgviewsvnview=rev&rev=39.docx
Details httpsource.sakaiproject.orgviewsvnview=rev&rev=39.docx
DescriptionCh .17Newborn transitioningCh. 18Nursing manag.docx
DescriptionCh .17Newborn transitioningCh. 18Nursing manag.docx
Description of the assignment The following 4 men created a p.docx
Description of the assignment The following 4 men created a p.docx
Description of the AssignmentThis assignment presents a mo.docx
Description of the AssignmentThis assignment presents a mo.docx
Description of theNationalMilitary Strategy2018.docx
Description of theNationalMilitary Strategy2018.docx
Description This is a 4 page paper about either a creative genius o.docx
Description This is a 4 page paper about either a creative genius o.docx
Describe your experience with electronic healthmedical record.docx
Describe your experience with electronic healthmedical record.docx
Description Develop a paper describing how the knowledge, skill.docx
Description Develop a paper describing how the knowledge, skill.docx
Describing Research FindingsResearchers take many steps to p.docx
Describing Research FindingsResearchers take many steps to p.docx
Description I. Introduction A. Summarize the client. What is the rat.docx
Description I. Introduction A. Summarize the client. What is the rat.docx
Describing DataNumerical MeasuresChapter 3McGraw-.docx
Describing DataNumerical MeasuresChapter 3McGraw-.docx
Describes the use of Computers in Nursing in general clearly and com.docx
Describes the use of Computers in Nursing in general clearly and com.docx
Recently uploaded
https://app.box.com/s/x7vf0j7xaxl2hlczxm3ny497y4yto33i80 ĐỀ THI THỬ TUYỂN SINH TIẾNG ANH VÀO 10 SỞ GD – ĐT THÀNH PHỐ HỒ CHÍ MINH NĂ...
80 ĐỀ THI THỬ TUYỂN SINH TIẾNG ANH VÀO 10 SỞ GD – ĐT THÀNH PHỐ HỒ CHÍ MINH NĂ...Nguyen Thanh Tu Collection
Recently uploaded (20)
This PowerPoint helps students to consider the concept of infinity.
This PowerPoint helps students to consider the concept of infinity.
General Principles of Intellectual Property: Concepts of Intellectual Proper...
General Principles of Intellectual Property: Concepts of Intellectual Proper...
80 ĐỀ THI THỬ TUYỂN SINH TIẾNG ANH VÀO 10 SỞ GD – ĐT THÀNH PHỐ HỒ CHÍ MINH NĂ...
80 ĐỀ THI THỬ TUYỂN SINH TIẾNG ANH VÀO 10 SỞ GD – ĐT THÀNH PHỐ HỒ CHÍ MINH NĂ...
Fostering Friendships - Enhancing Social Bonds in the Classroom
Fostering Friendships - Enhancing Social Bonds in the Classroom
On National Teacher Day, meet the 2024-25 Kenan Fellows
On National Teacher Day, meet the 2024-25 Kenan Fellows
Sensory_Experience_and_Emotional_Resonance_in_Gabriel_Okaras_The_Piano_and_Th...
Sensory_Experience_and_Emotional_Resonance_in_Gabriel_Okaras_The_Piano_and_Th...
ICT role in 21st century education and it's challenges.
ICT role in 21st century education and it's challenges.
ICT Role in 21st Century Education & its Challenges.pptx
ICT Role in 21st Century Education & its Challenges.pptx
Exploring_the_Narrative_Style_of_Amitav_Ghoshs_Gun_Island.pptx
Exploring_the_Narrative_Style_of_Amitav_Ghoshs_Gun_Island.pptx
Beyond_Borders_Understanding_Anime_and_Manga_Fandom_A_Comprehensive_Audience_...
Beyond_Borders_Understanding_Anime_and_Manga_Fandom_A_Comprehensive_Audience_...
Income statement 2015Cisco Systems, Inc.Income statement for peri.docx
- 1. Income statement 2015Cisco Systems, Inc.Income statement for period ended 25-July- 2015 $('000')Total Revenue 49,161,000Cost of Revenue19,480,000Gross Profit 29,681,000operating expensesResearch Development6,207,000Selling General and Administrative11,861,000Non Recurring484,000Others359,000Total Operating Expenses18,911,000Operating Income or Loss 10,770,000Income from Continuing OperationsTotal Other Income/Expenses Net997,000Earnings Before Interest And Taxes11,767,000Interest Expense566,000Income Before Tax11,201,000Income Tax Expense2,220,000Net Income From Continuing Ops8,981,000Net Income Applicable To Common Shares 8,981,000ReferenceYahoo Finance. (2015).Cisco Systems, Inc Income statement. Retrieved from https://finance.yahoo.com/q/is?s=CSCO+Income+Statement&an nual Balance sheet 2015Cisco Systems, Inc.Balance sheet for ending 25-july-2015. $('000')AssetsCurrent AssetsCash And Cash Equivalents6,877,000Short Term Investments53,539,000Net Receivables12,750,000Inventory1,627,000Other Current Assets1,490,000Total Current Assets 76,283,000Long Term Investments3,858,000Property Plant and Equipment3,332,000Goodwill24,469,000Intangible Assets2,376,000Other Assets3,163,000Total Assets 113,481,000LiabilitiesCurrent LiabilitiesAccounts Payable4,215,000Short/Current Long Term Debt3,897,000Other Current Liabilities15,511,000Total Current Liabilities 23,623,000Long Term Debt21,457,000Other Liabilities3,335,000Deferred Long Term Liability Charges5,359,000Minority Interest9,000Total Liabilities 53,783,000Stockholders' EquityCommon Stock43,592,000Retained Earnings16,045,000Other Stockholder Equity61,000Total Stockholder Equity 59,698,000Net Tangible
- 2. Assets 32,853,000References Yahoo Finance. (2015).Cisco Systems, Inc Balance sheet. Retrieved from https://finance.yahoo.com/q/bs?s=CSCO+Balance+Sheet&annua l cashflow statement 2015Cisco Systems, Inc.Periodic 25-july- 2015 $('000')Net Income 8,981,000Operating Activities, Cash Flows Provided By or Used InDepreciation2,442,000Adjustments To Net Income1,165,000(Changes In Accounts Receivables)(1,047,000)Changes In Liabilities1,497,000Changes In Inventories(116,000)Changes In Other Operating Activities(370,000)Total Cash Flow From Operating Activities 12,552,000Investing Activities, Cash Flows Provided By or Used InCapital Expenditures(1,227,000)Investments(8,379,000)Other Cash flows from Investing Activities(482,000)Total Cash Flows From Investing Activities (10,088,000)Financing Activities, Cash Flows Provided By or Used InDividends Paid(4,086,000)Sale Purchase of Stock(2,810,000)Net Borrowings4,469,000Other Cash Flows from Financing Activities(14,000)Total Cash Flows From Financing Activities (2,313,000)Effect Of Exchange Rate Changes- Change In Cash and Cash Equivalents 151,000 ReferencesYahoo Finance. (2015).Cisco Systems, Inc Cash flow. Retrieved from https://finance.yahoo.com/q/cf?s=CSCO+Cash+Flow&annual Stock pricesCisco Systems, Inc.Historical stock prices( 7 Days)DateAdj Close price17-Dec-1526.7216-Dec-1527.2415- Dec-1526.8514-Dec-1526.4911-Dec-1526.1610-Dec-1526.779- Dec-1526.73Rate of Return=[(Stock price of the last day- stock price of the first day)/Stock price of the first day]*100Last Day 26.72First day26.73Change-0.01Rate of Return- 0.0374111485ReferencesYahoo Finance. (2015).Cisco Systems, Inc historical prices. Retrieved from https://finance.yahoo.com/q/hp?s=CSCO+Historical+Prices
- 3. FINANCE Excel Assignment 2 Rubric This assignment builds on the work you did for the Excel assignment in Module Three. To get started, find and open the file you submitted. From there, complete the following steps: Financial Data Using the same company you selected in Module Three, add another two years of financial statement data so that you have three years of annual data to review for historical analysis. In all, your Excel file must include the following: o Three worksheets of annual balance sheet data o Three worksheets of annual income statement data o Three worksheets of annual statement of cash flow data Important Note: Be sure to label each worksheet in Excel with the appropriate year, as you did in the Module Three assignment. Ratio Calculation On each data tab, use formulas to calculate the following financial indicators for each year of data: · Current ratio o Debt/equity ratio o Free cash flow o Earnings per share o Price/earnings ratio o Return on equity · Net profit margin Written Responses Using the Write Submission area of Blackboard for this part of the assignment, respond to the following: · Describe how and why each of the ratios has changed over the three-year period. For example, did the current ratio increase or decrease? Why? · Describe how three of the ratios you calculated for your company compare to the general industry. Find general industry
- 4. data by entering your specific company’s ticker symbol here. If you are not familiar with the Write Submission feature, see the screen shot below. Professionalism, References, and Mechanics Format the data on all worksheets so that the file has a neat and professional appearance. Include links and properly formatted citations referencing the location of the data used. Your written responses should be free of errors in organization, grammar, and style. Guidelines for Submission: Submit an Excel file that meets the criteria described in the prompt. The written responses should be done in the Write Submission area of Blackboard. Citations should be formatted according to APA style. Critical Elements Exemplary (100%) Proficient (85%) Needs Improvement (55%) Not Evident(0%) Value Financial Data Meets “Proficient” criteria and presents information in a wellorganized manner with clearly labeled tabs and data sections Includes three years of financial statement data (three annual balance sheets, three annual income statements, and three annual statements of cash flows) for the company selected, with minor errors or no errors Includes three years of financial statement data (three annual balance sheets, three annual income statements, and three annual statements of cash flows) for the company selected, with noticeable errors
- 5. Does not include three years of financial statement data (three annual balance sheets, three annual income statements, and three annual statements of cash flows) for the company selected 20 Ratio Calculation Meets “Proficient” criteria and presents information in a clear and well-organized manner Accurately calculates the financial indicators (current ratio, debt/equity ratio, free cash flow, earnings per share, price/earnings ratio, return on equity, and net profit margin), with minor errors or no errors Calculates the financial indicators (current ratio, debt/equity ratio, free cash flow, earnings per share, price/earnings ratio, return on equity, and net profit margin), with noticeable errors Does not calculate the financial indicators (current ratio, debt/equity ratio, free cash flow, earnings per share, price/earnings ratio, return on equity, and net profit margin) 40 Written Responses: Changes in Ratios Meets “Proficient” criteria and includes supporting details and data Describes how and why each of the ratios has changed over the three-year period in a clear and logical manner Describes how and why each of the ratios has changed over the three-year period but presents some information in an unclear or illogical manner Does not describe how and why each of the ratios has changed over the three-year period 15 Written Responses: Comparison to Industry Meets “Proficient” criteria and includes supporting details and data Describes how the selected ratios compare to the general industry in a clear and logical manner Describes how the selected ratios compare to the general industry but presents some information in an unclear or illogical
- 6. manner Does not describe how the selected ratios compare to the general industry 15 Professionalism, References, and Mechanics Meets “Proficient” criteria, and the material is presented in an especially polished and easy to read format Formats data with a neat and professional appearance and includes properly formatted APA-style citations and links with minor errors or no errors; any errors related to organization, grammar, and style are minor Formats data and provides citations and links, but there are deficiencies in the appearance of the data and/or flaws in the citation formatting; there are some errors related to organization, grammar, and style Does not format data with a neat and professional appearance or include properly formatted APAstyle citations and links; there are major errors related to organization, grammar, and style 10 Earned Total 100%