SlideShare a Scribd company logo
1 of 192
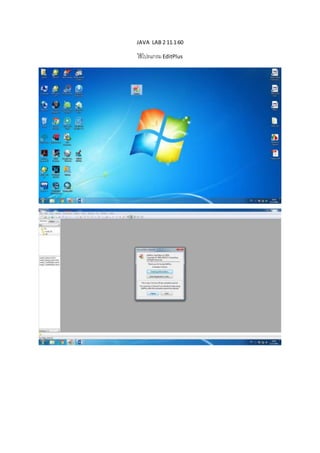
JAVA LAB 2 11-1-60
ใช้โปรแกรม EditPlus
document.write("สวัสดีชาว GI ทุกท่าน");
Encoding เป็น UTF-8
การใช้ +เชื่อม ประโยค
แจ้งการอัพเดท โดยใช้ document.lastModified
document.write("สวัสดีชาว GI ทุกท่าน"+document.lastModified);
การใช้ window.alert
เซ็ตค่าให้เป็นภาษาไทย ตอนแสดงผล <meta charset = "TIS-620">
การใช้ window.confirm
การใช้ window.prompt
การใช้ functiontest()
JAVA SCRIPT LAB2
18/01/60
การถามอายุAge
การทาให้ชื่อปุ่มปรากฏ
ใช้ Send data
เทียบอายุ
ใช้
functiondemo()
{
if(test.age.value>50)
{
alert("Youare Old!!!");
}
else
{
alert("Youare Young(*_*)");
}
}
demo()
ใส่ค่าน้อยกว่าหรือเท่าก่บ50
ใส่ค่ามากกว่า50
แก้ปัญหาการไม่ใส่ค่าแต่ขึ้นกล่อง alert
if(test.age.value=='')
{
alert("Please insertYouage");
}
การทาเกรด
<html>
<head>
</head>
<body>
<script>
var score = prompt("Please insertyourscore")
if((score >=80)&&(score <= 100))
{
alert("Youhave Grade A")
}
else if ((score >=75)&&(score <= 79))
{
alert("Youhave Grade B+")
}
else if ((score >=70)&&(score <= 74))
{
alert("Youhave Grade B")
}
else if ((score >=65)&&(score <= 69))
{
alert("Youhave Grade C+")
}
else if ((score >=60)&&(score <= 64))
{
alert("Youhave Grade C")
}
else if ((score >=55)&&(score <= 59))
{
alert("Youhave Grade D+")
}
else if ((score >=50)&&(score <= 54))
{
alert("Youhave Grade D")
}
else
{
alert("Youhave Grade F")
}
</script>
</body>
</html>
80 = A
101 = F
แก้ไข
if(score >= 80)
JAVA SCRIPT LAB4
25/01/60
Simple Map
TRY IT YOURSELF
<!DOCTYPE html>
<html>
<head>
<title>Simple Map</title>
<meta name="viewport" content="initial-scale=1.0">
<meta charset="utf-8">
<style>
/* Always set the map height explicitly to define the size of the
div
* element that contains the map. */
#map {
height: 100%;
}
/* Optional: Makes the sample page fill the window. */
html, body {
height: 100%;
margin: 0;
padding: 0;
}
</style>
</head>
<body>
<div id="map"></div>
<script>
var map;
function initMap() {
map = new google.maps.Map(document.getElementById('map'), {
center: {lat: -34.397, lng: 150.644},
zoom: 8
});
}
</script>
<script
src="https://maps.googleapis.com/maps/api/js?key= YOUR_API_KEY &callback
=initMap"
async defer></script>
</body>
</html>
ลบ สีฟ้า ใส่ API
ใส่ API
ภูมิประเทศ
ดาวเทียม
ไปไทย
ใส่ ละติจูด ลองจิจูด ของสถานที่
ระบุค่า พิกัด
lat: 13.2777643, lng: 100.925731
Zoom in
ลด เปอเซน ปรับแก้ขนาด แผนที่
height: 50%;
height: 50%;
margin: 15;
padding: 20;
ลบ <div id="map"></div>
JAVA SCRIPT LAB5
01/02/60
วาง api
ใส่ค่าพิกัดที่ต้องการ
lat: 13.277383, lng: 100.925864
zoom
ลบ var map;
ใส่ var
ใส่หมุด
var marker= newgoogle.maps.Marker({
position:{lat:13.277383,lng:100.925864},
map : map,
title :'Faculty of Geoinformatics'
});
ใส่หมุด 2
var marker2 = newgoogle.maps.Marker({
position:{lat:13.296552, lng:100.913317},
map : map,
title :'SeansukTemple'
});
เปลี่ยนรูปแบบหมุด
<!DOCTYPE html>
<html>
<head>
<title>CustomMarkers</title>
<meta name="viewport"content="width=device-width,initial-scale=1.0,user-scalable=no">
<meta charset="utf-8">
<style>
/* Alwayssetthe mapheightexplicitlytodefinethe size of the div
* elementthatcontainsthe map.*/
#map {
height:100%;
}
/* Optional:Makesthe sample page fill the window.*/
html,body{
height:100%;
margin:0;
padding:0;
}
</style>
</head>
<body>
<divid="map"></div>
<script>
var map;
functioninitMap() {
map = newgoogle.maps.Map(document.getElementById('map'),{
zoom:16,
center:{lat:13.277605,lng:100.926524},
mapTypeId:'roadmap'
});
var iconBase = 'https://maps.google.com/mapfiles/kml/shapes/';
var icons= {
parking:{
icon:iconBase + 'parking_lot_maps.png'
},
library:{
icon:iconBase + 'library_maps.png'
},
info:{
icon:iconBase + 'info-i_maps.png'
}
};
functionaddMarker(feature){
var marker= new google.maps.Marker({
position:feature.position,
icon:icons[feature.type].icon,
map: map
});
}
var features= [
{
position:{lat:13.288134,lng:100.912272},
type:'info'
}, {
position:{lat:13.276648,lng:100.924912},
type:'parking'
}, {
position:{lat:13.279320,lng:100.924994},
type:'library'
}
];
for (vari = 0, feature;feature =features[i];i++) {
addMarker(feature);
}
}
</script>
<script
src="https://maps.googleapis.com/maps/api/js?key=AIzaSyBsF92R_TGBBGjc9rdR5In78A5fjXZVWuE&
callback=initMap"
async defer></script>
</body>
</html>
JAVA SCRIPT LAB6
08/02/60
สร้างไฟล์ KML
คลิกที่ โพลิกอน
มาที่ Edit +
<!DOCTYPE html>
<html>
<head>
<meta name="viewport" content="initial-scale=1.0">
<meta charset="utf-8">
<title>KML feature details</title>
<style>
html, body {
height:100%;
margin: 0;
padding: 0;
}
#map {
float: left;
height:100%;
width: 79%;
}
#content-window{
float: left;
font-family:'Roboto','sans-serif';
height:100%;
line-height:30px;
padding-left:10px;
width: 19%;
}
</style>
</head>
<body>
<div id="map"></div>
<div id="content-window"></div>
<script>
functioninitMap() {
var map = newgoogle.maps.Map(document.getElementById('map'),{
zoom: 12,
center:{lat: 13.277605, lng: 100.926524}
});
var kmlLayer = new google.maps.KmlLayer({
url: 'https://sites.google.com/site/notps015858170118/googlemap/HAll.kml?attredirects=0&d=1',
suppressInfoWindows:true,
map: map
});
kmlLayer.addListener('click',function(kmlEvent) {
var text= kmlEvent.featureData.description;
showInContentWindow(text);
});
functionshowInContentWindow(text) {
var sidediv= document.getElementById('content-window');
sidediv.innerHTML= text;
}
}
</script>
<script async defer
src="https://maps.googleapis.com/maps/api/js?key=AIzaSyCNFXauWf_NpL6zhFlYlo6ft8329k6YW
cU&callback=initMap">
</script>
</script>
</body>
</html>
คลิกที่ โพลิกอน
นาโคด kml มาวาง
https://sites.google.com/site/notps015858170118/googlemap/HAll.kml?attredirects=0&d=1
JAVA SCRIPT LAB7
15/02/60
<style>
#map{
float: left;
height:100%;
width: 100%;
}
html,body{
height:100%;
margin: 0;
padding:0;
}
</style>
<divid="map"></div>
<script>
functioninitMap(){
var map = newgoogle.maps.Map(document.getElementById('map'),{
center: {lat:24.886, lng: -70.268},
zoom: 5,
mapTypId: 'terrain'
})
}
</script>
<script
src="https://maps.googleapis.com/maps/api/js?key=AIzaSyBsF92R_TGBBGjc9rdR5In78A5fjXZVWuE
&callback=initMap"
async defer></script>
var triangleCoords=[
{lat:25.774, lng:-80.190},
{lat:18.466, lng:-66.118},
{lat:32.321, lng:-64.757},
{lat:25.774, lng:-80.190}
];
var bermuda= newgoogle.maps.Polygon({
paths: triangleCoords,
strokeColor:'#000000',
strokeOpacity:0.5,
strokeWeight:3,
fillColor:'#FF0101',
fillOpacity:0.8
});
bermuda.setMap(map);
JAVA SCRIPT LAB 8
22/02/60
ScriptPYTHON 08/03/2560
หารากที่2
ประโยค
จะใช้ฟังก์ชันที่อยู่ใน arcpy ทั้งหมด
ศ
arcpy.Buffer_analysis("D:/BUU/BUU.shp","D:/BUU/Buff_BUU.shp","300
meters","OUTSIDE_ONLY","","ALL")
Script15/03/60 (PYTHON 2)
ประกาศเงื่อนไข
เปลี่ยนให้else ติดขอบ
เปลี่ยน
สร้างโปรแกรมให้รับค่าจากคีย์บอด
Script 22/03/60 week11
ข้อมูลขอบเขตประเทศ
ที่เก็บข้อมูล
ตั้งชื่อใหม่
ทาการเปลี่ยนสีที่polygon
ทาการเปลี่ยนสีให้ world_boundaries
ดับเบิ้ลคลิกที่world_boundaries เพื่อเข้าไปเปลี่ยนสีอีกที
ไปคลิกในช่อง python กดเลื่อนขึ้นแล้วเปลี่ยนworld1เป็นworld2จะเปลี่ยนสีจากสีเดียวเป็นหลายสี
http://asmc.asean.org/asmc-hotspot#Hotspot
ดูจุดความร้อน
เปลี่ยนวันที่เพื่อดูความร้อน
Download
ทาการสปิทข้อมูล
ลบเพื่อไม่ให้ข้อมูลซ้าซ้อนกัน
ต้องปิด excel ก่อนถึงจะเอาข้อมูลเข้าArcmapได้
r = read แล้วใส่ที่เก็บข้อมูล
Lat Long ตั้งตามในExcel
ตั้งชื่อใหม่ Hospot
จะได้ข้อมูลจุดความร้อนจากExcel มา
29/03/60 week12
Coppy จากตารางข้างบนมา
ใส่ค่าพิกัดเอาจากgoogleearth
ปิดโปรแกรมexcel
ภาพปริมาณน้าฝนของสภานี
Script05/04/60 week13
DownloadLandsat5
ทาการแตกไฟล์
Band3
Band4
Band5
Copylinkurl มาใส่
NDVI week14 19/04/60
บรรทัดต่อไปคือ การกาหนดโฟเดอร์ปลายทาง(ไปตรวจดูว่ามีโฟเดอร์ Landsat5หรือยัง)
เช็คระบบค่าพิกัด
ถ้าผลลัพธ์ออกมาให้เก็บในชื่อนี้NDVI01นามสกุลเป็น.tif
เปิดไฟล์ภาพ
ใส่สูตรหาค่าNDVI (สูตรแรก)NIR– RED (Num1เก็บค่าผลลัพธ์เป็นค่าลบ)
Num2 เก็บค่าผลลัพธ์เป็นค่าบวก
เอาทั้งสองค่ามาหารกันโดยใช้คาสั่งDivide
saveผลลัพธ์ให้อยู่ในตัวแปลresultในNDVI01.TIF
จากนั้นทาการsave ว่าNDVI ใช้นามสกุล.py
ผลลัพธ์ของNum1– Num2 ที่นาเข้ามาในArcmap
Week15 19/04/60
เปิดโปรแกรมArcmap
ไปที่ Catalogเลือกกล่องเครื่องมือToolboxes คลิกขวาที่MyToolboxes เลือกNew และเลือกToolbox
จะได้กล่องเครื่องมือมาให้ตั้งชื่อว่า 01_58
คลิกขวาที่01_58 เลือกAddและเลือกscript
จะมีหน้าต่างขึ้นมาตามรูปข้างบน
ช่อง Name ให้ตั้งชื่อว่าNDVI และช่อง Labal ให้ตั้งเป็นชื่อเดียวกับช่องName จากนั้นช่อง Description ให้พิมว่าThis
isNDVIGeoprocessingforLandsat5และกดNext
จากนั้นหาไฟล์NDVI.py
กด Next
ในช่อง DisplayName ให้พิมพ์ว่าInputRASTERจากนั้นช่องData Type ให้เลือกเป็น RasterLayer
ช่อง ParameterProperties ตรงType ในช่อง Value ให้เลือกเป็นRequired
Javascript & Python
Javascript & Python
Javascript & Python
Javascript & Python
Javascript & Python
Javascript & Python
Javascript & Python
Javascript & Python

Javascript & Python