This document summarizes a working paper that develops a new tax measure called the Tax Attractiveness Index. The index is intended to provide a more comprehensive picture of a country's tax environment compared to existing measures like statutory tax rates. It incorporates 16 different tax factors related to corporate taxation, such as the statutory tax rate, taxation of dividends/capital gains, withholding taxes, group taxation rules, tax treaties, and more. Methods are described for quantifying each factor on a scale of 0 to 1, with higher numbers indicating more favorable tax conditions. The index is calculated for 100 countries from 2005 to 2009. The paper aims to use this new measure to better understand differences in tax attractiveness across countries and regions over time

![20
bourg, for example, a special holding regime was applied until 2010 that exempted holding
companies from current taxation if certain requirements were met. Hence, the statutory tax
rate for holding companies was zero. Similar rules exist in Lichtenstein. In Switzerland, hold-
ing companies are not subject to corporate income tax at the cantonal and communal level
which lowers the statutory tax rate to approximately 7-8%. The Maltese income tax system
contains a holding regime under which non-resident shareholders may claim a full refund of
the tax paid by the company in Malta in case the related profits are distributed subsequently.
In this way, the Maltese tax burden can be lowered heavily. Also Singapore operates a special
holding regime. A company which qualifies as an approved holding is exempt from tax on all
disposals of shares in subsidiaries. Although Singapore does not levy taxes on capital gains,
gains on disposals of shares may be subject to corporate income tax if they are classified as
income in nature. To provide greater certainty on the treatment of capital gains, approved
holding companies can receive capital gains free of tax.
When evaluating a country’s tax treatment of holding companies, we only take rules
into account that have not been covered by one of the other tax factors included in the Tax
Attractiveness Index. We differentiate between countries that offer a special holding regime
(HOLD=1) and those who do not (HOLD=0).
3.2 Construction of the Tax Attractiveness Index
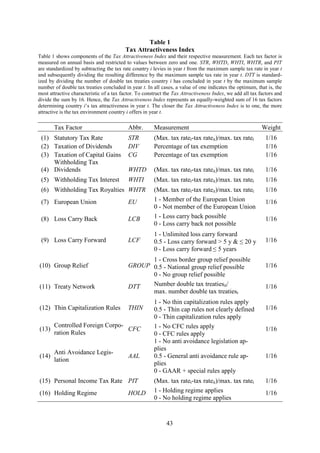
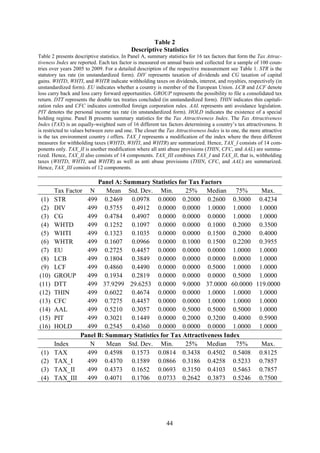
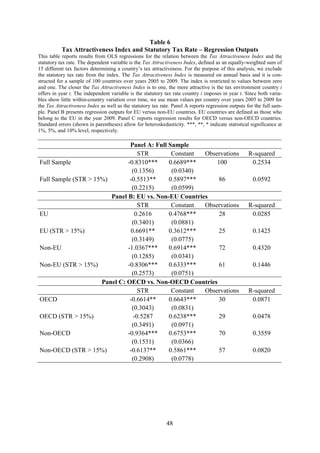
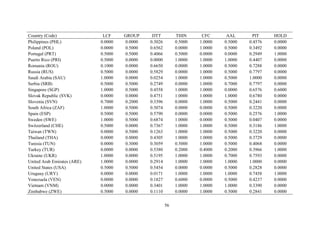
In a next step, we use all 16 tax factors that have been identified as determining a
country’s tax environment to construct the Tax Attractiveness Index. Table 1 summarizes all
index components and their respective measurement.
[Insert Table 1 about here]
For the purpose of the index, all tax factors have to be constrained to values between
zero and one. In cases we had to develop quantification schemes, the measurement of the re-
spective tax factors has already been adjusted to this scale. However, the statutory tax rate, the
three different measures for withholding taxes, the double tax treaty network and the personal
income tax rate are not yet restricted to values between zero and one. The statutory tax rate,
the withholding taxes and the personal income tax rate are standardized by subtracting the tax
rate country i levies in year t from the maximum sample tax rate in year t and subsequently
dividing the resulting difference by the maximum sample tax rate in year t (see Table 1).
Thus, the lower the tax rate country i imposes, the more the fraction approaches one, indicat-](https://image.slidesharecdn.com/estudo-econstor-130715121557-phpapp02/85/Estudo-econstor-23-320.jpg)
![21
ing an attractive characteristic of country i’s tax environment. The double tax treaty network
is standardized by dividing the number of double tax treaties country i has concluded in year t
by the maximum sample number of double tax treaties concluded in year t. Hence, the more
double tax treaties country i has signed, the more the fraction converges to one, indicating a
favorable tax feature.
To construct the Tax Attractiveness Index, we add values for all 16 tax factors per
country and divide the sum by 16. Hence, the index represents an equally-weighted sum of 16
tax factors. It indicates the attractiveness of a country’s tax environment and the tax planning
opportunities that are offered. Analogical to its components, the Tax Attractiveness Index is
measured on an annual basis and restricted to values between zero and one. The more the in-
dex values approaches one, the more attractive is the tax environment of a certain country.
4 Descriptive Statistics
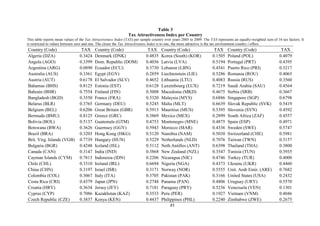
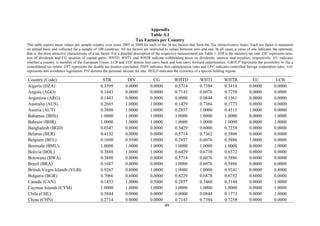
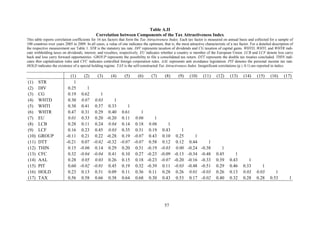
Panel A of Table 2 reports descriptive statistics for the 16 tax factors collected for a
sample of 100 countries over years 2005 to 2009. However, tax data for Belarus in year 2005
are not available. Hence, the number of observations amounts to 499.
[Insert Table 2 about here]
The statutory tax rate, the three different measures for withholding taxes, the double
tax treaty network and the personal income tax are presented in unstandardized form. Table 2
reveals that the statutory tax rate has an average of 24.69% with a minimum of 0% represent-
ing the value for certain off-shore tax havens, such as the Cayman Islands, the Bahamas and
Bermuda. The maximum sample statutory tax rate is 42.34% indicating the value for Japan in
2008. Comparing the taxation of dividends and the taxation of capital gains, we see that DIV
is on average higher than CG showing that countries exempt dividends more often from taxa-
tion than capital gains. Descriptive statistics for the three different withholding taxes are very
similar. However, the mean value for withholding taxes on royalties is highest. Maximum
withholding taxes are levied by Argentina, Chile and the Philippines (WHTD), Bangladesh
(WHTI), and Columbia (WHTR).With respect to the loss carry over possibilities, it can be seen
that only few countries permit a loss carry back as the mean value is 0.1804 with a median
and an upper quartile value of zero. In contrast, most countries permit a loss carry forward of
at least 5 years. A group taxation regime is offered by only a limited number of countries as
indicated by a mean value of 0.1934 and a median of zero. Moreover, the sample countries](https://image.slidesharecdn.com/estudo-econstor-130715121557-phpapp02/85/Estudo-econstor-24-320.jpg)
![23
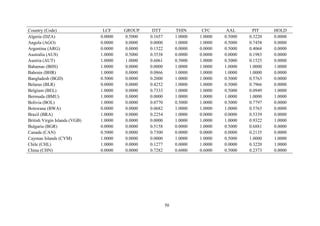
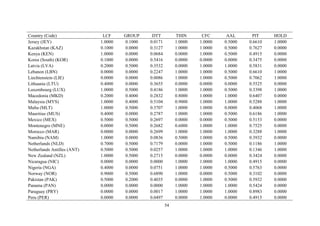
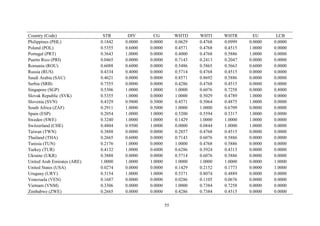
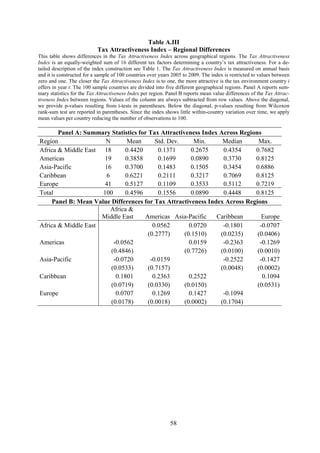
Table 3 reports mean values of the Tax Attractiveness Index per sample country over
years 2005 to 2009.
[Insert Table 3 about here]
We reveal that countries which have been classified as tax havens in former literature
(see OECD 2000; Hines and Rice 1994; Dharmapala and Hines 2009) achieve highest index
values. These countries are the Bahamas (average index value of 0.8125), Bermuda (0.8125),
the Cayman Islands (0.7813), and the British Virgin Islands (0.7739). They offer highly at-
tractive tax environments because they do not levy income taxes at all. Moreover, some Euro-
pean countries obtain high index values. For example, Luxembourg (0.7219), Jersey (0.7181),
Cyprus (0.7086), the Netherlands (0.7076), Ireland (0.6694), and Malta (0.6639) offer favora-
ble tax conditions. Other countries that have an attractive tax environment as indicated by
high index values are the United Arab Emirates (0.7682), Bahrain (0.7554), Malaysia
(0.6886), and Singapore (0.6798). In contrast, Argentina (0.0890), Venezuela (0.1301), and
South Korea (0.1505) receive lowest index values. With respect to the leading industrial na-
tions, Germany (0.5245), France (0.5329), and Great Britain (0.5913) exceed the sample av-
erage, while Japan (0.2748), the United States (0.2432), and Canada (0.3147) are far below.
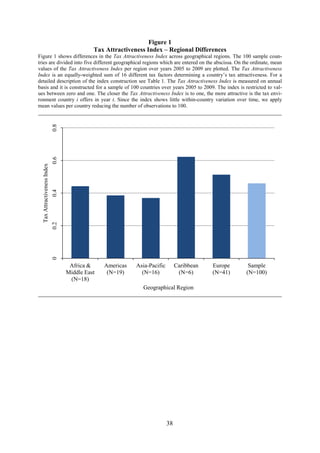
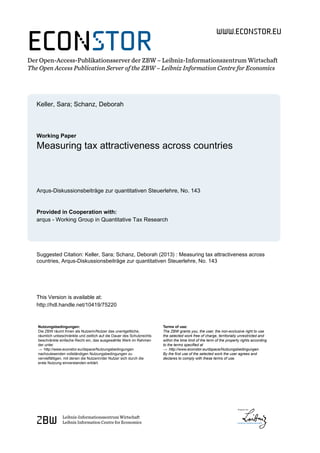
5 Regional Differences
To analyze whether the Tax Attractiveness Index differs significantly across regions
and to investigate whether regional patterns of single tax factors can be observed, we divide
our 100 sample countries into five geographical categories.19
Our sample includes 41 Europe-
an countries, 19 American countries, 6 Caribbean countries, 18 countries that are located in
Africa & Middle East, and 16 countries that fall into the Asia-Pacific region. Panel A of Table
A.III in the appendix presents summary statistics for the Tax Attractiveness Index for each of
the five geographical regions. Figure 1 shows average index values over years 2005 to 2009
across regions. It can be seen that the Caribbean and Europe achieve highest values.
[Insert Figure 1 about here]
19
We follow the classification of the World Bank. However, we summarize the categories ‘Sub-Saharan
Africa’ and ‘Middle East & Nord Africa’ to ‘Africa & Middle East’. Moreover, we combine ‘North
America’ and ‘Latin America & Caribbean’ to ‘Americas’. Though, we exclude the Caribbean countries
to be able to examine them separately since their tax environments differ heavily from those of the other
American countries. Furthermore, we summarize the World Bank’s categories ‘South Asia’ and ‘East
Asia & Pacific’ to ‘Asia-Pacific’.](https://image.slidesharecdn.com/estudo-econstor-130715121557-phpapp02/85/Estudo-econstor-26-320.jpg)
![26
In its report published in 2000, the OECD identified 35 countries as tax havens (see
OECD 2000).22
see OECD 2000
Initially, this so-called ‘black list’ contained 41 jurisdictions, however, Ber-
muda, the Cayman Islands, Cyprus, Malta, Mauritius, and San Marino were removed since
they made formal ‘advance commitments’ obliging them to eliminate their harmful tax prac-
tices and to follow the OECD principles. Though, these countries still met the tax haven crite-
ria. Moreover, the OECD identified 47 potentially harmful preferential tax regimes in 21 dif-
ferent countries, such as the Belgian ‘Co-ordination Centers’ and the Irish ‘International Fi-
nancial Services Center’ ( ). In addition, holding company regimes in 13 coun-
tries were characterized as constituting potentially harmful tax competition (see OECD 2000).
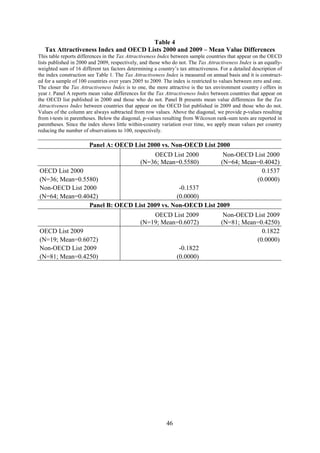
To compare the OECD’s evaluation with the Tax Attractiveness Index, we introduce a
dummy variable (OECD List 2000) assuming the value one if a country is either classified as
a tax haven (including the six countries that issued an ‘advance commitment’) or identified as
offering a preferential tax regime or as providing a potentially harmful holding regime. Not all
countries named in the OECD 2000 report form part of our sample. Hence, only 36 countries
obtain the value one. Panel A of Table 4 reveals that countries appearing on the OECD list
achieve significantly higher values for the Tax Attractiveness Index (0.5580 on average) than
countries which are not listed (0.4042 on average). Again, we use mean values of the index
over years 2005 to 2009 per country.
[Insert Table 4 about here]
After 2000, all tax haven countries subsequently committed themselves to the interna-
tionally agreed tax standard. Hence, they were removed from the ‘black list’ leading to the
fact that in year 2009 no country was listed as an unco-operative tax haven any longer. The
preferential tax regimes as well as the potentially harmful holding regimes were abolished,
amended or classified as being not harmful any longer. However, on the 2009 G20 London
Summit, a new report was agreed on to be published by the OECD. This new progress report
divided countries into three categories: first, jurisdictions that have substantially implemented
the internationally agreed tax standard, second, jurisdictions that have committed to the inter-
nationally agreed tax standard, but have not yet substantially implemented, and third, jurisdic-
tions that have not committed to the internationally agreed tax standard (see OECD 2009). In
22
In 1998, the OECD agreed on key factors to identify countries as tax havens. These criteria are: no or
only nominal taxes, a lack of effective exchange of information, lack of transparency, and no substantial
activities (see OECD 1998). Empirical studies identifying tax havens are consistent with the OECD list
published in 2000 (see Hines and Rice 1994; Dharmapala and Hines 2009).](https://image.slidesharecdn.com/estudo-econstor-130715121557-phpapp02/85/Estudo-econstor-29-320.jpg)
![27
April 2009, 40 countries fell into the first category (‘white list’). The second category was
subdivided into tax havens (30 countries) and other financial centers (8 countries). Together
with the third category (4 countries) it formed the so-called ‘grey list’. Hence, the ‘grey list’
contained 42 jurisdictions. The ‘black list’ was completely abolished.
We introduce a further dummy variable (OECD List 2009) assuming the value one if a
country appears on the ‘grey list’. Thus, 19 of our sample countries receive the value one. All
sample countries that either appear on the ‘white list’ or are not named in the OECD report at
all obtain the value zero. Until now, the OECD 2009 report has been updated several times. In
its latest version from 18 May 2012, only three countries are on the ‘grey list’. These are Nau-
ru and Niue as tax havens and Guatemala as financial center (see OECD 2012). Panel B of
Table 4 reports differences in the Tax Attractiveness Index between countries that appear on
the OECD 2009 ‘grey list’ and those who do not. Jurisdictions on the OECD list 2009 on av-
erage receive significantly higher index values (0.6072) than other sample countries (0.4250).
Moreover, correlations between the Tax Attractiveness Index and OECD List 2000 as well as
OECD List 2009, respectively, are highly significant (results not reported). Hence, the Tax
Attractiveness Index corresponds with the OECD’s evaluation, that is, countries that appear
on the OECD list(s) and are thus perceived as harmful, offer extremely attractive tax envi-
ronments as indicated by high index values.
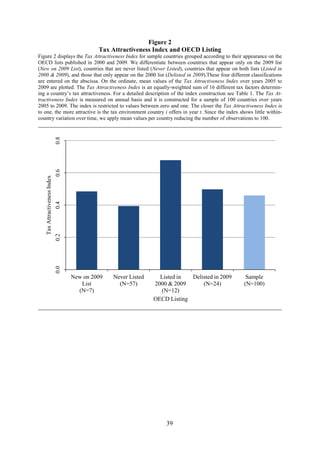
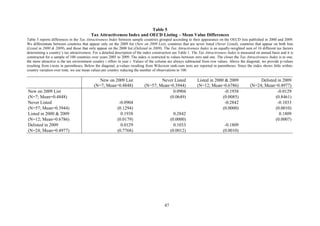
To conduct further analysis, we simultaneously take both OECD lists into considera-
tion. We divide our sample countries into four categories: countries that appear only on the
2009 list (New on 2009 List), countries that are never listed (Never Listed), countries that ap-
pear on both lists (Listed in 2000 & 2009), and those that only appear on the 2000 list (Delist-
ed in 2009). Figure 2 displays mean values of the Tax Attractiveness Index for each category.
It can be seen that jurisdictions which are constantly identified as being harmful by the OECD
receive highest index values (0.6786). In contrast, countries that are never listed, on average,
reach lowest values for the Tax Attractiveness Index (0.3944).
To investigate whether the differences observed are statistically significant, we con-
duct t-tests as well as Wilcoxon rank-sum tests. Consistent with previous analyses, we use
mean values per country to not artificially increase levels of significance. Results are present-
ed in Table 5.
[Insert Figure 2 and Table 5 about here]](https://image.slidesharecdn.com/estudo-econstor-130715121557-phpapp02/85/Estudo-econstor-30-320.jpg)
![29
to 2009, we try to shed light on the question whether countries imposing a high statutory tax
rate necessarily offer unfavorable tax conditions as reflected by the Tax Attractiveness Index.
Possibly, countries set incentives other than the statutory tax rate to create a favorable tax
climate, and, hence, attract multinational enterprises. For the purpose of this analysis, we ex-
clude the statutory tax rate from the Tax Attractiveness Index since it serves as independent
variable. Thus, the index consists of 15 tax factors only.23
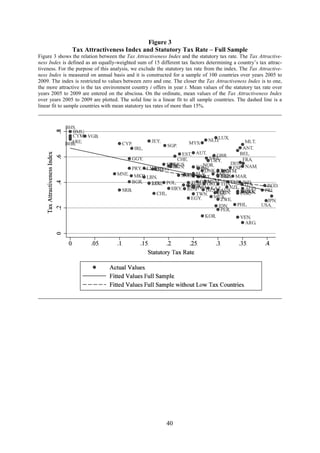
Figure 3 depicts the relation between the statutory tax rate and the index. We use mean
values over years 2005 to 2009 for both variables. The solid line which is a linear fit to all
sample countries reveals that the statutory tax rate and the Tax Attractiveness Index are nega-
tively correlated, that is, the higher the tax rate the lower the index. However, if low tax coun-
tries with a statutory tax rate of less than 15% are excluded, the relationship is less straight-
forward as indicated by the dashed line.
As we use the statutory tax rate in
unstandardized form, we expect it to be negatively associated with the Tax Attractiveness In-
dex.
[Insert Figure 3 about here]
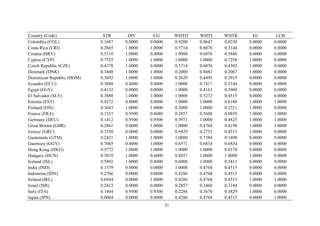
Correspondingly, Table 6 presents regression outputs with the statutory tax rate as in-
dependent and the Tax Attractiveness Index as dependent variable. Since within-country var-
iation over time is rather low, we use mean values per country. Results in Panel A confirm the
effect observed in Figure 3. If the full sample is considered, the index and the statutory tax
rate are significantly negatively correlated. If, however, only countries with statutory tax rates
of more than 15% are taken into account, the correlation is less significant.24
[Insert Table 6 about here]
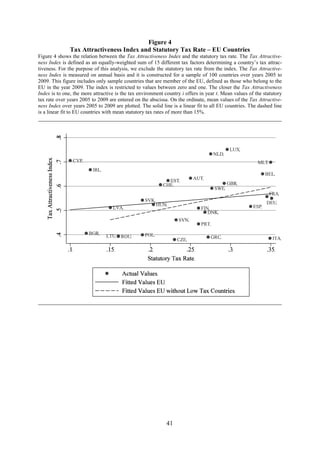
Figure 4 includes only EU countries. It can be seen that the association between the
Tax Attractiveness Index and the statutory tax rate is very weak (solid line). However, if coun-
tries with a statutory tax rate of less than 15% are neglected, even a positive correlation can be
observed (dashed line).
23
The Tax Attractiveness Index in its original version and the Tax Attractiveness Index excluding the statu-
tory tax rate are highly correlated with each other (0.9966; p-value < 0.0001) (results not reported).
24
Correlation coefficients between the Tax Attractiveness Index and the statutory tax rate yield similar re-
sults (not reported).](https://image.slidesharecdn.com/estudo-econstor-130715121557-phpapp02/85/Estudo-econstor-32-320.jpg)
![30
[Insert Figure 4 about here]
Panel B of Table 6 reports corresponding regression results. If all EU countries are
taken into consideration, the coefficient for the statutory tax rate is insignificant. If low tax
EU countries are excluded, remarkably, the statutory tax rate has a significantly positive coef-
ficient. Results suggest that the statutory tax rate is not a suitable proxy for a country’s tax
environment. There are EU countries that offer an extremely favorable tax environment as
reflected by high index values although they impose high statutory tax rates. Panel B of Table
6 also reports results for non-EU countries. The statutory tax rate and the Tax Attractiveness
Index are significantly negatively correlated. In Panel C of Table 6, we distinguish between
OECD and non-OECD countries. Again, in case all OECD countries are considered, the coef-
ficient for the statutory tax rate is significantly negative. Though, the level of significance is
not as high as for the full sample. If, however, the number of observation is reduced to OECD
countries with tax rates of more than 15%, the coefficient is insignificant. For non-OECD
countries, the relation between the Tax Attractiveness Index and the statutory tax rate is signif-
icantly negative. Though, if low tax countries are neglected, the level of significance decreas-
es.25
Our analysis reveals that the Tax Attractiveness Index and the statutory tax rate are
negatively correlated with each other. However, the statutory tax rate is not a suitable proxy
for the Tax Attractiveness Index in any case. Especially in Europe, there are countries simul-
taneously imposing high statutory tax rate and achieving high index values. Hence, jurisdic-
tions perceived as high tax countries may offer an attractive tax environment. From this, we
can conclude that countries set incentives other than the tax rate, such as a broad treaty net-
work, group taxation regimes, and special holding regimes to attract multinational enterprises.
Our findings suggest that the characteristics of other tax factors cannot be predicted on the
basis of the statutory tax rate.
7.2 Tax Attractiveness Index and Effective Tax Rates
For further analyses, we relate the Tax Attractiveness Index to effective tax rates com-
puted according to the methodology developed by King and Fullerton (1984) and extended by
Devereux and Griffith (1999, 2003) which is discussed in section 2 of the present paper. Ef-
fective average tax rates for 27 EU countries as well as 7 other countries (Croatia, Norway,
25
Regression outputs from including all observations separately and not using mean values per country do
not differ significantly (results not reported).](https://image.slidesharecdn.com/estudo-econstor-130715121557-phpapp02/85/Estudo-econstor-33-320.jpg)
![31
Switzerland, Turkey, Canada, Japan, and USA) for years 1998 to 2007 are published by
Devereux et al. (2008) in their report for the European Union (see also Elschner and
Vanborren 2009).26
We use effective average tax rates per country for year 2007 for compari-
son with the Tax Attractiveness Index. We refer to the case that only considers corporation
taxes.27
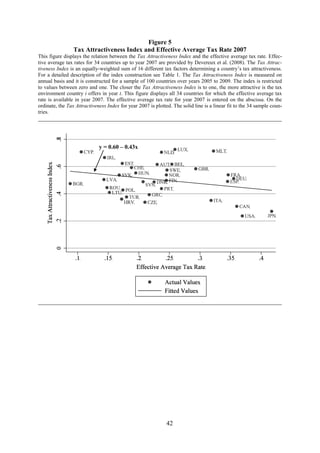
Figure 5 depicts the relation between the effective average tax rate and the Tax At-
tractiveness Index for year 2007. The slope of the line representing fitted values is rather low
indicating that the correlation is weak. Countries, such as Malta, Luxembourg, and the Neth-
erlands offer favorable tax conditions as reflected by high index values although their effec-
tive tax rates are rather high.
[Insert Figure 5 about here]
Furthermore, data for the effective marginal as well as the effective average tax rate
for 19 countries up to year 2005 are provided by the Institute for Fiscal Studies (see Devereux
et al. 2002).28
Our analysis shows that neither the effective marginal nor the effective average tax
rate is a perfect proxy for the Tax Attractiveness Index. Thus, the index cannot be represented
by existing tax measures. In contrast, it includes tax factors that have not been integrated so
far. Thus, the index constitutes a new, innovative approach to measuring a country’s tax con-
ditions that may be useful in future empirical studies.
As expected, the index is negatively correlated with the effective marginal as
well as the effective average tax rate, that is, the higher the effective tax rate, the lower the
Tax Attractiveness Index. However, the correlation is not significant (results not reported).
8 Conclusion
This paper develops a new tax measure – the Tax Attractiveness Index. The index co-
vers 16 different tax factors, many of which have been neglected in existing tax measures so
far. Hence, the Tax Attractiveness Index represents a new approach to measuring the attrac-
tiveness of a country’s tax environment and the tax planning opportunities that are offered.
We find that off-shore tax havens, such as Bermuda, the Bahamas, and the Cayman Islands
26
Hebous et al. (2011) rely on these effective tax rates for the purpose of their empirical analysis.
27
Devereux et al. (2008) compute various effective tax rates depending on the asset that is invested in and
the source of finance. We use the overall mean values provided.
28
Buettner and Ruf (2007) use this data for their analyses. We use data that refers to the base case. The
following assumptions apply: investment in plant and machinery financed by equity or retained earnings,
taxation at shareholder level not included, rate of economic rent of 10% (i.e. financial return of 20%), real
discount rate of 10%, inflation rate of 3.5%, and depreciation rate of 12.25%.](https://image.slidesharecdn.com/estudo-econstor-130715121557-phpapp02/85/Estudo-econstor-34-320.jpg)