SlideShare a Scribd company logo
1 of 1
Getting the Blencathra Futures Forecasting Model to pick winners for you
The model operates by identifying trading trends in the equities, currency or commodity markets and
forecasting future prices and risks . The model will review all the equities etc that the user has
decided to include in the models data base whether this 10 or 3000 items.
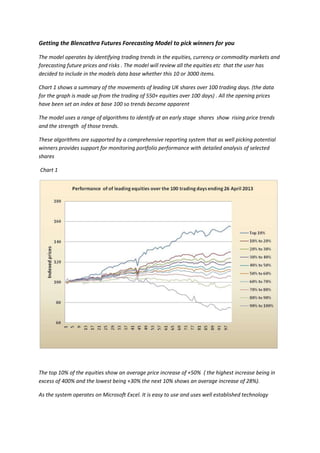
Chart 1 shows a summary of the movements of leading UK shares over 100 trading days. (the data
for the graph is made up from the trading of 550+ equities over 100 days) . All the opening prices
have been set an index at base 100 so trends become apparent
The model uses a range of algorithms to identify at an early stage shares show rising price trends
and the strength of those trends.
These algorithms are supported by a comprehensive reporting system that as well picking potential
winners provides support for monitoring portfolio performance with detailed analysis of selected
shares
Chart 1
The top 10% of the equities show an average price increase of +50% ( the highest increase being in
excess of 400% and the lowest being +30% the next 10% shows an average increase of 28%).
As the system operates on Microsoft Excel. It is easy to use and uses well established technology

More Related Content

Similar to Market web page v2

Blencathra futures equity predictive pricing model v5
Blencathra futures equity predictive pricing model v5Blencathra futures equity predictive pricing model v5
Blencathra futures equity predictive pricing model v5
barryarmstrong-marshall
 
Blencathra futures equity predictive pricing model v5
Blencathra futures equity predictive pricing model v5Blencathra futures equity predictive pricing model v5
Blencathra futures equity predictive pricing model v5
barryarmstrong-marshall
 
Blencathra futures equity predictive pricing model v5
Blencathra futures equity predictive pricing model v5Blencathra futures equity predictive pricing model v5
Blencathra futures equity predictive pricing model v5
barryarmstrong-marshall
 
2022CIFEr
2022CIFEr2022CIFEr
2022CIFEr
Takanobu Mizuta
 
Analytical Investments Aug10
Analytical Investments   Aug10Analytical Investments   Aug10
Analytical Investments Aug10
NikolayT
 
MetaStock - Trading with Purpose
MetaStock - Trading with PurposeMetaStock - Trading with Purpose
MetaStock - Trading with Purpose
Greg Lewis
 

Similar to Market web page v2 (20)

Stocks market equity price forecasting model v6
Stocks market equity price  forecasting model v6Stocks market equity price  forecasting model v6
Stocks market equity price forecasting model v6
 
Blencathra futures equity predictive pricing model v5
Blencathra futures equity predictive pricing model v5Blencathra futures equity predictive pricing model v5
Blencathra futures equity predictive pricing model v5
 
Blencathra futures equity predictive pricing model v5
Blencathra futures equity predictive pricing model v5Blencathra futures equity predictive pricing model v5
Blencathra futures equity predictive pricing model v5
 
Blencathra futures equity predictive pricing model v5
Blencathra futures equity predictive pricing model v5Blencathra futures equity predictive pricing model v5
Blencathra futures equity predictive pricing model v5
 
Blencathra futures equity predictive pricing model v4
Blencathra futures equity predictive pricing model v4Blencathra futures equity predictive pricing model v4
Blencathra futures equity predictive pricing model v4
 
Blencathra futures equity predictive pricing model v6
Blencathra futures equity predictive pricing model v6Blencathra futures equity predictive pricing model v6
Blencathra futures equity predictive pricing model v6
 
Blencathra futures equity predictive pricing model v5
Blencathra futures equity predictive pricing model v5Blencathra futures equity predictive pricing model v5
Blencathra futures equity predictive pricing model v5
 
Stocks and share forecasting model v5
Stocks and share  forecasting model v5Stocks and share  forecasting model v5
Stocks and share forecasting model v5
 
Blencathra futures equity predictive pricing model v3
Blencathra futures equity predictive pricing model v3Blencathra futures equity predictive pricing model v3
Blencathra futures equity predictive pricing model v3
 
Forex-Foreteller: Currency Trend Modeling using News Articles
Forex-Foreteller: Currency Trend Modeling using News ArticlesForex-Foreteller: Currency Trend Modeling using News Articles
Forex-Foreteller: Currency Trend Modeling using News Articles
 
Forex Data Analysis using Weka
Forex Data Analysis using WekaForex Data Analysis using Weka
Forex Data Analysis using Weka
 
FOREX DATA ANALYSIS USING WEKA
FOREX DATA ANALYSIS USING WEKAFOREX DATA ANALYSIS USING WEKA
FOREX DATA ANALYSIS USING WEKA
 
Improved stock prediction accuracy using ema technique
Improved stock prediction accuracy using ema techniqueImproved stock prediction accuracy using ema technique
Improved stock prediction accuracy using ema technique
 
IJCS_37_4_06
IJCS_37_4_06IJCS_37_4_06
IJCS_37_4_06
 
Pres markets01
Pres markets01Pres markets01
Pres markets01
 
2022CIFEr
2022CIFEr2022CIFEr
2022CIFEr
 
Mt 75 maelzer revise
Mt 75 maelzer reviseMt 75 maelzer revise
Mt 75 maelzer revise
 
Analytical Investments Aug10
Analytical Investments   Aug10Analytical Investments   Aug10
Analytical Investments Aug10
 
Oriskany' TCS Multi-Factor Timing - Factor Investing White Paper
Oriskany' TCS Multi-Factor Timing - Factor Investing White PaperOriskany' TCS Multi-Factor Timing - Factor Investing White Paper
Oriskany' TCS Multi-Factor Timing - Factor Investing White Paper
 
MetaStock - Trading with Purpose
MetaStock - Trading with PurposeMetaStock - Trading with Purpose
MetaStock - Trading with Purpose
 

More from barryarmstrong-marshall (20)

Perftable
PerftablePerftable
Perftable
 
Perftable
PerftablePerftable
Perftable
 
Projected price v3
Projected price v3Projected price v3
Projected price v3
 
Projected price v2
Projected price v2Projected price v2
Projected price v2
 
Review sample v2
Review sample v2Review sample v2
Review sample v2
 
Review sample v1
Review sample v1Review sample v1
Review sample v1
 
Index comparator v1
Index comparator v1Index comparator v1
Index comparator v1
 
Index comparator
Index comparatorIndex comparator
Index comparator
 
Projected price v1
Projected price v1Projected price v1
Projected price v1
 
Projected price
Projected priceProjected price
Projected price
 
Projected price
Projected priceProjected price
Projected price
 
Sample reports from manual
Sample reports from manualSample reports from manual
Sample reports from manual
 
Market web page v2
Market web page v2Market web page v2
Market web page v2
 
Market web page v3
Market web page v3Market web page v3
Market web page v3
 
A new approach to investment opportunities (2)
A new approach to investment opportunities  (2)A new approach to investment opportunities  (2)
A new approach to investment opportunities (2)
 
Investment (4)
Investment (4)Investment (4)
Investment (4)
 
Investment (5)
Investment (5)Investment (5)
Investment (5)
 
Investment (6)
Investment (6)Investment (6)
Investment (6)
 
Investment (7)
Investment (7)Investment (7)
Investment (7)
 
Making money out of equities in challenging markets
Making money out of equities in challenging marketsMaking money out of equities in challenging markets
Making money out of equities in challenging markets
 

Market web page v2

  • 1. Getting the Blencathra Futures Forecasting Model to pick winners for you The model operates by identifying trading trends in the equities, currency or commodity markets and forecasting future prices and risks . The model will review all the equities etc that the user has decided to include in the models data base whether this 10 or 3000 items. Chart 1 shows a summary of the movements of leading UK shares over 100 trading days. (the data for the graph is made up from the trading of 550+ equities over 100 days) . All the opening prices have been set an index at base 100 so trends become apparent The model uses a range of algorithms to identify at an early stage shares show rising price trends and the strength of those trends. These algorithms are supported by a comprehensive reporting system that as well picking potential winners provides support for monitoring portfolio performance with detailed analysis of selected shares Chart 1 The top 10% of the equities show an average price increase of +50% ( the highest increase being in excess of 400% and the lowest being +30% the next 10% shows an average increase of 28%). As the system operates on Microsoft Excel. It is easy to use and uses well established technology