1. A new approach to equity investment opportunities
Making the Blencathra Futures Investment Model work for you
Equity markets have a range of characteristics . One important one being the obvious observation is that growth in equity
value will vary from equity to equity.
Within the market there will be number shares that outperform the rest. It is these shares that the Blencathra Model
focuses on identifying early on in their growth cycle. These are not only expected to outperform the market index but
show exceptional growth.
The paper below shows the growth of equities both in theory and in actual practice and explains the processes used by
the model to identify these shares
How Blencathra Futures Investment model can aid you in identifying shares that will
outperform market trends and how to flag buy and sell points for investments and enable
you to review hundreds of shares in a few minutes to enable you to identify those shares
which have the potential for high performance
Characteristics of equity market performance (theory)
Indices
The key indicator of the performance of an equity is the markets index eg FTSE100, Dow Jones, SP500, CAC40
These indices give an indication of the overall direction of individual shares . The index is built from data derived from
individual shares some which will outperform the index and others that lag behind the index
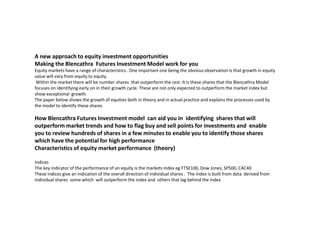
2. Fig 1 shows what a theoretical equity performance in a market could look like after a 100 days of trading. This distribution is based on a
normal curve ie 68% of prices will be close to the index but there are a significant number of equities that show a 30% to 40% better
performance than the index (30 equities out 490 in the example) conversely in this example there are 30 equities showing a similar %
shortfalls. The trick is to find a methodology to identify those high flyers.
Fig 1