SlideShare a Scribd company logo
1 of 1
Download to read offline
What	if...

Imagine a business...                                                                              Last	year's	results:
                                                                                                   Sales                  1,000,000
 Sales                £1,000,000                                                                   Cost	of	sales           850,000
 Margin               15%                                                                          Gross	profit            150,000
 Overheads            £100,000                                                                     Overheads               100,000
 Valuation            3	x	profit	before	tax                                                        Profit	before	tax        50,000


                                                                                                   Valuation               150,000


                                                              Margin	                                 Both	happen	together	and	
 What	if...                         Sales	increase	
                                          by	10%
                                                            increases	
                                                                     	
                                                                          Both	happen	
                                                                              together
                                                                                                      the	business	is	now	worth	 	
                                                              to	20%                                             4	times	profits
 Sales                                  1,100,000           1,000,000           1,100,000                                 1,100,000
 Cost	of	sales                            935,000            800,000             880,000                                   880,000
 Gross	profit                             165,000            200,000             220,000                                   220,000


 Overheads                                100,000            100,000             100,000                                   100,000
 Profit	before	tax                            65,000         100,000             120,000                                   120,000


 Valuation                                195,000            300,000             360,000                                   480,000


 Increase	in	annual	profits                   15,000          50,000              70,000                                    70,000

 Increase	in	value                            45,000         150,000             210,000                                   330,000


If this was your business... 	                                    	         	          	       	
  	Can	you	accurately	measure	performance	to	give	you	the	starting	point?	

  	Can	you	measure	sales	and	profit	by	client?	         	         	         	          	       	

  	Can	you	measure	sales	and	profit	by	service	or	product?	       	         	          	

  	Do	you	know	what	changes	to	make	to	increase	your	margins	and	how	to	ensure	the	changes	are	effective?

  	Do	you	have	a	realistic	valuation	of	your	business	and	do	you	know	how	to	increase	its	value?

  	Are	you	being	helped	to	see	your	business	this	way	and	to	increase	its	value	as	a	result?

We	help	many	businesses	to	increase	their	profitability	and	value	by	identifying	and	
changing	the	drivers	that	make	a	difference.


If	you	would	like	to	find	out	how	we	can	help	you,	please	
call	Michael	Austin	on	020	7384	6800

More Related Content

What's hot

Email Marketing ROI Calculator
Email Marketing ROI CalculatorEmail Marketing ROI Calculator
Email Marketing ROI CalculatorDemand Metric
 
Chapter 6 Cost-Volume-Profit Relationships
Chapter 6 Cost-Volume-Profit RelationshipsChapter 6 Cost-Volume-Profit Relationships
Chapter 6 Cost-Volume-Profit RelationshipsViệt Hoàng Dương
 
Acc mgt noreen06 cost volume-profit relationships
Acc mgt noreen06 cost volume-profit relationshipsAcc mgt noreen06 cost volume-profit relationships
Acc mgt noreen06 cost volume-profit relationshipsJudianto Nugroho
 
COST-VOLUME-PROFIT RELATIONSHIPS
COST-VOLUME-PROFIT RELATIONSHIPSCOST-VOLUME-PROFIT RELATIONSHIPS
COST-VOLUME-PROFIT RELATIONSHIPSMahmudul Hasan
 
Maths. topic 2,3,4,5
Maths. topic 2,3,4,5Maths. topic 2,3,4,5
Maths. topic 2,3,4,5emailtoshahed
 
Presenting your startup budget
Presenting your startup budgetPresenting your startup budget
Presenting your startup budgetJan Bendtsen
 
Cost cutting proposals
Cost cutting proposalsCost cutting proposals
Cost cutting proposalsFayroozDarwish
 
Grape Leaf Financials
Grape Leaf FinancialsGrape Leaf Financials
Grape Leaf Financialssasha lugo
 
The language of financial planning
The language of financial planningThe language of financial planning
The language of financial planningJan Bendtsen
 
Recruitment Earnings Survey
Recruitment Earnings SurveyRecruitment Earnings Survey
Recruitment Earnings Surveydanster1985
 
What landlords need to know about buy-to-let-taxes
What landlords need to know about buy-to-let-taxesWhat landlords need to know about buy-to-let-taxes
What landlords need to know about buy-to-let-taxesChris Thompson
 
Evergreen growth of hero honda motors
Evergreen growth of hero honda motorsEvergreen growth of hero honda motors
Evergreen growth of hero honda motorsSumit Panwar
 

What's hot (13)

Email Marketing ROI Calculator
Email Marketing ROI CalculatorEmail Marketing ROI Calculator
Email Marketing ROI Calculator
 
Chapter 6 Cost-Volume-Profit Relationships
Chapter 6 Cost-Volume-Profit RelationshipsChapter 6 Cost-Volume-Profit Relationships
Chapter 6 Cost-Volume-Profit Relationships
 
Acc mgt noreen06 cost volume-profit relationships
Acc mgt noreen06 cost volume-profit relationshipsAcc mgt noreen06 cost volume-profit relationships
Acc mgt noreen06 cost volume-profit relationships
 
COST-VOLUME-PROFIT RELATIONSHIPS
COST-VOLUME-PROFIT RELATIONSHIPSCOST-VOLUME-PROFIT RELATIONSHIPS
COST-VOLUME-PROFIT RELATIONSHIPS
 
Maths. topic 2,3,4,5
Maths. topic 2,3,4,5Maths. topic 2,3,4,5
Maths. topic 2,3,4,5
 
Presenting your startup budget
Presenting your startup budgetPresenting your startup budget
Presenting your startup budget
 
Cost cutting proposals
Cost cutting proposalsCost cutting proposals
Cost cutting proposals
 
Grape Leaf Financials
Grape Leaf FinancialsGrape Leaf Financials
Grape Leaf Financials
 
Chapter 13
Chapter 13Chapter 13
Chapter 13
 
The language of financial planning
The language of financial planningThe language of financial planning
The language of financial planning
 
Recruitment Earnings Survey
Recruitment Earnings SurveyRecruitment Earnings Survey
Recruitment Earnings Survey
 
What landlords need to know about buy-to-let-taxes
What landlords need to know about buy-to-let-taxesWhat landlords need to know about buy-to-let-taxes
What landlords need to know about buy-to-let-taxes
 
Evergreen growth of hero honda motors
Evergreen growth of hero honda motorsEvergreen growth of hero honda motors
Evergreen growth of hero honda motors
 

Similar to How a 10% Sales Increase and 5% Margin Improvement Could Boost Business Value by Over £300,000

Interpreting Accounts: Profitability Ratios
Interpreting Accounts: Profitability RatiosInterpreting Accounts: Profitability Ratios
Interpreting Accounts: Profitability Ratiostutor2u
 
CVP Analysis Detailed Note - Analyst Skill.pdf
CVP Analysis Detailed Note - Analyst Skill.pdfCVP Analysis Detailed Note - Analyst Skill.pdf
CVP Analysis Detailed Note - Analyst Skill.pdfAmitSarkar498752
 
Lecture 4 the nature of costs
Lecture 4 the nature of costsLecture 4 the nature of costs
Lecture 4 the nature of costsFrozen Corpse
 
Calculating and Interpreting Profit
Calculating and Interpreting ProfitCalculating and Interpreting Profit
Calculating and Interpreting Profittutor2u
 
Scania Presentation_Q2_2008_tcm10-211097
Scania Presentation_Q2_2008_tcm10-211097Scania Presentation_Q2_2008_tcm10-211097
Scania Presentation_Q2_2008_tcm10-211097finance50
 
Cost volume-profit-relationships
Cost volume-profit-relationshipsCost volume-profit-relationships
Cost volume-profit-relationshipsWBUTTUTORIALS
 
Planning Your Business
Planning Your BusinessPlanning Your Business
Planning Your BusinessIanChurcher
 
scana Presentation-Q4-2008_tcm10-227202
scana  Presentation-Q4-2008_tcm10-227202scana  Presentation-Q4-2008_tcm10-227202
scana Presentation-Q4-2008_tcm10-227202finance50
 
Scania Presentation-Q4-2008_tcm10-227202
Scania Presentation-Q4-2008_tcm10-227202Scania Presentation-Q4-2008_tcm10-227202
Scania Presentation-Q4-2008_tcm10-227202finance50
 
Wilkins Kennedy - Business Recovery: Early signs a business is in financial t...
Wilkins Kennedy - Business Recovery: Early signs a business is in financial t...Wilkins Kennedy - Business Recovery: Early signs a business is in financial t...
Wilkins Kennedy - Business Recovery: Early signs a business is in financial t...misssarahj
 
Bill Stankeiwicz Copy Scope 2010 Bristlecone Co. Strategy
Bill Stankeiwicz Copy Scope 2010 Bristlecone Co. StrategyBill Stankeiwicz Copy Scope 2010 Bristlecone Co. Strategy
Bill Stankeiwicz Copy Scope 2010 Bristlecone Co. StrategyBillStankiewicz
 
Presentation CM-B.E.-CVPA
Presentation CM-B.E.-CVPAPresentation CM-B.E.-CVPA
Presentation CM-B.E.-CVPATony Wayne
 
Finance For Non Financiers
Finance For Non FinanciersFinance For Non Financiers
Finance For Non Financiersashleydeakin
 

Similar to How a 10% Sales Increase and 5% Margin Improvement Could Boost Business Value by Over £300,000 (20)

Interpreting Accounts: Profitability Ratios
Interpreting Accounts: Profitability RatiosInterpreting Accounts: Profitability Ratios
Interpreting Accounts: Profitability Ratios
 
CVP Analysis Detailed Note - Analyst Skill.pdf
CVP Analysis Detailed Note - Analyst Skill.pdfCVP Analysis Detailed Note - Analyst Skill.pdf
CVP Analysis Detailed Note - Analyst Skill.pdf
 
Lecture 4 the nature of costs
Lecture 4 the nature of costsLecture 4 the nature of costs
Lecture 4 the nature of costs
 
Calculating and Interpreting Profit
Calculating and Interpreting ProfitCalculating and Interpreting Profit
Calculating and Interpreting Profit
 
Scania Presentation_Q2_2008_tcm10-211097
Scania Presentation_Q2_2008_tcm10-211097Scania Presentation_Q2_2008_tcm10-211097
Scania Presentation_Q2_2008_tcm10-211097
 
Scania Q3 2008
Scania Q3 2008Scania Q3 2008
Scania Q3 2008
 
Budgets
BudgetsBudgets
Budgets
 
Sales mix break
Sales mix breakSales mix break
Sales mix break
 
Cost volume-profit-relationships
Cost volume-profit-relationshipsCost volume-profit-relationships
Cost volume-profit-relationships
 
Leverages 1
Leverages 1Leverages 1
Leverages 1
 
Planning Your Business
Planning Your BusinessPlanning Your Business
Planning Your Business
 
scana Presentation-Q4-2008_tcm10-227202
scana  Presentation-Q4-2008_tcm10-227202scana  Presentation-Q4-2008_tcm10-227202
scana Presentation-Q4-2008_tcm10-227202
 
Scania Presentation-Q4-2008_tcm10-227202
Scania Presentation-Q4-2008_tcm10-227202Scania Presentation-Q4-2008_tcm10-227202
Scania Presentation-Q4-2008_tcm10-227202
 
CVP analysis
CVP analysis CVP analysis
CVP analysis
 
Wilkins Kennedy - Business Recovery: Early signs a business is in financial t...
Wilkins Kennedy - Business Recovery: Early signs a business is in financial t...Wilkins Kennedy - Business Recovery: Early signs a business is in financial t...
Wilkins Kennedy - Business Recovery: Early signs a business is in financial t...
 
Bill Stankeiwicz Copy Scope 2010 Bristlecone Co. Strategy
Bill Stankeiwicz Copy Scope 2010 Bristlecone Co. StrategyBill Stankeiwicz Copy Scope 2010 Bristlecone Co. Strategy
Bill Stankeiwicz Copy Scope 2010 Bristlecone Co. Strategy
 
Presentation CM-B.E.-CVPA
Presentation CM-B.E.-CVPAPresentation CM-B.E.-CVPA
Presentation CM-B.E.-CVPA
 
Chapter 9
Chapter 9Chapter 9
Chapter 9
 
Chapter 9
Chapter 9Chapter 9
Chapter 9
 
Finance For Non Financiers
Finance For Non FinanciersFinance For Non Financiers
Finance For Non Financiers
 

How a 10% Sales Increase and 5% Margin Improvement Could Boost Business Value by Over £300,000

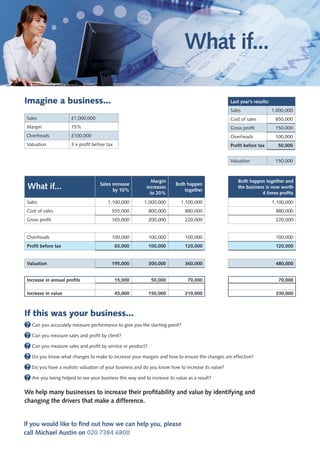
  • 1. What if... Imagine a business... Last year's results: Sales 1,000,000 Sales £1,000,000 Cost of sales 850,000 Margin 15% Gross profit 150,000 Overheads £100,000 Overheads 100,000 Valuation 3 x profit before tax Profit before tax 50,000 Valuation 150,000 Margin Both happen together and What if... Sales increase by 10% increases Both happen together the business is now worth to 20% 4 times profits Sales 1,100,000 1,000,000 1,100,000 1,100,000 Cost of sales 935,000 800,000 880,000 880,000 Gross profit 165,000 200,000 220,000 220,000 Overheads 100,000 100,000 100,000 100,000 Profit before tax 65,000 100,000 120,000 120,000 Valuation 195,000 300,000 360,000 480,000 Increase in annual profits 15,000 50,000 70,000 70,000 Increase in value 45,000 150,000 210,000 330,000 If this was your business... Can you accurately measure performance to give you the starting point? Can you measure sales and profit by client? Can you measure sales and profit by service or product? Do you know what changes to make to increase your margins and how to ensure the changes are effective? Do you have a realistic valuation of your business and do you know how to increase its value? Are you being helped to see your business this way and to increase its value as a result? We help many businesses to increase their profitability and value by identifying and changing the drivers that make a difference. If you would like to find out how we can help you, please call Michael Austin on 020 7384 6800