SlideShare a Scribd company logo
1 of 10
Sharp Reorg Analysis (6/7/09)
My initial thoughts/observations on the Sharp reorg – I’ve divided this into four areas: CTR, Conversion
Rates, AOV, and Opportunities.

                                         Click through Rate
   From 6/2 – 6/6, Sharp’s overall CTR was 1.97% - similar to what it was before Phase 3 reorg
   (1.88%). This result was expected as there was basically no change in ad copy for high traffic Sharp
   keywords during the Phase 3 reorg. For perspective, here are selected stats for our top brands since
   the 5/4 Phase 2 reorg:

                                 Brand             CTR    C-Rate      Orders
                        Poulan                    6.78%   1.50%         449
                        Frigidaire                5.25%   4.14%        1,191
                        Denon                     4.73%   1.32%          10
                        Whirlpool                 4.27%   3.28%        1,548
                        Maytag                    4.22%   4.34%        1,724
                        LG                        4.07%   3.41%         177
                        Pioneer                   3.71%   1.52%          77
                        Haier                     3.66%   2.32%          42
                        Alpine                    3.62%   2.84%          39
                        Clarion                   3.59%   2.01%           8
                        RCA                       2.72%   2.30%         114
                        Brother                   2.66%   1.96%          13
                        Toshiba                   2.13%   2.88%         320
                        Amana                     2.07%   1.04%          34
                        Sony                      2.00%   2.34%        1,314
                        Sharp (6/2 - 6/6)         1.97%   4.08%          98
                        Sanyo                     1.89%   2.30%          35
                        Vizio                     1.89%   1.51%          11
                        Sharp (5/4 - 6/2)         1.88%   4.19%         520
                        Panasonic                 1.84%   3.92%        1,473
                        Hitachi                   1.84%   2.70%         159
                        Zenith                    1.84%   1.58%          37
                        Samsung                   1.83%   3.79%         853
                        General Electric          1.77%   1.42%         203
                        Yamaha                    1.67%   2.02%          29
                        Hewlett Packard           1.67%   1.11%           7
                        Kenwood                   1.57%   2.13%          73
                        JVC                       1.49%   3.33%         509
                        JennAir                   1.18%   1.07%          15
                        Philips                   0.75%   1.07%         104
                        Canon                     0.48%   1.06%          11

   Clearly some brands have much higher CTRs when the core group of keywords and ad copy are very
   similar. Generally speaking, CTR for big-ticket appliance manufacturers are markedly higher than


                                                   1
the CE and computer brands. I suspect the differences in CTR can be chalked up to a combination
   of:

   1) High-traffic general keywords for the large CE brands generate lots of impressions but the ads are
   not relevant to what the user is looking for (hypothetical e.g. - we’ll show up for “sony” even though
   only 5% of users entering that are not looking for parts or accessories whereas 10% of users entering
   “maytag” are looking for parts)
   2) People really need parts for appliances (rarely just browsing for accessories)
   3) Appliance part shoppers might be more brand agnostic than CE/computer shoppers (brand
   meaning website in this case)

   To illustrate point #1 above, here are the top five keywords by impressions with select stats between
   5/4 and 6/2 for four brands: Whirlpool, Maytag, Sony, and Sharp

                                                                                    Avg   Orders   C-Rate
   Campaign               Keyword        Match Type    Imprs      Clicks    CTR
                                                                                    Pos   (1-PC)   (1-PC)
Maytag            maytag                 Broad        649,687     12,080   1.86%    3.8    333     2.76%
Maytag            maytag                 Exact         80,590     5,723    7.10%    1.9    289     5.05%
Maytag            maytag parts           Broad         33,625     5,422    16.12%   2.4    241     4.44%
Maytag            maytag parts           Exact         23,416     7,877    33.64%   1.4    470     5.97%
Maytag            maytag accessories     Broad         15,446      653     4.23%    5.2     26     3.98%
Maytag Top 5                                          802,764     31,755   3.96%          1,359    4.28%
Sharp             sharp                  Phrase       280,077     2,131    0.76%    3.7     38     1.78%
Sharp             sharp                  Exact         86,426      648     0.75%    1.2     28     4.32%
Sharp             sharp parts            Broad         58,999     2,619    4.44%    2.9     70     2.67%
Sharp             sharp electronics      Broad         42,663      602     1.41%    2.4     20     3.32%
Sharp             sharp microwave        Broad         23,104      290     1.26%    4.7     11     3.79%
Sharp Top 5                                           491,269     6,290    1.28%           167     2.66%
Sony              sony                   Exact        1,031,059   3,443    0.33%    1.8    114     3.31%
Sony              sony parts             Broad        378,973     16,637   4.39%    3.3    265     1.59%
Sony              sony accessories       Broad        202,208     4,240    2.10%     4      46     1.08%
Sony              sony.com               Broad        181,691     5,188    2.86%    2.2    180     3.47%
Sony              Sony TV Parts          Broad         75,974     2,680    3.53%    2.2     85     3.17%
Sony Top 5                                            1,869,905   32,188   1.72%           690     2.14%
Whirlpool         whirlpool              Broad        624,403     14,193   2.27%    4.7    279     1.97%
Whirlpool         whirlpool parts        Broad        140,296     8,656    6.17%    5.5    252     2.91%
Whirlpool         whirlpool              Exact        128,442     6,300    4.90%    2.5    266     4.22%
Whirlpool         whirlpool parts        Exact         26,150     9,914    37.91%   1.1    468     4.72%
Whirlpool         whirlpool dishwasher   Broad         22,816      208     0.91%    6.7     9      4.33%
Whirlpool Top 5                                       942,107     39,271   4.17%          1,274    3.24%


   The performance of the top five keywords tells the CTR story in a nutshell– the high traffic
   keywords (notably the generic, non-targeted, containing just-the-brand keywords) for certain brands
   do generate sales, but the ads are simply not clicked on as often. The word “sharp” is already
   ambiguous and a common adjective which doesn’t help our efforts.


                                                        2
For an apples to apples comparison, here are select stats for exact searches for the same type of
        keyword:

                                                                                       Avg    Orders     C-Rate
        Campaign      Keyword            Match Type   Imprs      Clicks    CTR
                                                                                       Pos    (1-PC)     (1-PC)
        Maytag        maytag parts       Exact        23,416     7,877     33.64%      1.4    470        5.97%
        Sharp         sharp parts        Exact        774        189       24.42%      1      10         5.29%
        Sony          sony parts         Exact        3,701      1,173     31.69%      1      54         4.60%
        Whirlpool     whirlpool parts    Exact        26,150     9,914     37.91%      1.1    468        4.72%

        Not surprisingly, we do much better with CTR (and conversion rates) for targeted searches when a
        user is indicating they want parts.

        Applying more negative keywords may improve CTR for brands such as Sharp but it still may be
        difficult to significantly boost CTR without jeopardizing orders and revenue – it could be a reality
        we have to live with.

        However, one benefit of the reorg is that we can see how CTR varies within brands across different
        model and part categories. This analysis is limited by the lack of accumulated date in the Phase 3
        reorg, but here’s a snapshot of selected stats for Sharp ad groups with at least 500 impressions,
        sorted by CTR.

                                                  Avg             Avg     Orders    C-Rate   Orders
     Ad Group         Imprs     Clicks     CTR            Cost                                         Revenue    ROI
                                                  CPC             Pos     (1-PC)    (1-PC)   (M-PC)
Remote Controls       1,533      120      7.83%   $0.35   $42      2        7       5.83%      8        $264      91%
Adapters              1,161       89      7.67%   $0.51   $45     1.9       4       4.49%      4        $185      22%
TV Remote Controls     718        54      7.52%   $0.47   $25     1.6       5       9.26%      5        $245      192%
Microwave Trays        741        53      7.15%   $0.60   $32     2.1       4       7.55%      4        $161      52%
Vacuums               1,488       73      4.91%   $0.44   $32     4.9       6       8.22%      9        $223      106%
Televisions           3,092      136      4.40%   $0.48   $65     4.9       4       2.94%      4        $161      -26%
Camcorders            3,246      121      3.73%   $0.52   $62     2.7       2       1.65%      2         $60      -71%
Microwaves            11,259     379      3.37%   $0.65   $248    4.3      31       8.18%     35       $1,503     82%
Appliances            3,709       92      2.48%   $0.63   $58     4.5       5       5.43%      5        $144      -25%
Electronics           6,811      166      2.44%   $0.62   $103    2.4       6       3.61%      8        $638      87%
General Terms         82,236    1,055     1.28%   $0.45   $476    3.2      20       1.90%     24       $2,099     32%
Projectors             743        6       0.81%   $1.25    $7      6        0       0.00%      0         $0       -100%
Lamps                 4,706       22      0.47%   $0.90   $20     3.3       0       0.00%      0         $0       -100%

        In this context, we can see again how the performance of general terms drags down the CTR for the
        whole brand. Note that the ROI for general terms indicates it’s still a cost effective ad group.


                                                          3
Conversion Rate

From 6/2 – 6/6, Sharp’s overall conversion rate was 4.08% - similar to what it was before the Phase
3 reorg (4.19%). This result was also expected since virtually all high traffic Sharp keywords were
already directed to winning landing pages prior to Phase 3. Once again, the chart from the first page:

                             Brand              CTR     C-Rate      Orders
                   Maytag                      4.22%    4.34%        1,724
                   Sharp (5/4 - 6/2)           1.88%    4.19%         520
                   Frigidaire                  5.25%    4.14%        1,191
                   Sharp (6/2 - 6/6)           1.97%    4.08%          98
                   Panasonic                   1.84%    3.92%        1,473
                   Samsung                     1.83%    3.79%         853
                   LG                          4.07%    3.41%         177
                   JVC                         1.49%    3.33%         509
                   Whirlpool                   4.27%    3.28%        1,548
                   Toshiba                     2.13%    2.88%         320
                   Alpine                      3.62%    2.84%          39
                   Hitachi                     1.84%    2.70%         159
                   Sony                        2.00%    2.34%        1,314
                   Haier                       3.66%    2.32%          42
                   RCA                         2.72%    2.30%         114
                   Sanyo                       1.89%    2.30%          35
                   Kenwood                     1.57%    2.13%          73
                   Yamaha                      1.67%    2.02%          29
                   Clarion                     3.59%    2.01%           8
                   Brother                     2.66%    1.96%          13
                   Zenith                      1.84%    1.58%          37
                   Pioneer                     3.71%    1.52%          77
                   Vizio                       1.89%    1.51%          11
                   Poulan                      6.78%    1.50%         449
                   General Electric            1.77%    1.42%         203
                   Denon                       4.73%    1.32%          10
                   Hewlett Packard             1.67%    1.11%           7
                   JennAir                     1.18%    1.07%          15
                   Philips                     0.75%    1.07%         104
                   Canon                       0.48%    1.06%          11
                   Amana                       2.07%    1.04%          34


Sharp has one of the higher conversion rates compared to other brands. One likely reason is that the
Sharp keywords we aggressively compete for via SEM are remote controls and microwave parts –
strong categories for PartStore. (Note: According to ConsumerReports, Sharp is the number 2
microwave brand in the US, behind GE). Sharp may also be a brand with better data and/or robust
vendor coverage which would help account for the high conversion rates. This will be more evident
as the Phase 3 reorg is rolled out across the Brand 1 account and comparing ad groups is possible.


                                                4
Ad groups with at least 500 impressions sorted by C-Rate:

                                               Avg            Avg   Orders   C-Rate   Orders
     Ad Group        Imprs    Clicks   CTR             Cost                                    Revenue   ROI
                                               CPC            Pos   (1-PC)   (1-PC)   (M-PC)
TV Remote Controls    718       54     7.52%   $0.47   $25    1.6    5       9.26%     5        $245      192%
Vacuums              1,488      73     4.91%   $0.44   $32    4.9    6       8.22%     9        $223      106%
Microwaves           11,259    379     3.37%   $0.65   $248   4.3    31      8.18%     35      $1,503      82%
Microwave Trays       741       53     7.15%   $0.60   $32    2.1    4       7.55%     4        $161       52%
Remote Controls      1,533     120     7.83%   $0.35   $42     2     7       5.83%     8        $264       91%
Appliances           3,709      92     2.48%   $0.63   $58    4.5    5       5.43%     5        $144      -25%
Adapters             1,161      89     7.67%   $0.51   $45    1.9    4       4.49%     4        $185       22%
Electronics          6,811     166     2.44%   $0.62   $103   2.4    6       3.61%     8        $638       87%
Televisions          3,092     136     4.40%   $0.48   $65    4.9    4       2.94%     4        $161      -26%
General Terms        82,236   1,055    1.28%   $0.45   $476   3.2    20      1.90%     24      $2,099      32%
Camcorders           3,246     121     3.73%   $0.52   $62    2.7    2       1.65%     2        $60       -71%
Projectors            743       6      0.81%   $1.25    $7     6     0       0.00%     0         $0      -100%
Lamps                4,706      22     0.47%   $0.90   $20    3.3    0       0.00%     0         $0      -100%

       Most the ad groups with sizeable traffic have very respectable conversion rates. General terms, as
       we’d expect, have lower conversion rates. There’s really not enough data to make any conclusions
       about projectors and lamps at this point. Televisions and camcorders appear to be underperforming.
       FYI:

       •   Sharp’s North America LCD market share was 9.4% in Q1 2009. Source
       •   Sharp doesn’t sell new camcorders as of March 2006 - Source - so it’s probably not surprising
           this is a dying category. Note: Camcorder technology evolves quickly these days (recording
           formats become obsolete) so there may be less of an incentive to fix an old camcorder compared
           to other CE categories.


                                                       5
AOV

Phase 3 of the reorg will also shed light on AOV. Of course we were always able to calculate AOV
based on how parts are categorized and classified in our system, but it may be illuminating to see
how AOV shakes down by ad group now that like terms are more grouped together.

AOV for all ad groups that have recorded at least one order (6/2 – 6/6):

                                                      Total
                             Ad Group                           Revenue    AOV
                                                     Orders
                  Camcorder Cables                      1         $92       $92
                  General Terms                        24        $2,099     $87
                  Electronics                           8         $638      $80
                  TV Remote Controls                    5        $245       $49
                  Adapters                              4        $185       $46
                  Microwaves                           35        $1,503     $43
                  Microwave Trays                       4         $161      $40
                  Televisions                           4        $161       $40
                  Microwave Filters                     1        $40        $40
                  Part Numbers                          1        $36        $36
                  Remote Controls                       8        $264       $33
                  Camcorders                            2        $60        $30
                  Appliances                            5        $144       $29
                  Vacuums                               9        $223       $25
                  Fax Machines                          2        $28        $14
                  Microwave Waveguide Covers            1         $11       $11


                                     Notes & Observations
•   “Electronics” and “Appliances” are general vertical terms like “sharp electronics parts” or “sharp
    appliances.”
•   “Remote Controls” are non model-category specific terms like “sharp remote control,” so the
    user was not necessarily looking for a television remote.
•   “Microwaves” are general microwave terms - it’s probably safe to assume that many of these
    orders were microwave trays based on the similar AOVs.
•   “Part Numbers” are keywords with the brand+part number that existed in an ad group in the old
    structure.
•   No idea what camcorder cable would cost so much (it’s possible the user ultimately bought
    something else).


                                                6
Opportunities

   Opportunities to improve the performance of the Sharp campaign are apparent after just five days
   since the reorg.

   The ad groups identified in yellow highlight should probably be buttressed with more keywords if
   possible – They’ve converted on relatively few keywords thus far with a positive ROI:

                          Total         Total                                                               Avg             C-Rate
     Ad Group                                     Cost      Rev       AOV    Imprs    Clicks      CTR               ROI
                         Orders       Keywords                                                              Pos             (1-PC)
Part Numbers                 1            293      $0       $36       $36     175       1         0.57%     2.7    5900%    100.0%
Microwave Trays              4            186     $32       $161      $40     741       53        7.15%     2.1      52%     7.6%
Camcorders                   2             86     $62       $60       $30    3,246     121        3.73%     2.7     -71%     1.7%
General Terms                24            62     $476     $2,099     $87    82,236   1,055       1.28%     3.2      32%     1.9%
Microwaves                   35            31     $248     $1,503     $43    11,259    379        3.37%     4.3      82%     8.2%
Remote Controls              8             20     $42       $264      $33    1,533     120        7.83%      2       91%     5.8%
Microwave Filters            1             13      $2       $40       $40      38       4        10.53%     1.9    515%     25.0%
Televisions                  4             8      $25       $161      $40     718       54        7.52%     1.6      92%     9.3%
TV Remote Controls           5             8      $65       $245      $49    3,092     136        4.40%     4.9      13%     2.9%
Vacuums                      9             7      $32       $223      $25    1,488      73        4.91%     4.9    106%      8.2%
Adapters                     4             7      $45       $185      $46    1,161      89        7.67%     1.9      22%     4.5%
Appliances                   5             7      $58       $144      $29    3,709      92        2.48%     4.5     -25%     5.4%
Mic. Waveguide Covers        1             5       $1       $11       $11      14       2        14.29%     1.4    240%     50.0%
Fax Machines                 2             5       $3       $28       $14      67       5         7.46%     5.1    199%     20.0%
Electronics                  8             5      $103      $638      $80    6,811     166        2.44%     2.4      87%     3.6%
Camcorder Cables             1             2       $0       $92       $92      13       1         7.69%     2.3    7558%    100.0%


Vacuum Cleaners

   The vacuum category has been very efficient so far – performing well with few keywords. In fact,
   there are only seven total keywords associated with vacuums – four of which have recorded clicks.
   The sole keyword that’s converted (sharp vacuum parts, on broad match) has had an average
   position of just 5.2.

                              Match
                                                                      Avg             Avg      Orders     C-Rate   Orders
        Keyword                           Imprs   Clicks     CTR              Cost                                           Revenue
                                                                      CPC             Pos      (1-PC)     (1-PC)   (M-PC)
                                  Type
sharp vacuum parts                Broad    615     38       6.18%     0.37    $14     5.2        6      15.79%       9        $223
sharp vacuum cleaner              Broad    540     16       2.96%     0.42    $7      5.1        0      0.00%        0         $0
sharp vacuum cleaner parts        Broad    194     14       7.22%     0.55    $8      3.4        0      0.00%        0         $0
sharp canister vacuums            Broad    115     5        4.35%     0.81    $4      3.9        0      0.00%        0         $0


   Note: This source says Sharp is no longer releasing new vacuums but Sharp’s official website shows
   they’re still supporting at least a dozen models in the US. A full compliment of vacuum related
   keywords should be added including a focus on specific part categories such as bags, attachments,
   brushes, beaters, belts, cords, light bulbs, pedals, and hoses.


                                                                  7
Fax Machines

   Likewise, the fax machines ad group has generated two conversions on five clicks with low average
   position – moreover this was accomplished with just five total keywords in the ad group. A full
   compliment of fax machine related keywords should be added including a focus on specific part
   categories such as trays, laser units, transfer rollers, roller cassettes, fuser lamps, feed tires, drum
   units, ADF sensors, fuser assemblies, separator pads, slit glass, repair kits, power supplies, and
   toners (if we can be competitive in the toner market).

Aquos LCD TVs

   We have no keywords that include the word “aquos.” AQUOS is the series name of Sharp LCD
   televisions – probably Sharp’s most marketed product line in the last decade. As previously
   mentioned, Sharp’s market share of the North America LCD televisions is approximately 10%.
   Adding Aquos keywords across all applicable TV ad groups is a no-brainer and we may want to
   account for possible misspellings given the unusual name.

Insight Cooking Products

   Sharp makes an assortment of cooking appliances (microwave ovens, ranges, range hoods,
   standalone warming drawers, and unique cooktop+microwave drawers) that are sold under the
   Insight and Insight Pro series labels. Aside from microwaves and the relatively obscure drawer
   units, Sharp is not a strong player in the oven/range/cooktop market. Still, we have very few
   keywords for these products and none that incorporate the “insight” line. There is an opportunity for
   increased keyword coverage in this area.

SharpVision Projectors

   It’s not apparent how many projector lamp sales Sharp has generated through AdWords, but the
   answer is very few – As best as I can glean, since the 5/4 Phase 2 reorg, there has been less than 5
   total projector lamp sales generated from targeted keywords where the user has explicitly indicated
   they’re looking for a bulb or lamp. Sharp manufacturers both projection TVs (at least they have in
   the past) and home theater/multimedia projectors that require lamps. As a result, knowing the model
   categories isn’t obvious as many keywords are applicable to both categories. In any case, adding
   keywords that reference the “SharpVision” line of projection products can only help.

   A quick note about TV display technologies and their market share from a 2008 IEEE paper:

   “The Projection TV share is expected to be 1.3% for 2009, and it is expected to be 0.5% for 2010.”

   “…Flat-Panel TVs are expected to have 99% of the market share by 2010”

   “..the past king of TV display technologies, the CRT, is forecasted to have less than 1% market
   share by 2010.”


                                                     8
Air Conditioners

   Sharp is a small player in the US air conditioner market, but very much on the radar in this sizeable
   model category. Still, we have a paucity of air conditioner keywords (less than 10) and are missing
   some obvious ones like “sharp air conditioner parts.”

Business Copiers, Printers, Scanners (?)

   I’m not sure how well PartStore fares in these competitive categories, but we have very few
   keywords for these products that Sharp most certainly sells. I would recommend adding keywords
   and keeping a close eye on conversion rates and ROI. The two conversions for fax-machines
   suggest there may be more movement in these categories than we’d suspect.

Lowering Bids for Camcorders

   Sharp camcorders have been discontinued for 3 years and the ad group with general camcorder terms
   has not performed well. I would suggest lowering bids for such ad groups.


                                  General Recommendations
   Adding New Keywords
   I favor relying on the manufacturer’s website as the principal source to identify what model
   categories are being sold and then accordingly adding new ad groups and keywords (or enhancing
   existing ad groups with more keywords). The tricky part is knowing which model or part categories
   1) we don’t have good data or vendor coverage for OR 2) are not competitive from an SEM
   standpoint. Vendor Relations should be able to assist us with both issues. Of course keywords that
   fall into these categories would be excluded from the new keyword upload.

   For Sharp – In addition to the main site (www.sharpusa.com) – there’s a link off the Sharp Direct
   site that shows categories for parts and accessories which will be helpful to reference against:
   http://www.sharp-cart.com/ecom/accessories.htm

   Deleting Non-Performing Ad Groups
   Keywords for certain model categories were probably created en masse and are not really relevant
   for the brands they currently exist within. At some point, ad groups that get no impressions and
   seem illogical should just be deleted. If for no other reason, irrelevant keywords slow down account
   reports in Ad Words and unnecessary ad groups clutter the online interface.


                                                   9

More Related Content

Similar to Sharp SEM Analysis 2009

Yearly Achivement 2017
Yearly Achivement 2017Yearly Achivement 2017
Yearly Achivement 2017SuhariEte2
 
Analisis Horta Guinardo 2008 03 10
Analisis Horta Guinardo 2008 03 10Analisis Horta Guinardo 2008 03 10
Analisis Horta Guinardo 2008 03 101977bcn
 
Social growth 4.5
Social growth 4.5Social growth 4.5
Social growth 4.5salgiliberto
 
Reporte 09 2012[1]
Reporte 09 2012[1]Reporte 09 2012[1]
Reporte 09 2012[1]codigojunin2012
 
Yield factbook champions preview
Yield factbook champions   previewYield factbook champions   preview
Yield factbook champions previewDividend Yield
 
Dividend Weekly Stock52 2012 By Thanks to http://long-term-investments.blogsp...
Dividend Weekly Stock52 2012 By Thanks to http://long-term-investments.blogsp...Dividend Weekly Stock52 2012 By Thanks to http://long-term-investments.blogsp...
Dividend Weekly Stock52 2012 By Thanks to http://long-term-investments.blogsp...Dividend Yield
 
Recap des résultats 2010 sociétés cotées
Recap des résultats 2010 sociétés cotéesRecap des résultats 2010 sociétés cotées
Recap des résultats 2010 sociétés cotéesIDIR2001
 
Recap des sociétés cotées
Recap des sociétés cotéesRecap des sociétés cotées
Recap des sociétés cotéesIDIR2001
 
Profit analysis
Profit analysisProfit analysis
Profit analysisjolabs123
 
Retail analytics ASIA workshop_ New perspective on GfK retail analytics
Retail analytics ASIA workshop_ New perspective on GfK retail analyticsRetail analytics ASIA workshop_ New perspective on GfK retail analytics
Retail analytics ASIA workshop_ New perspective on GfK retail analyticsRichard Jo
 
Dividend weekly 03 2013
Dividend weekly 03 2013Dividend weekly 03 2013
Dividend weekly 03 2013Dividend Yield
 
Slide presentation 2 q09
Slide presentation 2 q09Slide presentation 2 q09
Slide presentation 2 q09Cia Hering RI
 
Nice PPT
Nice PPTNice PPT
Nice PPTvac2305
 
Indian Spectrum Auctions : Design Issues & Way Forward
Indian Spectrum Auctions : Design Issues & Way ForwardIndian Spectrum Auctions : Design Issues & Way Forward
Indian Spectrum Auctions : Design Issues & Way ForwardParag Kar
 
Synex Oppday Q3/55
Synex Oppday Q3/55 Synex Oppday Q3/55
Synex Oppday Q3/55 Shaen PD
 
Erin Parker Atvidcf V1
Erin Parker Atvidcf V1Erin Parker Atvidcf V1
Erin Parker Atvidcf V1Caneskid05
 
Dividend Weekly 45 2012 By http://long-term-investments.blogspot.com
Dividend Weekly 45 2012 By http://long-term-investments.blogspot.comDividend Weekly 45 2012 By http://long-term-investments.blogspot.com
Dividend Weekly 45 2012 By http://long-term-investments.blogspot.comDividend Yield
 

Similar to Sharp SEM Analysis 2009 (20)

ARM ROI Presentation
ARM ROI Presentation ARM ROI Presentation
ARM ROI Presentation
 
Yearly Achivement 2017
Yearly Achivement 2017Yearly Achivement 2017
Yearly Achivement 2017
 
Analisis Horta Guinardo 2008 03 10
Analisis Horta Guinardo 2008 03 10Analisis Horta Guinardo 2008 03 10
Analisis Horta Guinardo 2008 03 10
 
Social growth 4.5
Social growth 4.5Social growth 4.5
Social growth 4.5
 
Reporte 09 2012[1]
Reporte 09 2012[1]Reporte 09 2012[1]
Reporte 09 2012[1]
 
Yield factbook champions preview
Yield factbook champions   previewYield factbook champions   preview
Yield factbook champions preview
 
2q11
2q112q11
2q11
 
Dividend Weekly Stock52 2012 By Thanks to http://long-term-investments.blogsp...
Dividend Weekly Stock52 2012 By Thanks to http://long-term-investments.blogsp...Dividend Weekly Stock52 2012 By Thanks to http://long-term-investments.blogsp...
Dividend Weekly Stock52 2012 By Thanks to http://long-term-investments.blogsp...
 
Recap des résultats 2010 sociétés cotées
Recap des résultats 2010 sociétés cotéesRecap des résultats 2010 sociétés cotées
Recap des résultats 2010 sociétés cotées
 
Recap des sociétés cotées
Recap des sociétés cotéesRecap des sociétés cotées
Recap des sociétés cotées
 
Slide 1
Slide 1Slide 1
Slide 1
 
Profit analysis
Profit analysisProfit analysis
Profit analysis
 
Retail analytics ASIA workshop_ New perspective on GfK retail analytics
Retail analytics ASIA workshop_ New perspective on GfK retail analyticsRetail analytics ASIA workshop_ New perspective on GfK retail analytics
Retail analytics ASIA workshop_ New perspective on GfK retail analytics
 
Dividend weekly 03 2013
Dividend weekly 03 2013Dividend weekly 03 2013
Dividend weekly 03 2013
 
Slide presentation 2 q09
Slide presentation 2 q09Slide presentation 2 q09
Slide presentation 2 q09
 
Nice PPT
Nice PPTNice PPT
Nice PPT
 
Indian Spectrum Auctions : Design Issues & Way Forward
Indian Spectrum Auctions : Design Issues & Way ForwardIndian Spectrum Auctions : Design Issues & Way Forward
Indian Spectrum Auctions : Design Issues & Way Forward
 
Synex Oppday Q3/55
Synex Oppday Q3/55 Synex Oppday Q3/55
Synex Oppday Q3/55
 
Erin Parker Atvidcf V1
Erin Parker Atvidcf V1Erin Parker Atvidcf V1
Erin Parker Atvidcf V1
 
Dividend Weekly 45 2012 By http://long-term-investments.blogspot.com
Dividend Weekly 45 2012 By http://long-term-investments.blogspot.comDividend Weekly 45 2012 By http://long-term-investments.blogspot.com
Dividend Weekly 45 2012 By http://long-term-investments.blogspot.com
 

Sharp SEM Analysis 2009

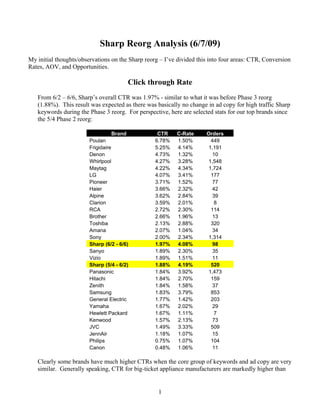
  • 1. Sharp Reorg Analysis (6/7/09) My initial thoughts/observations on the Sharp reorg – I’ve divided this into four areas: CTR, Conversion Rates, AOV, and Opportunities. Click through Rate From 6/2 – 6/6, Sharp’s overall CTR was 1.97% - similar to what it was before Phase 3 reorg (1.88%). This result was expected as there was basically no change in ad copy for high traffic Sharp keywords during the Phase 3 reorg. For perspective, here are selected stats for our top brands since the 5/4 Phase 2 reorg: Brand CTR C-Rate Orders Poulan 6.78% 1.50% 449 Frigidaire 5.25% 4.14% 1,191 Denon 4.73% 1.32% 10 Whirlpool 4.27% 3.28% 1,548 Maytag 4.22% 4.34% 1,724 LG 4.07% 3.41% 177 Pioneer 3.71% 1.52% 77 Haier 3.66% 2.32% 42 Alpine 3.62% 2.84% 39 Clarion 3.59% 2.01% 8 RCA 2.72% 2.30% 114 Brother 2.66% 1.96% 13 Toshiba 2.13% 2.88% 320 Amana 2.07% 1.04% 34 Sony 2.00% 2.34% 1,314 Sharp (6/2 - 6/6) 1.97% 4.08% 98 Sanyo 1.89% 2.30% 35 Vizio 1.89% 1.51% 11 Sharp (5/4 - 6/2) 1.88% 4.19% 520 Panasonic 1.84% 3.92% 1,473 Hitachi 1.84% 2.70% 159 Zenith 1.84% 1.58% 37 Samsung 1.83% 3.79% 853 General Electric 1.77% 1.42% 203 Yamaha 1.67% 2.02% 29 Hewlett Packard 1.67% 1.11% 7 Kenwood 1.57% 2.13% 73 JVC 1.49% 3.33% 509 JennAir 1.18% 1.07% 15 Philips 0.75% 1.07% 104 Canon 0.48% 1.06% 11 Clearly some brands have much higher CTRs when the core group of keywords and ad copy are very similar. Generally speaking, CTR for big-ticket appliance manufacturers are markedly higher than 1
  • 2. the CE and computer brands. I suspect the differences in CTR can be chalked up to a combination of: 1) High-traffic general keywords for the large CE brands generate lots of impressions but the ads are not relevant to what the user is looking for (hypothetical e.g. - we’ll show up for “sony” even though only 5% of users entering that are not looking for parts or accessories whereas 10% of users entering “maytag” are looking for parts) 2) People really need parts for appliances (rarely just browsing for accessories) 3) Appliance part shoppers might be more brand agnostic than CE/computer shoppers (brand meaning website in this case) To illustrate point #1 above, here are the top five keywords by impressions with select stats between 5/4 and 6/2 for four brands: Whirlpool, Maytag, Sony, and Sharp Avg Orders C-Rate Campaign Keyword Match Type Imprs Clicks CTR Pos (1-PC) (1-PC) Maytag maytag Broad 649,687 12,080 1.86% 3.8 333 2.76% Maytag maytag Exact 80,590 5,723 7.10% 1.9 289 5.05% Maytag maytag parts Broad 33,625 5,422 16.12% 2.4 241 4.44% Maytag maytag parts Exact 23,416 7,877 33.64% 1.4 470 5.97% Maytag maytag accessories Broad 15,446 653 4.23% 5.2 26 3.98% Maytag Top 5 802,764 31,755 3.96% 1,359 4.28% Sharp sharp Phrase 280,077 2,131 0.76% 3.7 38 1.78% Sharp sharp Exact 86,426 648 0.75% 1.2 28 4.32% Sharp sharp parts Broad 58,999 2,619 4.44% 2.9 70 2.67% Sharp sharp electronics Broad 42,663 602 1.41% 2.4 20 3.32% Sharp sharp microwave Broad 23,104 290 1.26% 4.7 11 3.79% Sharp Top 5 491,269 6,290 1.28% 167 2.66% Sony sony Exact 1,031,059 3,443 0.33% 1.8 114 3.31% Sony sony parts Broad 378,973 16,637 4.39% 3.3 265 1.59% Sony sony accessories Broad 202,208 4,240 2.10% 4 46 1.08% Sony sony.com Broad 181,691 5,188 2.86% 2.2 180 3.47% Sony Sony TV Parts Broad 75,974 2,680 3.53% 2.2 85 3.17% Sony Top 5 1,869,905 32,188 1.72% 690 2.14% Whirlpool whirlpool Broad 624,403 14,193 2.27% 4.7 279 1.97% Whirlpool whirlpool parts Broad 140,296 8,656 6.17% 5.5 252 2.91% Whirlpool whirlpool Exact 128,442 6,300 4.90% 2.5 266 4.22% Whirlpool whirlpool parts Exact 26,150 9,914 37.91% 1.1 468 4.72% Whirlpool whirlpool dishwasher Broad 22,816 208 0.91% 6.7 9 4.33% Whirlpool Top 5 942,107 39,271 4.17% 1,274 3.24% The performance of the top five keywords tells the CTR story in a nutshell– the high traffic keywords (notably the generic, non-targeted, containing just-the-brand keywords) for certain brands do generate sales, but the ads are simply not clicked on as often. The word “sharp” is already ambiguous and a common adjective which doesn’t help our efforts. 2
  • 3. For an apples to apples comparison, here are select stats for exact searches for the same type of keyword: Avg Orders C-Rate Campaign Keyword Match Type Imprs Clicks CTR Pos (1-PC) (1-PC) Maytag maytag parts Exact 23,416 7,877 33.64% 1.4 470 5.97% Sharp sharp parts Exact 774 189 24.42% 1 10 5.29% Sony sony parts Exact 3,701 1,173 31.69% 1 54 4.60% Whirlpool whirlpool parts Exact 26,150 9,914 37.91% 1.1 468 4.72% Not surprisingly, we do much better with CTR (and conversion rates) for targeted searches when a user is indicating they want parts. Applying more negative keywords may improve CTR for brands such as Sharp but it still may be difficult to significantly boost CTR without jeopardizing orders and revenue – it could be a reality we have to live with. However, one benefit of the reorg is that we can see how CTR varies within brands across different model and part categories. This analysis is limited by the lack of accumulated date in the Phase 3 reorg, but here’s a snapshot of selected stats for Sharp ad groups with at least 500 impressions, sorted by CTR. Avg Avg Orders C-Rate Orders Ad Group Imprs Clicks CTR Cost Revenue ROI CPC Pos (1-PC) (1-PC) (M-PC) Remote Controls 1,533 120 7.83% $0.35 $42 2 7 5.83% 8 $264 91% Adapters 1,161 89 7.67% $0.51 $45 1.9 4 4.49% 4 $185 22% TV Remote Controls 718 54 7.52% $0.47 $25 1.6 5 9.26% 5 $245 192% Microwave Trays 741 53 7.15% $0.60 $32 2.1 4 7.55% 4 $161 52% Vacuums 1,488 73 4.91% $0.44 $32 4.9 6 8.22% 9 $223 106% Televisions 3,092 136 4.40% $0.48 $65 4.9 4 2.94% 4 $161 -26% Camcorders 3,246 121 3.73% $0.52 $62 2.7 2 1.65% 2 $60 -71% Microwaves 11,259 379 3.37% $0.65 $248 4.3 31 8.18% 35 $1,503 82% Appliances 3,709 92 2.48% $0.63 $58 4.5 5 5.43% 5 $144 -25% Electronics 6,811 166 2.44% $0.62 $103 2.4 6 3.61% 8 $638 87% General Terms 82,236 1,055 1.28% $0.45 $476 3.2 20 1.90% 24 $2,099 32% Projectors 743 6 0.81% $1.25 $7 6 0 0.00% 0 $0 -100% Lamps 4,706 22 0.47% $0.90 $20 3.3 0 0.00% 0 $0 -100% In this context, we can see again how the performance of general terms drags down the CTR for the whole brand. Note that the ROI for general terms indicates it’s still a cost effective ad group. 3
  • 4. Conversion Rate From 6/2 – 6/6, Sharp’s overall conversion rate was 4.08% - similar to what it was before the Phase 3 reorg (4.19%). This result was also expected since virtually all high traffic Sharp keywords were already directed to winning landing pages prior to Phase 3. Once again, the chart from the first page: Brand CTR C-Rate Orders Maytag 4.22% 4.34% 1,724 Sharp (5/4 - 6/2) 1.88% 4.19% 520 Frigidaire 5.25% 4.14% 1,191 Sharp (6/2 - 6/6) 1.97% 4.08% 98 Panasonic 1.84% 3.92% 1,473 Samsung 1.83% 3.79% 853 LG 4.07% 3.41% 177 JVC 1.49% 3.33% 509 Whirlpool 4.27% 3.28% 1,548 Toshiba 2.13% 2.88% 320 Alpine 3.62% 2.84% 39 Hitachi 1.84% 2.70% 159 Sony 2.00% 2.34% 1,314 Haier 3.66% 2.32% 42 RCA 2.72% 2.30% 114 Sanyo 1.89% 2.30% 35 Kenwood 1.57% 2.13% 73 Yamaha 1.67% 2.02% 29 Clarion 3.59% 2.01% 8 Brother 2.66% 1.96% 13 Zenith 1.84% 1.58% 37 Pioneer 3.71% 1.52% 77 Vizio 1.89% 1.51% 11 Poulan 6.78% 1.50% 449 General Electric 1.77% 1.42% 203 Denon 4.73% 1.32% 10 Hewlett Packard 1.67% 1.11% 7 JennAir 1.18% 1.07% 15 Philips 0.75% 1.07% 104 Canon 0.48% 1.06% 11 Amana 2.07% 1.04% 34 Sharp has one of the higher conversion rates compared to other brands. One likely reason is that the Sharp keywords we aggressively compete for via SEM are remote controls and microwave parts – strong categories for PartStore. (Note: According to ConsumerReports, Sharp is the number 2 microwave brand in the US, behind GE). Sharp may also be a brand with better data and/or robust vendor coverage which would help account for the high conversion rates. This will be more evident as the Phase 3 reorg is rolled out across the Brand 1 account and comparing ad groups is possible. 4
  • 5. Ad groups with at least 500 impressions sorted by C-Rate: Avg Avg Orders C-Rate Orders Ad Group Imprs Clicks CTR Cost Revenue ROI CPC Pos (1-PC) (1-PC) (M-PC) TV Remote Controls 718 54 7.52% $0.47 $25 1.6 5 9.26% 5 $245 192% Vacuums 1,488 73 4.91% $0.44 $32 4.9 6 8.22% 9 $223 106% Microwaves 11,259 379 3.37% $0.65 $248 4.3 31 8.18% 35 $1,503 82% Microwave Trays 741 53 7.15% $0.60 $32 2.1 4 7.55% 4 $161 52% Remote Controls 1,533 120 7.83% $0.35 $42 2 7 5.83% 8 $264 91% Appliances 3,709 92 2.48% $0.63 $58 4.5 5 5.43% 5 $144 -25% Adapters 1,161 89 7.67% $0.51 $45 1.9 4 4.49% 4 $185 22% Electronics 6,811 166 2.44% $0.62 $103 2.4 6 3.61% 8 $638 87% Televisions 3,092 136 4.40% $0.48 $65 4.9 4 2.94% 4 $161 -26% General Terms 82,236 1,055 1.28% $0.45 $476 3.2 20 1.90% 24 $2,099 32% Camcorders 3,246 121 3.73% $0.52 $62 2.7 2 1.65% 2 $60 -71% Projectors 743 6 0.81% $1.25 $7 6 0 0.00% 0 $0 -100% Lamps 4,706 22 0.47% $0.90 $20 3.3 0 0.00% 0 $0 -100% Most the ad groups with sizeable traffic have very respectable conversion rates. General terms, as we’d expect, have lower conversion rates. There’s really not enough data to make any conclusions about projectors and lamps at this point. Televisions and camcorders appear to be underperforming. FYI: • Sharp’s North America LCD market share was 9.4% in Q1 2009. Source • Sharp doesn’t sell new camcorders as of March 2006 - Source - so it’s probably not surprising this is a dying category. Note: Camcorder technology evolves quickly these days (recording formats become obsolete) so there may be less of an incentive to fix an old camcorder compared to other CE categories. 5
  • 6. AOV Phase 3 of the reorg will also shed light on AOV. Of course we were always able to calculate AOV based on how parts are categorized and classified in our system, but it may be illuminating to see how AOV shakes down by ad group now that like terms are more grouped together. AOV for all ad groups that have recorded at least one order (6/2 – 6/6): Total Ad Group Revenue AOV Orders Camcorder Cables 1 $92 $92 General Terms 24 $2,099 $87 Electronics 8 $638 $80 TV Remote Controls 5 $245 $49 Adapters 4 $185 $46 Microwaves 35 $1,503 $43 Microwave Trays 4 $161 $40 Televisions 4 $161 $40 Microwave Filters 1 $40 $40 Part Numbers 1 $36 $36 Remote Controls 8 $264 $33 Camcorders 2 $60 $30 Appliances 5 $144 $29 Vacuums 9 $223 $25 Fax Machines 2 $28 $14 Microwave Waveguide Covers 1 $11 $11 Notes & Observations • “Electronics” and “Appliances” are general vertical terms like “sharp electronics parts” or “sharp appliances.” • “Remote Controls” are non model-category specific terms like “sharp remote control,” so the user was not necessarily looking for a television remote. • “Microwaves” are general microwave terms - it’s probably safe to assume that many of these orders were microwave trays based on the similar AOVs. • “Part Numbers” are keywords with the brand+part number that existed in an ad group in the old structure. • No idea what camcorder cable would cost so much (it’s possible the user ultimately bought something else). 6
  • 7. Opportunities Opportunities to improve the performance of the Sharp campaign are apparent after just five days since the reorg. The ad groups identified in yellow highlight should probably be buttressed with more keywords if possible – They’ve converted on relatively few keywords thus far with a positive ROI: Total Total Avg C-Rate Ad Group Cost Rev AOV Imprs Clicks CTR ROI Orders Keywords Pos (1-PC) Part Numbers 1 293 $0 $36 $36 175 1 0.57% 2.7 5900% 100.0% Microwave Trays 4 186 $32 $161 $40 741 53 7.15% 2.1 52% 7.6% Camcorders 2 86 $62 $60 $30 3,246 121 3.73% 2.7 -71% 1.7% General Terms 24 62 $476 $2,099 $87 82,236 1,055 1.28% 3.2 32% 1.9% Microwaves 35 31 $248 $1,503 $43 11,259 379 3.37% 4.3 82% 8.2% Remote Controls 8 20 $42 $264 $33 1,533 120 7.83% 2 91% 5.8% Microwave Filters 1 13 $2 $40 $40 38 4 10.53% 1.9 515% 25.0% Televisions 4 8 $25 $161 $40 718 54 7.52% 1.6 92% 9.3% TV Remote Controls 5 8 $65 $245 $49 3,092 136 4.40% 4.9 13% 2.9% Vacuums 9 7 $32 $223 $25 1,488 73 4.91% 4.9 106% 8.2% Adapters 4 7 $45 $185 $46 1,161 89 7.67% 1.9 22% 4.5% Appliances 5 7 $58 $144 $29 3,709 92 2.48% 4.5 -25% 5.4% Mic. Waveguide Covers 1 5 $1 $11 $11 14 2 14.29% 1.4 240% 50.0% Fax Machines 2 5 $3 $28 $14 67 5 7.46% 5.1 199% 20.0% Electronics 8 5 $103 $638 $80 6,811 166 2.44% 2.4 87% 3.6% Camcorder Cables 1 2 $0 $92 $92 13 1 7.69% 2.3 7558% 100.0% Vacuum Cleaners The vacuum category has been very efficient so far – performing well with few keywords. In fact, there are only seven total keywords associated with vacuums – four of which have recorded clicks. The sole keyword that’s converted (sharp vacuum parts, on broad match) has had an average position of just 5.2. Match Avg Avg Orders C-Rate Orders Keyword Imprs Clicks CTR Cost Revenue CPC Pos (1-PC) (1-PC) (M-PC) Type sharp vacuum parts Broad 615 38 6.18% 0.37 $14 5.2 6 15.79% 9 $223 sharp vacuum cleaner Broad 540 16 2.96% 0.42 $7 5.1 0 0.00% 0 $0 sharp vacuum cleaner parts Broad 194 14 7.22% 0.55 $8 3.4 0 0.00% 0 $0 sharp canister vacuums Broad 115 5 4.35% 0.81 $4 3.9 0 0.00% 0 $0 Note: This source says Sharp is no longer releasing new vacuums but Sharp’s official website shows they’re still supporting at least a dozen models in the US. A full compliment of vacuum related keywords should be added including a focus on specific part categories such as bags, attachments, brushes, beaters, belts, cords, light bulbs, pedals, and hoses. 7
  • 8. Fax Machines Likewise, the fax machines ad group has generated two conversions on five clicks with low average position – moreover this was accomplished with just five total keywords in the ad group. A full compliment of fax machine related keywords should be added including a focus on specific part categories such as trays, laser units, transfer rollers, roller cassettes, fuser lamps, feed tires, drum units, ADF sensors, fuser assemblies, separator pads, slit glass, repair kits, power supplies, and toners (if we can be competitive in the toner market). Aquos LCD TVs We have no keywords that include the word “aquos.” AQUOS is the series name of Sharp LCD televisions – probably Sharp’s most marketed product line in the last decade. As previously mentioned, Sharp’s market share of the North America LCD televisions is approximately 10%. Adding Aquos keywords across all applicable TV ad groups is a no-brainer and we may want to account for possible misspellings given the unusual name. Insight Cooking Products Sharp makes an assortment of cooking appliances (microwave ovens, ranges, range hoods, standalone warming drawers, and unique cooktop+microwave drawers) that are sold under the Insight and Insight Pro series labels. Aside from microwaves and the relatively obscure drawer units, Sharp is not a strong player in the oven/range/cooktop market. Still, we have very few keywords for these products and none that incorporate the “insight” line. There is an opportunity for increased keyword coverage in this area. SharpVision Projectors It’s not apparent how many projector lamp sales Sharp has generated through AdWords, but the answer is very few – As best as I can glean, since the 5/4 Phase 2 reorg, there has been less than 5 total projector lamp sales generated from targeted keywords where the user has explicitly indicated they’re looking for a bulb or lamp. Sharp manufacturers both projection TVs (at least they have in the past) and home theater/multimedia projectors that require lamps. As a result, knowing the model categories isn’t obvious as many keywords are applicable to both categories. In any case, adding keywords that reference the “SharpVision” line of projection products can only help. A quick note about TV display technologies and their market share from a 2008 IEEE paper: “The Projection TV share is expected to be 1.3% for 2009, and it is expected to be 0.5% for 2010.” “…Flat-Panel TVs are expected to have 99% of the market share by 2010” “..the past king of TV display technologies, the CRT, is forecasted to have less than 1% market share by 2010.” 8
  • 9. Air Conditioners Sharp is a small player in the US air conditioner market, but very much on the radar in this sizeable model category. Still, we have a paucity of air conditioner keywords (less than 10) and are missing some obvious ones like “sharp air conditioner parts.” Business Copiers, Printers, Scanners (?) I’m not sure how well PartStore fares in these competitive categories, but we have very few keywords for these products that Sharp most certainly sells. I would recommend adding keywords and keeping a close eye on conversion rates and ROI. The two conversions for fax-machines suggest there may be more movement in these categories than we’d suspect. Lowering Bids for Camcorders Sharp camcorders have been discontinued for 3 years and the ad group with general camcorder terms has not performed well. I would suggest lowering bids for such ad groups. General Recommendations Adding New Keywords I favor relying on the manufacturer’s website as the principal source to identify what model categories are being sold and then accordingly adding new ad groups and keywords (or enhancing existing ad groups with more keywords). The tricky part is knowing which model or part categories 1) we don’t have good data or vendor coverage for OR 2) are not competitive from an SEM standpoint. Vendor Relations should be able to assist us with both issues. Of course keywords that fall into these categories would be excluded from the new keyword upload. For Sharp – In addition to the main site (www.sharpusa.com) – there’s a link off the Sharp Direct site that shows categories for parts and accessories which will be helpful to reference against: http://www.sharp-cart.com/ecom/accessories.htm Deleting Non-Performing Ad Groups Keywords for certain model categories were probably created en masse and are not really relevant for the brands they currently exist within. At some point, ad groups that get no impressions and seem illogical should just be deleted. If for no other reason, irrelevant keywords slow down account reports in Ad Words and unnecessary ad groups clutter the online interface. 9
  • 10. Air Conditioners Sharp is a small player in the US air conditioner market, but very much on the radar in this sizeable model category. Still, we have a paucity of air conditioner keywords (less than 10) and are missing some obvious ones like “sharp air conditioner parts.” Business Copiers, Printers, Scanners (?) I’m not sure how well PartStore fares in these competitive categories, but we have very few keywords for these products that Sharp most certainly sells. I would recommend adding keywords and keeping a close eye on conversion rates and ROI. The two conversions for fax-machines suggest there may be more movement in these categories than we’d suspect. Lowering Bids for Camcorders Sharp camcorders have been discontinued for 3 years and the ad group with general camcorder terms has not performed well. I would suggest lowering bids for such ad groups. General Recommendations Adding New Keywords I favor relying on the manufacturer’s website as the principal source to identify what model categories are being sold and then accordingly adding new ad groups and keywords (or enhancing existing ad groups with more keywords). The tricky part is knowing which model or part categories 1) we don’t have good data or vendor coverage for OR 2) are not competitive from an SEM standpoint. Vendor Relations should be able to assist us with both issues. Of course keywords that fall into these categories would be excluded from the new keyword upload. For Sharp – In addition to the main site (www.sharpusa.com) – there’s a link off the Sharp Direct site that shows categories for parts and accessories which will be helpful to reference against: http://www.sharp-cart.com/ecom/accessories.htm Deleting Non-Performing Ad Groups Keywords for certain model categories were probably created en masse and are not really relevant for the brands they currently exist within. At some point, ad groups that get no impressions and seem illogical should just be deleted. If for no other reason, irrelevant keywords slow down account reports in Ad Words and unnecessary ad groups clutter the online interface. 9