
Recommended
More Related Content
What's hot
What's hot (18)
Similar to Fertilizer global market briefing 2018
Similar to Fertilizer global market briefing 2018 (20)
Recently uploaded
Recently uploaded (20)
Fertilizer global market briefing 2018
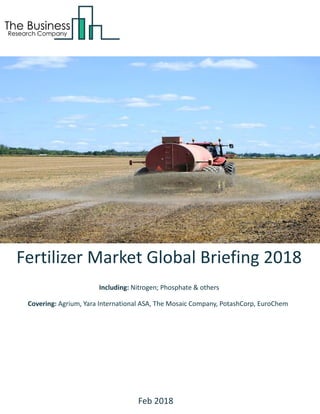
- 1. Fertilizer Market Global Briefing 2018 Including: Nitrogen; Phosphate & others Covering: Agrium, Yara International ASA, The Mosaic Company, PotashCorp, EuroChem Feb 2018
- 2. Reasons to Purchase • Get up to date information available on the market globally. • Identify growth segments and opportunities. • Facilitate decision making on the basis of historic (2013-17) and forecast (2017-21) data and understand the drivers and restraints on the market. • Develop strategies based on likely future developments. • Gain a global perspective on the development of the market. Markets Covered: Nitrogen; Phosphates; Other Fertilizers Companies Mentioned: Agrium, Yara International ASA, The Mosaic Company, PotashCorp, EuroChem Countries: Brazil, China, France, Germany, India, Italy, Japan, Spain, Russia, UK, USA and Australia. Regions: Asia-Pacific, Western Europe, Eastern Europe, North America, South America, Middle East And Africa Time series: Five years historic (2013-17) and forecast (2017-21). Data: Market value in $ billions. Data segmentations: Regional breakdowns, market share of competitors, key sub segments. Sourcing and Referencing: Data and analysis throughout the report is sourced using end notes. Scope
- 3. Fertilizer Market Characteristics A fertilizer is any material of natural or synthetic origin that is applied to soils or to plants to supply one or more plant nutrients essential to the growth of plants. Fertilizers market in this report is segmented into nitrogen, phosphate and other fertilizers manufacturing. · Nitrogen Manufacturing – Nitrogen fertilizer manufacturers primarily make nitrogenous fertilizer materials and · Phosphate Fertilizer Manufacturing – Phosphate fertilizer manufacturers primarily manufacture phosphatic fertilizer materials and · Fertilizers (Mixing Only) Manufacturing – Fertilizes manufacturers primarily mix ingredients from In this report market value is defined as the revenues organizations earn by selling their goods and services within the specified market, based on the price at which they sell. Only goods and services traded between entities are included. The revenues for a specified geography are consumption values – that is, they are revenues generated by organizations in the specified geography within the specified market, irrespective of where they are produced.
- 4. Fertilizer Market Historic Growth The global fertilizer market grew from $X billion in 2013 to $X billion in 2017 at a compound annual growth rate (CAGR) of X%. The chart and table below shows the year-on-year growth of the global fertilizer market during 2013 – 2017. Drivers of the Market: Restraints on the Market:
- 5. Fertilizer Market Forecast Growth The global fertilizer market is expected to grow from $XX billion in 2017 to $412 billion in 2021 at a compound annual growth rate (CAGR) of XX%. The chart and table below shows the year-on-year growth of the global fertilizer market during 2017 - 2021. Drivers of the Market: Restraints on the Market:
- 6. Fertilizer Market Segmentation The chart and table below shows the split of the fertilizer market in 2017. The total market value for fertilizer was $X billion in 2017. The markets that are covered include Nitrogen, Phosphates and Other Fertilizers. Nitrogen was the X largest segment in the fertilizer market with X% share of the market. The market value for the nitrogen was $X billion in 2017. Phosphate made up around X% share of the market. The market value for the phosphate was $X billion in 2017.
- 7. Fertilizer Market Regional And Country Analysis The Asia Pacific was the largest region in the fertilizer market in 2017, fertilizer for $X billion or X% market share. North America was the X largest region fertilizer for $X billion or X% market share. Western Europe was the X largest region fertilizer for $X billion or X% market share.
- 8. Fertilizer Market Competitive Landscape The leading competitors in the global fertilizer market are Agrium, Yara International ASA, The Mosaic Company, PotashCorp and EuroChem. The chart and table below displays the percentage market share of the top players in the fertilizer market industry. Yara International Asa generated revenues of $XX billion for the financial year 2016, an XX% decrease from the previous year. The Mosaic Company generated revenues of $XX billion for the financial year 2016, an XX% decrease from the previous year. Potash Corp. Of Saskatchewan Inc. generated revenues of $XX billion for the financial year 2016, an XX% decrease from the previous year.
- 9. Eurochem Inc. generated revenues of $XX billion for the financial year 2016, an XX% decrease from the previous year. Agrium Inc. generated revenues of $XX billion for the financial year 2016, an XX% decrease from the previous year. CF Industries Holdings Inc. generated revenues of $XX billion for the financial year 2016, an XX% decrease from the previous year. Coromandel International Ltd. generated revenues of $XX billion for the financial year 2016, an XX% decrease from the previous year. Israel Chemicals Ltd. generated revenues of $XX billion for the financial year 2016, an XX% decrease from the previous year. Sinofert Holdings Ltd. generated revenues of $XX billion for the financial year 2016, an XX% decrease from the previous year. Uralkali generated revenues of $XX billion for the financial year 2016, an XX% decrease from the previous year. Company Profile Agrium Overview Yara International was the largest company in the fertilizer market with a XX% share of the market. The company is involved in the production of nitrogen fertilizer, dry ice, nitrates, ammonia, urea and other nitrogen based chemicals. Yara international was founded in 1905 and is headquartered in Oslo, Norway.
- 10. Products and Services The company operates through the following segments The Downstream segment is involved in the sale, marketing and distribution of a The Industrial segment develops and markets environmental solutions and The Upstream segment is involved in the production of ammonia, nitrates The Supply and Trade segment is involved in the procurement of raw materials, handles ammonia trade and Strategy Yara international’s growth strategy is to expand its operations through acquisitions, expansions and reconfigurations at existing sites, and potential greenfield project. In August 2016, Yara International acquired Tata Chemicals’ urea business in India for $400 million as part of the company’s growth strategy. Financial Performance Yara international had revenues of NOK XX billion for the financial year 2016, an XX% decrease from the previous year. The company had a market Yara International ASA Overview Products and Services Strategy Financial Performance The Mosaic Company Overview Products and Services Strategy Financial Performance
- 11. PotashCorp Overview Products and Services Strategy Financial Performance EuroChem Overview Products and Services Strategy Financial Performance