SlideShare a Scribd company logo
1 of 61
4
Running Head: WEEK 2 TEAM ASSIGNMENT
Business Research Project Part 1
Learning Team A
Ly Bui, Tammy del Campo, La Shawn Herron-Guy, Claudia
Hernandez, Janice Jenkins,
Natasha O’Keefe
QNT/561
April 11, 2016
Matthew Radio
Flexnet
Introduction
The consumer product rental industry continues to grow and
improve services beyond video stores, “Flexnet steers couch
potatoes away from the video store to the mailbox or
Internet. The company's more than 57 million subscribers in 50
countries can download movies or rent DVDs for a monthly fee
through Flexnet.com” (Hoovers (2016) (para. 1). As the era
changes, instead of DVD rental, the focus is on the fast-growing
streaming service.
Organizational Dilemma
Flexnet seems to be successful with strong financial
performance. However, Flexnet has faced pricing dilemmas.
Many subscribers, investors questioned if Flexnet can develop a
competitive market. With a need for a renewal its license,
content, and agreements frequently; Flexnet is under pressure to
reduce the prices with hiked licensing fees. Amazon Prime and
Hulu are one of the main competitors of Flexnet, who stream
their contents. Customers expect to get high-quality products at
reasonable price. “…Management needs to find the best method
to solve these dilemmas” (Business Insider, 2011).
Variables Based on Business Dilemma
Flexnet premium channel choose a survey to solicit scaled and
closed-end responses by customers to determine interest in
proposed streaming capabilities. Using the Internet via
Facebook and Google AdWords to find respondents, the team
commissioned an exploratory study to measure subscription
interest in premium channels through Flexnet (independent
variable), price structure (dependent variable) and premium
channel offering possibilities (dependent variable).
The design of the survey questions is causal — designed to
determine if an asymmetrical relationship exists between the
likelihood of customers’ subscription, channels offered, and
monthly fee the client is willing to pay. The method of data
collection employed was to collect responses from a sample of
convenience from current customers who are on the internet.
Whereas the reliability and validity provide challenges in
evaluating, the independent status of Team A in the survey
mitigates any perceived bias in the study.
Research Objective
Flexnet has determined the need to raise prices by 12.5 %
= $1.00 or 25 % = $2.00 increases in the near future; it is
important to provide data and research behind what impact this
might have for current and new subscribers. Several important
factors to consider when thinking of the price increase decisions
are:
1. Flexnet’s costs
2. Flexnet profits
3. Market demand
4. Industry standards
5. Business Strategy
6. What experiences and service is wanted for the subscribers?
7. Customer expectations
Flexnet has decided a survey would be the best possibility to
obtain the data needed to make decisions.
A few questions in Flexnet mind are for the survey could be:
· Will current subscribers cancel?
· What would be the cancellation impact?
· Could there be something done to extend the current
subscribers to be affected? (example: delay their subscription
cost for a year or two years)
· Will new subscribers enroll?
· What would be your source of streaming if you cancel?
Research Question and Sample
Flexnet has delved into their subscriber's wants and needs and
has invested in surveys as a platform to gauge their customer's
satisfaction as well as their interest in competition, which come
from premium channels such as; HBO, Starz, Cinemax, and
other channels offering well-known movies and shows. The
results of these surveys is as follows;
Regarding satisfaction, the measurement included topics of
streaming, DVDs, and overall experience. According to aytm,
Flexnet is meeting the needs of their subscribers, “…it’s not
surprising that 74.4% of Flexnet users said they are satisfied
with their overall experience, and only 9.1% said they are
unsatisfied” (Pilon, 2011).
Conclusion
The question of their likeness to Flexnet to that of
competing premium channels was raised;
The way people are choosing to watch their preferred
programs and choice of movies is ever changing, as of now,
Flexnet continues to reach out to their subscribers to ensure
their needs and wants are being met.
Conclusion
Flexnet has continued to evolve and though they
have increased their streaming, they do still offer three different
packages to their subscribers for DVDs. This is an area they
continue to survey. The question of whether or not this will
continue to be a part of the company is something looked at
often.
References
Business Insider. (2011). Flexnet's Big Licensing
Dilemma. Retrieved from /
http://www.businessinsider.com/Flexnets-big-licensing-
dilemma-2011-7
GOTTFRIED, M. (2015). The Flexnet Problem: Which Media
Company Will Solve / It? Retrieved from
http://www.wsj.com/articles/the-Flexnet-problem-which-media-/
company-will-solve-it-1447609351
Hoover's. (2016). Retrieved from
http://www.hoovers.com/company-information/cs/company-/
profile.Flexnet_Inc.f336f5bc15a31a6c.htm
Pilon, A. (2011). aytm. Retrieved from
https://aytm.com/blog/daily-survey-results/Flexnet-survey-
subscribers-happy-with-overall-experience/
Measurement of Satisfaction
Results Satisfied with Streaming Unsatisfied with streaming
Satisfied with variety on DVD Unsatisfied with variety on
DVDSatisfied with overall experience Unsatisfied with
overall experience 0.65 0.31 0.71 0.08 0.74 0.09
As a Flexnet subscriber, how likely would you subscribe to
premium channels (like HBO, Showtime, Starz, Cinemax) over
Netflix?
Percent Very Likely Somewhat Likely Uncertain
Somewhat Unlikely Very unlikely 0.3 0.21 0.12 0.08
0.28999999999999998
1
Running Head: WEEK 3 TEAM ASSIGNMENT
Flexnet
The consumer product rental industry continues to grow
and improve services beyond video stores. “Flexnet steers couch
potatoes away from the video store to the mailbox or Internet.
The company's more than 57 million subscribers in 50 countries
can download movies or rent DVDs for a monthly fee through
Flexnet.com” (Hoovers (2016) (para. 1). As the era changes,
instead of DVD rental, Flexnet is focusing on its fast-growing
overseas streaming service.
A Brief History
Flexnet was established 18 years ago on August 29, 1997.
Its original premise was to offer America the convenience of
having your movie rentals mailed to you vs. having to go to the
rental store. In 2007, Flexnet introduced streaming to its line of
services offered. Both services are provided with the business
model of no late fees, a flat rate, and unlimited rentals or
streaming. In 2013, flex net received some negative reviews on
their streaming content. To the customers, it seemed that if you
wanted to get the newest content the best way would be to get
the DVD. Flexnet responded to the complaints by
acknowledging the issue and stating quite frankly that it’s
economical to get the rights to DVDs than to the stream. They
also said that the way they choose what will be renewed or
added is based on how many streams a movie or show gets. In
the coming years with the popularity of streaming devices like
Apple TV, Roku, and Amazon Fire and the use of applications
for streaming Flexnet has had an increasing battle to stay
competitive with content offered and prices charged.
Dilemma that the Organization Might Face
From the outside, Flexnet seems to be a successful
company with strong financial performance. However, Flexnet
has faced with pricing and licensing dilemmas. Many
subscribers and investors questioned if the company can
continue keeping its lead on video rental and streaming
services. Flexnet has to renew its license, content, and
agreements frequently. Due to the hiking renewal cost, Flexnet
has to pay much higher than what they paid in previous years.
The company is under pressure to increase the service fee
without losing the established customers. If the company does
not want to pay high licensing fees, it will lose many
subscribers. Amazon Prime and Hulu are one of the main
competitors of Flexnet, have the right to stream their contents.
Nye (2011), “This leads up to Flexnet’s other biggest obstacle:
distribution. The debate is no longer between DVDs and
streaming, and the question is now who will offer the best
platform from which to distribute the most desirable content”
(para. 10). Customers always expect to get high-quality
products at reasonable price. The management of Flexnet needs
to do some researches to find the best method for solving these
dilemmas. Nye (2011), “The company is feeling the pressure
from consumers over the price hikes, but without the price
hikes, how will it pay increased licensing fees? If it loses
licensing contracts, will consumers stick around for limited
available content?” (para. 13).
Research Questions
What does Flexnet need to do to survive with high
licensing fees and with strong competitors like, Hulu and
Amazon Prime?
Will Flexnet be increasing monthly premiums to
subscribers within a year; due to the increased cost of
licensing?
What evidence (data/measures) of impact was there in the
past with increases?
Flexnet is in a dilemma, decisions surrounding cost
increases for their current and new subscribers might affect
their overall subscriptions. The need to enhance is due to
increases in the licensing to obtain the licenses for the movies.
The customers expect excellent service for a great cost, but
would this still be the case if we increase the costs by 25%?
Decisions surrounding this dilemma will be when the increase
takes effect and at what point are the current subscribers
affected and when will the new customers receive the impact of
the new costs for the monthly premium.
Research Plan
With the onset of the internet, Flexnet has seen a
considerable amount of pressure because not only are their
clients opting to stream movies, but also the rise of potential
competitors. Flexnet is seeing a grand change in the industry
because, a few years ago, they enjoyed monopoly and their large
stack of movie libraries is what gained them subscribers in the
first place. Combined with manageable licensing rates that
could be paid for by the customer’s subscriptions, Flexnet was
untouchable. The real concern now is what happens when the
licensing rates go up, and their competitors have cheaper ways
to deliver the movies (Schneider, 2015). Flexnet could look into
expanding into international markets, can take advantage of the
public markets and look to make some extra money through the
use of smart media acquisitions. Finally, they should look to
form mergers and completely redesign their rigid business
model to accompany the modern day trends.
This challenge requires that Flexnet associates itself with a
network with an active media conglomerate so they can invest
in innovations and explore new things. The international market
is a mine field, and since they were able to tap into the
American market, using even better techniques, they could
source for revenue from other countries which would go a long
way in reducing the burden of costs (Gina, 2012). Second,
merging with an already established company and one with a
flexible business model will save Flexnet the costs they would
incur to redefine their business totally at the expense of a small
stake into the company. The acquisitions of smart media can
help Flexnet look into the blueprints of other successful media
conglomerates where they can learn about the strengths and
weaknesses while comparing to their own to promote growth
and adaptation.
Creating a network will increase the self-worth of Flexnet
and thus even more reduced rates for their clients because they
will have already established an even larger market pool than
they have right now.
Appendix
Flexnet Broke the Rules and Won
Research how the DVD rental company succeeded in a tough
marketplace.
Besides the online movies and TV shows, Flexnet invested in
the video rental market with an incredible result. With this new
business model, customers only need to pay a fixed monthly fee,
make a list of future video rentals, order those videos online,
and extend the rent without late charges. Customers have
enjoyed all the best offers from Flexnet’s new rental business.
Customers’ wish lists have created a significant advantage for
Flexnet to understand what kind of movies that the clients are
expecting. Flexnet has tried to carry all movies to meet
customers’ demands. The company should stock many movies
that can ship to customers immediately. The company needs to
create a deadline to encourage all customers return the videos
by their due dates and create a rule that the clients need to
return the old videos before they can rent the new ones. This
rule helped Flexnet on reducing the number of stocking movie
copies. Removing deadlines balance the supply and demand,
creates a comfortable condition and environment for satisfying
customers’ needs and controls their costs effectively. Flexnet
does not have to stock all movies (Snyder, 2010).
Flexnet – the One True Entertainment Disrupter?
Online video streaming service becomes successful
because customers can switch using cable and satellite to the
streaming service. How Flexnet can continue keeping the
leading position in a competitive video rental and streaming
services with Hulu and Amazon Prime. Customers believe that
Flexnet will beat other companies because Hulu customers got
annoyance by their routine commercials, and Amazon Prime
Instant Video is not differentiated from Amazon Prime
shipping. Flexnet surprised all customers as the sole potential
service to replace cable and satellite TV. The research shows
2,500 customers in the US believed that Flexnet becomes one of
the three companies which are leading to video streaming
services. According to Imoderate (2015), “This popularity is not
surprising, as it’s also reflected in market share, with Nielsen
reporting that 36 percent of U.S. households subscribe to its
service, far more than its nearest competitor.” (para. 3).
The Rise and Fall of Flexnet: What Happened and Where Will It
Go From Here?
Flexnet started 17 years ago, “In 1999, Flexnet initiated its
subscription service which provided unlimited DVD rentals for
a monthly fee after the company received a $30 million
investment from the Group Arnault (Flexnet Inc. Company
Profile, 2011)” (Allen, Feils, & Disbrow (2014). Flexnet was, in
turn, able to capitalize on the home-delivery market of DVD
rentals and to stream TV shows and movies. The company took
advantage of the wants and needs of its customers and in turn
dominated their market. “In 2011, however, a price hike, poor
management decisions, changes in technology, and increased
competition threatened Flexnet, leading to a sharp decline in its
share price” (Allen, Feils, & Disbrow (2014). Since 2011,
Flexnet has continued to receive competitors in a market they
once didn’t. In turn, their costs have increased, “. "Flexnet's
content costs have jumped to $3.5 billion over the past several
years, up from the $2.4 billion reported previously..." (Lang,
2011). The potentially severe increase in the cost of content
could have a major impact on Flexnet's ability to generate
profits in the future (Allen, Feils, & Disbrow (2014).
The Flexnet Recommender System: Algorithms, Business Value,
and Innovation
Keeping the interest of a subscriber is something that Flexnet
reviews and looks into to aid in ensuring their customers hold
the interest in the programs and movies are being offered. This
strategy decreases the chances of the subscriber losing interest
and moving to another outlet for entertainment such as; HBO,
Amazon Prime, or Hulu. “Consumer research suggests that a
typical Flexnet member loses interest after perhaps 60 to 90
seconds of choosing, having reviewed 10 to 20 titles (perhaps 3
in detail) on one or two screens. The user either finds something
of interest or the risk of the user abandoning our service
increases substantially” (Gomez, C. A., & Hunt, N. (2016,
January). Flexnet has since invested in changing the look and
view of their pages, which includes all devices to share the
same view: laptops, iPads, phones, and TV’s, “It has a matrix-
like layout. Each entry in the matrix is a recommended video,
and each row of videos contains recommendations with a
similar “theme.” Rows are labeled according to their theme to
make the theme transparent and (we think) more intuitive to our
members” (Gomez, C. A., & Hunt, N. (2016, January).
Flexnet: Rebranding and Price increase Debacle.
In this article, the author takes a particular case into one of
Flexnet’s strategic move that had a fundamental impact on the
operations of the company. The author notes that Flexnet had
earned the reputation of being the number one online film and
rental services. Its revenue mostly came from clients who paid
fees to have DVDs delivered to their doorsteps via the U.S. mail
service. Some customers paid fees to watch directly TV shows
through the internet on the TV sets, mobile phones, or laptops
(Hoffman, 2013). The author looks at how an attempt by the
company to rebrand and then alter the price of its services
affected the company. Flexnet had tried to differentiate its
online streaming service from its DVD delivery service. This
move did not materialize well for the company as many of its
customers failed to understand the reason behind the company’s
decision to do that. The consequence of this action was that the
company ended up losing an estimated 800,000 thousand clients
(Hoffman, 2013). The company was forced to rescind this move
and reintegrate the delivery and streaming services to avoid
further losses. Despite suffering the major setback, Flexnet
executives were confident that the company could still salvage
the situation by convincing its customers that its services were
still the best in the market and could not be beaten by that of
any other company. Flexnet was able to retain its remaining
customers and even attract most of their clients back to the
company by offering quality services at a lower price. The
information covered in this article is essential because it shows
the challenges that rapidly expanding companies face as they
strive to remain relevant and ahead of their competition. The
focus on Flexnet demonstrates how the company was able to
utilize thoughtful tactics to rectify a classical business misstep
that threatened the company’s excellent progress to becoming
the ultimate entertainment supply platform.
Flexnet’s Original Programming Strategies and the On-Demand
Television Transition.
In this article, the author examines and analyzes the
promotional strategies that Flexnet has been utilizing to
promote its services. The author, Tyron, investigates
comprehensive details that may not be so obvious to the normal
person to explore the factors that have been instrumental in
contributing to the rising success that Flexnet has enjoyed
(Tyron, 2015). The author reviews various sources that talk
about current management developments throughout the globe
and highlights practical promotional strategies that Flexnet has
adopted to strengthen its position as a key player in the market.
By conducting a cutting edge research and studying several case
studies, the author provides the reader with valuable insights
and practical knowledge that have put Flexnet on top of its
competitors. Tyron suggests that the success story of Flexnet
can be explained through Pierre Bourdieu's concept of
“discourses of distinction.” With this concept, Tyron
suggests that Flexnet has become a hit because it practically
applied the concept by offering an abundance of unique services
intended towards attracting their client’s loyal participation on
the company’s streaming services. Tyrone also points to the
company’s association with the HBO cable channel as a pivotal
engagement that reinforces its Flexnet’s discourse. Finally,
Tyrone credits other promotional avenues that Flexnet has used
as being significant in popularizing the company across the
globe. Tyrone particularly notes that the “TV Got Better
Campaign” that tended greatly naturalized viewing habits for
example binge watching as part of a cult phenomenon of a
narrative cutting edge and technological society (Tyron, 2015).
The content written in this article is relevant to the research
project because it reveals important information that is bound to
save any researcher precious time as it pinpoints pertinent
information about the company and presents it in a condensed
form that is easy to understand.
Challenges and opportunities in high-dimensional choice data
analyses
As is the case for Flexnet, modern businesses capture data.
Data collected by Flexnet could be as far views of a specific
movie, ratings provided after the video is viewed, attempt to
have high quality movies that are “wants to be seen” by their
subscribers and entice additional peoples or consumers to
subscribe to their service. The informative datasets have been
bettered with higher quality of results as the years have passed
as well as streaming instead of waiting for a video (CD) to
arrive to your home to watch. The creations of alternatives to
provide what the consumer is wanting and expecting is
important but also at a real cost; that is affordable and
competitive. Predictive markets rely on proper data and research
results; Flexnet is having the ability to predictive the market is
similar to the reasoning behind our team assignment.
Vulnerabilities and Countermeasures in Context-Aware Social
Rating Services
The importance of social trusts and the results from
research questions is important to earn the recommendation of
those who are already using the product in this case “Flexnet”.
The rating of the system usage as well as the preference by the
subscribers; the ability to provide what is expected is critical
therefore the importance to be the leader in the competitive
world as well as having excellent ratings and outcomes; being
fair and cost effective is important. The reputation is also
analyzed by the consumers before signing up for a service being
rated by stars and comments is important; this provider trust
worthy reputations that will provide leading “kudos” when the
discussion about raising costs to provide the better selection.
The feedback on this article provides:
1. Customer reviews
2. Star ratings
3. Graphs of the (smiley face) rating
a. Happy (excellent)
b. Smiley (Good)
c. Not Happy nor sad (Ok, could have been better or maybe
just ok)
d. So-So (not great)
e. Sad (Bad)
Flexnet will use their ratings for promoting their new movies,
available movies, better or leading in the industry, etc.
Flexnet is making a move into the Chinese market
Rumors are surfacing that Flexnet partnering with a local
Chinese company. Vice President of Chinese company revealed
that discussions are on-going regarding the entry of Flexnet into
the Chinese market. Upon entry, Flexnet will face intense
competition which is the reason for seeking a suitable partner.
With the knowledge of knowing that neither Google, YouTube,
Facebook, nor Twitter is providing regular services in China,
Flexnet CEO is unsure that the company can get licensed to
operate in China (Yalan, 2015). By partnering with a local
company, Flexnet would avoid the challenge and difficulty of
applying for a variety of different licenses. “Flexnet makes
money by charging all subscribers a fee, but these subscriptions
are unheard of in the Chinese media market” (Yalan, 2015).
China enjoys free media and breaking this habit could be
extraordinarily difficult.
What we know about the Netflix price hike
Flexnet downplayed its planned rate hike, stating it would only
be a dollar or two difference. Flexnet introduced a DVD spinoff
name Speedster and charged their customers $7.99 each instead
of one price of $9.99 for both. Within four months, this caused
Flexnet to lose 800,000 subscribers and their stock to drop in
value by 77%. “The company hasn't touched a US price increase
in the three years since, but its ambition to become a must-have
part of every consumer's TV budget has driven Netflix to spend
more on licensing top content and creating high-budget original
programming of its own” (Solsman, 2014). New members are
paying $1 to $2 higher than Flexnet current customers. The
question now is “how long existing members would continue
paying their current rate before the higher price applies to
them” (Solsman, 2014).
Flexnet Quick Guide: How Does Flexnet Decide What's On
Flexnet
This video was released in 2013 by Flexnet as an
explanation of how and why the selection process happens for
streaming and DVD movie choices. The representative on the
video is Jenny McCabe who is the Director of Global Media
Relations. At that time, Flexnet goal “was to deliver a mix of tv
shows and movies that give an exclusive experience”
(McCabe,2013) rather than being television and film library.
One of the ways they differentiate themselves is by licensing
TV shows exclusively to give the consumer a unique
experience. An example of that would be “Orange is the New
Black” or “House of Card”.
Because Flexnet cannot license everything and maintain
their low prices, content is chosen by the viewership of the
customer. So those titles that will garner higher numbers of
streaming will be selected to be licensed. The cost of the
licensing is taken into consideration as well. If the viewership
is high, it will justify the cost which could get a possible
renewal when the agreement runs out. So essentially Flexnet is
saying that the ball in our court to choose what we want to see
on there. This is relevant because it speaks on the licensing
issue and its Flexnet response to customer complaints. Where
else should this information come from other than from the
horse mouth?
Flexnet Review – Online DVD Rentals and Video Streaming
The article is about Flexnet, how its run. It tells the story
of how Flexnet became a household name with its DVD rental
concept. Once it transitioned to streaming it became even more
of a household name reaching people who are at the front of the
streaming craze. The only limitations to the services where are
online content choices. After conquering the streaming service
they decided to expand from a TV only platform and started
making applications to your phone, and blue-ray players then
growing to console integration so you can use you gaming
system to stream content. This article showed how Flexnet
compares the competition, and Flexnet excels when it comes to
convenience and variety of features and the pricing. Its greatest
motto is the no late fees.
The article is relevant because it clearly depicted the road
it took for Flexnet to get where it is now. It also talked about
the constant struggle Flexnet has with staying competitive in the
area of pricing. It also touched on the problems with the content
available for streaming which alludes to the licensing issues.
.
References
Allen, G., Feils, D., & Disbrow, H. (2014). The Rise and Fall of
Flexnet: What Happened and Where Will it Go from Here?? ().
Arden: Jordan Whitney Enterprises, Inc. Retrieved from
http://search.proquest.com/docview/1647822304?accountid=458
Feng, Q., Liu, L., & Dai, Y. (2012, January) Vulnerabilities and
countermeasures in context-aware social rating services. ACM
Transactions on Internet Technology (TOIT), 11(3).
Doi:10.1145/2078316.2078319
Gina K., (2012), Flexnet: The Epic Battle for America’s
Eyeballs, Portfolio/ Penguin Print.
Gomez, C. A., & Hunt, N. (2016, January). The Flexnet
Recommender System: Algorithms, Business Value, and
Innovation. ACM Transactions on Management Information
Systems, 6(13).
Guina, R. (2016, February 18). Netflix Review – Online DVD
Rentals and Video Streaming. Retrieved April 17, 2016, from
http://cashmoneylife.com/netflix-review-online-dvd-rentals/
Hoffman, A. (2013). Flexnet: Rebranding and Price increase
Debacle. Erasmus Research Institute Management.
Hoover's. (2016). Retrieved from
http://www.hoovers.com/company-information/cs/company-/
profile.Flexnet_Inc.f336f5bc15a31a6c.htm
Imoderate. (2015). Flexnet – the one true entertainment
disrupter? Retrieved from http://www.imoderate.com/new-
study-reveals-why-consumers-prefer-Flexnet-over-hulu-and-
amazon/
Lang, Brent and Waxman, Sharon (October 25, 2011). Flexnet
Stock Plunge: Will Reed Hastings' Hubris Bring Down an
Internet Meteor? www.reuters.com. Retrieved May 13, 2012
from http://www.reuters.com/article/201
l/10/25/idUS375477277620111025
McCabe, J (Author and Director of Global Media
Relations). Flexnet Quick Guide: How does Flexnet Decide
What's on Flexnet [video file]. Available from YouTube
website: https://www.youtube.com/watch?v=VvpoUh9gx58
Naik, P., Wedel, M., Bacon, L., Bodapati, A., Bradlow, E.,
Kamakura, W., Montgomery, A. (2008). Challenges and
opportunities in high-dimensional choice data analyses.
Marketing Letters, 19(3-4), 201-213. doi:
http://dx.doi.org/10.1007/s11002-008-9036-3
Nye, H. (2011).Flexnet’s Big Licensing Dilemma. Retrieved
from http://www.businessinsider.com/Flexnets-big-licensing-
dilemma-2011-7
Schneider S., (2015), What must Flexnet do to survive?
retrieved from the USA today.
Snyder, B. (2010). Flexnet Broke the Rules and Won. Retrieved
from https://www.gsb.stanford.edu/insights/Flexnet-broke-rules-
won
Solsman, J. E. (2014, April 21). What we know about the
Netflix price hike. CNET. Retrieved from
http://www.cnet.com/news/what-we-know-about-the-netflix-
price-hike/
Tyron, C. (2015). TV Got Better: Flexnet’s Original
Programming Strategies and the On-
Demand Television Transition. Media Industries, 2.2 (2015).
Yalan, L. (2015, October). Flexnet is making a move into the
Chinese market. Business Insider.
Retrieved from http://www.businessinsider.com/netflix-will-
likely-enter-chinese-market-2015-10
1
Running Head: WEEK 3 TEAM ASSIGNMENT
Flexnet
The consumer product rental industry continues to grow
and improve services beyond video stores. “Flexnet steers couch
potatoes away from the video store to the mailbox or Internet.
The company's more than 57 million subscribers in 50 countries
can download movies or rent DVDs for a monthly fee through
Flexnet.com” (Hoovers (2016) (para. 1). As the era changes,
instead of DVD rental, Flexnet is focusing on its fast-growing
overseas streaming service.
A Brief History
Flexnet was established 18 years ago on August 29, 1997.
Its original premise was to offer America the convenience of
having your movie rentals mailed to you vs. having to go to the
rental store. In 2007, Flexnet introduced streaming to its line of
services offered. Both services are provided with the business
model of no late fees, a flat rate, and unlimited rentals or
streaming. In 2013, flex net received some negative reviews on
their streaming content. To the customers, it seemed that if you
wanted to get the newest content the best way would be to get
the DVD. Flexnet responded to the complaints by
acknowledging the issue and stating quite frankly that it’s
economical to get the rights to DVDs than to the stream. They
also said that the way they choose what will be renewed or
added is based on how many streams a movie or show gets. In
the coming years with the popularity of streaming devices like
Apple TV, Roku, and Amazon Fire and the use of applications
for streaming Flexnet has had an increasing battle to stay
competitive with content offered and prices charged.
Dilemma that the Organization Might Face
From the outside, Flexnet seems to be a successful
company with strong financial performance. However, Flexnet
has faced with pricing and licensing dilemmas. Many
subscribers and investors questioned if the company can
continue keeping its lead on video rental and streaming
services. Flexnet has to renew its license, content, and
agreements frequently. Due to the hiking renewal cost, Flexnet
has to pay much higher than what they paid in previous years.
The company is under pressure to increase the service fee
without losing the established customers. If the company does
not want to pay high licensing fees, it will lose many
subscribers. Amazon Prime and Hulu are one of the main
competitors of Flexnet, have the right to stream their contents.
Nye (2011), “This leads up to Flexnet’s other biggest obstacle:
distribution. The debate is no longer between DVDs and
streaming, and the question is now who will offer the best
platform from which to distribute the most desirable content”
(para. 10). Customers always expect to get high-quality
products at reasonable price. The management of Flexnet needs
to do some researches to find the best method for solving these
dilemmas. Nye (2011), “The company is feeling the pressure
from consumers over the price hikes, but without the price
hikes, how will it pay increased licensing fees? If it loses
licensing contracts, will consumers stick around for limited
available content?” (para. 13).
Research Questions
What does Flexnet need to do to survive with high
licensing fees and with strong competitors like, Hulu and
Amazon Prime?
Will Flexnet be increasing monthly premiums to
subscribers within a year; due to the increased cost of
licensing?
What evidence (data/measures) of impact was there in the
past with increases?
Flexnet is in a dilemma, decisions surrounding cost
increases for their current and new subscribers might affect
their overall subscriptions. The need to enhance is due to
increases in the licensing to obtain the licenses for the movies.
The customers expect excellent service for a great cost, but
would this still be the case if we increase the costs by 25%?
Decisions surrounding this dilemma will be when the increase
takes effect and at what point are the current subscribers
affected and when will the new customers receive the impact of
the new costs for the monthly premium.
Research Plan
With the onset of the internet, Flexnet has seen a
considerable amount of pressure because not only are their
clients opting to stream movies, but also the rise of potential
competitors. Flexnet is seeing a grand change in the industry
because, a few years ago, they enjoyed monopoly and their large
stack of movie libraries is what gained them subscribers in the
first place. Combined with manageable licensing rates that
could be paid for by the customer’s subscriptions, Flexnet was
untouchable. The real concern now is what happens when the
licensing rates go up, and their competitors have cheaper ways
to deliver the movies (Schneider, 2015). Flexnet could look into
expanding into international markets, can take advantage of the
public markets and look to make some extra money through the
use of smart media acquisitions. Finally, they should look to
form mergers and completely redesign their rigid business
model to accompany the modern day trends.
This challenge requires that Flexnet associates itself with a
network with an active media conglomerate so they can invest
in innovations and explore new things. The international market
is a mine field, and since they were able to tap into the
American market, using even better techniques, they could
source for revenue from other countries which would go a long
way in reducing the burden of costs (Gina, 2012). Second,
merging with an already established company and one with a
flexible business model will save Flexnet the costs they would
incur to redefine their business totally at the expense of a small
stake into the company. The acquisitions of smart media can
help Flexnet look into the blueprints of other successful media
conglomerates where they can learn about the strengths and
weaknesses while comparing to their own to promote growth
and adaptation.
Creating a network will increase the self-worth of Flexnet
and thus even more reduced rates for their clients because they
will have already established an even larger market pool than
they have right now.
Appendix
Flexnet Broke the Rules and Won
Research how the DVD rental company succeeded in a tough
marketplace.
Besides the online movies and TV shows, Flexnet invested in
the video rental market with an incredible result. With this new
business model, customers only need to pay a fixed monthly fee,
make a list of future video rentals, order those videos online,
and extend the rent without late charges. Customers have
enjoyed all the best offers from Flexnet’s new rental business.
Customers’ wish lists have created a significant advantage for
Flexnet to understand what kind of movies that the clients are
expecting. Flexnet has tried to carry all movies to meet
customers’ demands. The company should stock many movies
that can ship to customers immediately. The company needs to
create a deadline to encourage all customers return the videos
by their due dates and create a rule that the clients need to
return the old videos before they can rent the new ones. This
rule helped Flexnet on reducing the number of stocking movie
copies. Removing deadlines balance the supply and demand,
creates a comfortable condition and environment for satisfying
customers’ needs and controls their costs effectively. Flexnet
does not have to stock all movies (Snyder, 2010).
Flexnet – the One True Entertainment Disrupter?
Online video streaming service becomes successful
because customers can switch using cable and satellite to the
streaming service. How Flexnet can continue keeping the
leading position in a competitive video rental and streaming
services with Hulu and Amazon Prime. Customers believe that
Flexnet will beat other companies because Hulu customers got
annoyance by their routine commercials, and Amazon Prime
Instant Video is not differentiated from Amazon Prime
shipping. Flexnet surprised all customers as the sole potential
service to replace cable and satellite TV. The research shows
2,500 customers in the US believed that Flexnet becomes one of
the three companies which are leading to video streaming
services. According to Imoderate (2015), “This popularity is not
surprising, as it’s also reflected in market share, with Nielsen
reporting that 36 percent of U.S. households subscribe to its
service, far more than its nearest competitor.” (para. 3).
The Rise and Fall of Flexnet: What Happened and Where Will It
Go From Here?
Flexnet started 17 years ago, “In 1999, Flexnet initiated its
subscription service which provided unlimited DVD rentals for
a monthly fee after the company received a $30 million
investment from the Group Arnault (Flexnet Inc. Company
Profile, 2011)” (Allen, Feils, & Disbrow (2014). Flexnet was, in
turn, able to capitalize on the home-delivery market of DVD
rentals and to stream TV shows and movies. The company took
advantage of the wants and needs of its customers and in turn
dominated their market. “In 2011, however, a price hike, poor
management decisions, changes in technology, and increased
competition threatened Flexnet, leading to a sharp decline in its
share price” (Allen, Feils, & Disbrow (2014). Since 2011,
Flexnet has continued to receive competitors in a market they
once didn’t. In turn, their costs have increased, “. "Flexnet's
content costs have jumped to $3.5 billion over the past several
years, up from the $2.4 billion reported previously..." (Lang,
2011). The potentially severe increase in the cost of content
could have a major impact on Flexnet's ability to generate
profits in the future (Allen, Feils, & Disbrow (2014).
The Flexnet Recommender System: Algorithms, Business Value,
and Innovation
Keeping the interest of a subscriber is something that Flexnet
reviews and looks into to aid in ensuring their customers hold
the interest in the programs and movies are being offered. This
strategy decreases the chances of the subscriber losing interest
and moving to another outlet for entertainment such as; HBO,
Amazon Prime, or Hulu. “Consumer research suggests that a
typical Flexnet member loses interest after perhaps 60 to 90
seconds of choosing, having reviewed 10 to 20 titles (perhaps 3
in detail) on one or two screens. The user either finds something
of interest or the risk of the user abandoning our service
increases substantially” (Gomez, C. A., & Hunt, N. (2016,
January). Flexnet has since invested in changing the look and
view of their pages, which includes all devices to share the
same view: laptops, iPads, phones, and TV’s, “It has a matrix-
like layout. Each entry in the matrix is a recommended video,
and each row of videos contains recommendations with a
similar “theme.” Rows are labeled according to their theme to
make the theme transparent and (we think) more intuitive to our
members” (Gomez, C. A., & Hunt, N. (2016, January).
Flexnet: Rebranding and Price increase Debacle.
In this article, the author takes a particular case into one of
Flexnet’s strategic move that had a fundamental impact on the
operations of the company. The author notes that Flexnet had
earned the reputation of being the number one online film and
rental services. Its revenue mostly came from clients who paid
fees to have DVDs delivered to their doorsteps via the U.S. mail
service. Some customers paid fees to watch directly TV shows
through the internet on the TV sets, mobile phones, or laptops
(Hoffman, 2013). The author looks at how an attempt by the
company to rebrand and then alter the price of its services
affected the company. Flexnet had tried to differentiate its
online streaming service from its DVD delivery service. This
move did not materialize well for the company as many of its
customers failed to understand the reason behind the company’s
decision to do that. The consequence of this action was that the
company ended up losing an estimated 800,000 thousand clients
(Hoffman, 2013). The company was forced to rescind this move
and reintegrate the delivery and streaming services to avoid
further losses. Despite suffering the major setback, Flexnet
executives were confident that the company could still salvage
the situation by convincing its customers that its services were
still the best in the market and could not be beaten by that of
any other company. Flexnet was able to retain its remaining
customers and even attract most of their clients back to the
company by offering quality services at a lower price. The
information covered in this article is essential because it shows
the challenges that rapidly expanding companies face as they
strive to remain relevant and ahead of their competition. The
focus on Flexnet demonstrates how the company was able to
utilize thoughtful tactics to rectify a classical business misstep
that threatened the company’s excellent progress to becoming
the ultimate entertainment supply platform.
Flexnet’s Original Programming Strategies and the On-Demand
Television Transition.
In this article, the author examines and analyzes the
promotional strategies that Flexnet has been utilizing to
promote its services. The author, Tyron, investigates
comprehensive details that may not be so obvious to the normal
person to explore the factors that have been instrumental in
contributing to the rising success that Flexnet has enjoyed
(Tyron, 2015). The author reviews various sources that talk
about current management developments throughout the globe
and highlights practical promotional strategies that Flexnet has
adopted to strengthen its position as a key player in the market.
By conducting a cutting edge research and studying several case
studies, the author provides the reader with valuable insights
and practical knowledge that have put Flexnet on top of its
competitors. Tyron suggests that the success story of Flexnet
can be explained through Pierre Bourdieu's concept of
“discourses of distinction.” With this concept, Tyron
suggests that Flexnet has become a hit because it practically
applied the concept by offering an abundance of unique services
intended towards attracting their client’s loyal participation on
the company’s streaming services. Tyrone also points to the
company’s association with the HBO cable channel as a pivotal
engagement that reinforces its Flexnet’s discourse. Finally,
Tyrone credits other promotional avenues that Flexnet has used
as being significant in popularizing the company across the
globe. Tyrone particularly notes that the “TV Got Better
Campaign” that tended greatly naturalized viewing habits for
example binge watching as part of a cult phenomenon of a
narrative cutting edge and technological society (Tyron, 2015).
The content written in this article is relevant to the research
project because it reveals important information that is bound to
save any researcher precious time as it pinpoints pertinent
information about the company and presents it in a condensed
form that is easy to understand.
Challenges and opportunities in high-dimensional choice data
analyses
As is the case for Flexnet, modern businesses capture data.
Data collected by Flexnet could be as far views of a specific
movie, ratings provided after the video is viewed, attempt to
have high quality movies that are “wants to be seen” by their
subscribers and entice additional peoples or consumers to
subscribe to their service. The informative datasets have been
bettered with higher quality of results as the years have passed
as well as streaming instead of waiting for a video (CD) to
arrive to your home to watch. The creations of alternatives to
provide what the consumer is wanting and expecting is
important but also at a real cost; that is affordable and
competitive. Predictive markets rely on proper data and research
results; Flexnet is having the ability to predictive the market is
similar to the reasoning behind our team assignment.
Vulnerabilities and Countermeasures in Context-Aware Social
Rating Services
The importance of social trusts and the results from
research questions is important to earn the recommendation of
those who are already using the product in this case “Flexnet”.
The rating of the system usage as well as the preference by the
subscribers; the ability to provide what is expected is critical
therefore the importance to be the leader in the competitive
world as well as having excellent ratings and outcomes; being
fair and cost effective is important. The reputation is also
analyzed by the consumers before signing up for a service being
rated by stars and comments is important; this provider trust
worthy reputations that will provide leading “kudos” when the
discussion about raising costs to provide the better selection.
The feedback on this article provides:
1. Customer reviews
2. Star ratings
3. Graphs of the (smiley face) rating
a. Happy (excellent)
b. Smiley (Good)
c. Not Happy nor sad (Ok, could have been better or maybe
just ok)
d. So-So (not great)
e. Sad (Bad)
Flexnet will use their ratings for promoting their new movies,
available movies, better or leading in the industry, etc.
Flexnet is making a move into the Chinese market
Rumors are surfacing that Flexnet partnering with local
Chinese company. Vice President of Chinese company revealed
that discussions are on-going regarding the entry of Flexnet into
the Chinese market. Upon entry, Flexnet will face intense
competition which is the reason for seeking suitable partner.
With the knowledge of knowing that neither Google, YouTube,
Facebook, nor Twitter is providing regular services in China,
Flexnet CEO is unsure that the company can get licensed to
operate in China (Yalan, 2015). By partnering with local
company, Flexnet would avoid the challenge and difficulty of
applying for a variety of different licenses. “Flexnet makes
money by charging all subscribers a fee, but these subscriptions
are unheard of in the Chinese media market” (Yalan, 2015).
China enjoys the rule of free media and breaking this habit
could be extremely difficulty.
Flexnet Quick Guide: How Does Flexnet Decide What's On
Flexnet
This video was released in 2013 by Flexnet as an
explanation of how and why the selection process happens for
streaming and DVD movie choices. The representative on the
video is Jenny McCabe who is the Director of Global Media
Relations. At that time, Flexnet goal “was to deliver a mix of tv
shows and movies that give an exclusive
experience”(McCabe,2013) rather than being television and film
library. One of the ways they differentiate themselves is by
licensing tv shows exclusively to give the consumer a unique
experience. An example of that would be “Orange is the New
Black” or “House of Card”.
Because Flexnet cannot license everything and maintain
their low prices, content is chosen by the viewership of the
customer. So those titles that will garner higher numbers of
streaming will be selected to be licensed. The cost of the
licensing is taken into consideration as well. If the viewership
is high, it will justify the cost which could get a possible
renewal when the agreement runs out. So essentially Flexnet is
saying that the ball in our court to choose what we want to see
on there. This is relevant because it speaks on the licensing
issue and its Flexnet response to customer complaints. Where
else should this information come from other than from the
horse mouth.
Flexnet Review – Online DVD Rentals and Video Streaming
The article is about Flexnet, how its run. It tells the story
of how Flexnet became a household name with its DVD rental
concept. Once it transitioned to streaming it became even more
of a household name reaching people who are at the front of the
streaming craze. The only limitations to the services where are
online content choices. After conquering the streaming service
they decided to expand from a tv only platform and started
making applications to your phone, and blue-ray players then
growing to console integration so you can use you gaming
system to stream content. This article showed how Flexnet
compares the competition, and Flexnet excels when it comes to
convenience and variety of features and the pricing. Its greatest
motto is the no late fees.
The article is relevant because it clearly depicted the road
it took for Flexnet to get where it is now. It also talked about
the constant struggle Flexnet has with staying competitive in the
area of pricing. It also touched on the problems with the content
available for streaming which alludes to the licensing issues.
.
References
Allen, G., Feils, D., & Disbrow, H. (2014). The Rise and Fall of
Flexnet: What Happened and Where Will it Go from Here?? ().
Arden: Jordan Whitney Enterprises, Inc. Retrieved from
http://search.proquest.com/docview/1647822304?accountid=458
Feng, Q., Liu, L., & Dai, Y. (2012, January) Vulnerabilities and
countermeasures in context-aware social rating services. ACM
Transactions on Internet Technology (TOIT), 11(3).
Doi:10.1145/2078316.2078319
Gina K., (2012), Flexnet: The Epic Battle for America’s
Eyeballs, Portfolio/ Penguin Print.
Gomez, C. A., & Hunt, N. (2016, January). The Flexnet
Recommender System: Algorithms, Business Value, and
Innovation. ACM Transactions on Management Information
Systems, 6(13).
Hoffman, A. (2013). Flexnet: Rebranding and Price increase
Debacle. Erasmus Research Institute Management.
Hoover's. (2016). Retrieved from
http://www.hoovers.com/company-information/cs/company-/
profile.Flexnet_Inc.f336f5bc15a31a6c.htm
Imoderate. (2015). Flexnet – the one true entertainment
disrupter? Retrieved from http://www.imoderate.com/new-
study-reveals-why-consumers-prefer-Flexnet-over-hulu-and-
amazon/
Lang, Brent and Waxman, Sharon (October 25, 2011). Flexnet
Stock Plunge: Will Reed Hastings' Hubris Bring Down an
Internet Meteor? www.reuters.com. Retrieved May 13, 2012
from http://www.reuters.com/article/201
l/10/25/idUS375477277620111025
Naik, P., Wedel, M., Bacon, L., Bodapati, A., Bradlow, E.,
Kamakura, W., Montgomery, A. (2008). Challenges and
opportunities in high-dimensional choice data analyses.
Marketing Letters, 19(3-4), 201-213. doi:
http://dx.doi.org/10.1007/s11002-008-9036-3
Nye, H. (2011).Flexnet’s Big Licensing Dilemma. Retrieved
from http://www.businessinsider.com/Flexnets-big-licensing-
dilemma-2011-7
Schneider S., (2015), What must Flexnet do to survive?
retrieved from the USA today.
Snyder, B. (2010). Flexnet Broke the Rules and Won. Retrieved
from https://www.gsb.stanford.edu/insights/Flexnet-broke-rules-
won
Tyron, C. (2015). TV Got Better: Flexnet’s Original
Programming Strategies and the On-
Demand Television Transition. Media Industries, 2.2 (2015).
Yalan, L. (2015, October). Flexnet is making a move into the
Chinese market. Business Insider.
Retrieved from http://www.businessinsider.com/netflix-will-
likely-enter-chinese-market-2015-10
McCabe,J (Author and Director of Global Media
Relations). Flexnet Quick Guide: How does Flexnet Decide
What's on Flexnet [video file]. Available from YouTube
website:https://www.youtube.com/watch?v=VvpoUh9gx58
Guina, R. (2016, February 18). Netflix Review – Online DVD
Rentals and Video Streaming. Retrieved April 17, 2016, from
http://cashmoneylife.com/netflix-review-online-dvd-rentals/
Descriptive StatisticsJane DoeQNT/561
July 14, 2014
Matthew Radio
SHORT TITLE OF PAPER
1
Running head: DESCRIPTIVE STATISTICS
1
Descriptive Statistics
Numeric Variable: Willingness to Recommend (collected from
customer satisfaction survey)
Distribution is not normally distributed.
Central Tendency:
Mean = 4.37
Median = 5
Mode = 5
Dispersion:
Standard deviation = 1.26
Interquartile range (IQR) = 1.00
Range = 5
Number: 250 records
Min/Max: 1 and 5
Confidence Interval: There is a 95% confidence that the
population average is between 4.22 and 4.53
See the descriptive statistics in Appendix B and the histogram
in Appendix C.
Numeric Variable: Days to Contract Expiration
Central Tendency:
Mean = 388.68
Median = 450.00
Mode = 630.00
Dispersion:
Standard deviation = 242.28
Interquartile range (IQR) = 450.00
Range = 720.00
Number: 250 records
Min/Max: 0 and 720
Confidence Interval: There is a 95% confidence that the
customer Days to Contract Expiration is between 358.65 and
418.71
See the descriptive statistics in Appendix B and the histogram
in Appendix C.
Attribute Variable Handset Brands
250 customers who called into the contact center within the last
three months were selected at random. 46.8% of the customers
own a Samsung brand device, 41.6% own an iPhone, 7.6% own
an LG, and 4.0% own a brand under the "Other" category (this
includes brands like Palm, Kyoceta, and CellTel). See bar chart
in Appendix E. Comment by Matthew Radio: Would a pie chart
be more effective?
Descriptive Statistics Interpretation
Willingness to Recommend
250 customers were surveyed at random. The customers were
asked how likely they would recommend CellTel to a friend or
relative. Customers could select from 1 - 5:
5 = Would Definitely Recommend
4 = Very Likely To Recommend
3 = for Undecided
2 = Not Likely to Recommend
1 = Would Definitely Not Recommend
The average score was 4.37, with a variation of plus or minus
0.16. 71.6% of the responses were scored as a 5 - Would
Definitely Recommend. There is a 95% confidence that the
population score averages between 4.22 and 4.53. Comment by
Matthew Radio: What do you mean by “variation”? Do you
mean variance, standard deviation, or some other metric of
dispersion?
Days to Contract Expiration
250 customers who called into the contact center within
the last three months were selected at random. The average
time to contract expiration was 388.68 days, with a variation of
plus or minus 30.03 days. One half or more of the customers
were above 450 days to their contract expiration. 13.20% of the
customers have contracts that have already expired. There is a
95% confidence that the population (CellTel's customer base)
average days to contract expiration is between 358.65 and
418.71 days.
DESCRIPTIVE STATISTICS
2
APPENDIX A
Raw data used in the analysis
APPENDIX B
Descriptive Statistics Willingness to Recommend and Contract
Expiration
Comment by Matthew Radio: What does the “nominal
score” mean? Be sure that the meaning of all figures are readily
apparent to the reader.
APPENDIX C
Willingness to Recommend and Days to Contract Expiration
Histograms
Comment by Matthew Radio: Should each bar be a range
and not a single value?
If the horizontal scale is continuous, should this be a
histogram? (i.e. the bars touch each other)
APPENDIX D
Scatterplot Willingness to Recommend versus Days to Contract
Expiration
APPENDIX E
Descriptive Statistics
Attribute Variable Handset Brands
Willingness to Recommend
Percent 1.0 2.0 3.0 4.0 5.0 0.1 0.012 0.016
0.156 0.716
Days to Contract Expiration
Percent 0.0 30.0 60.0 90.0 180.0 270.0 360.0
450.0 540.0 630.0 720.0 0.132 0.032
0.012 0.02 0.076 0.12 0.092 0.104 0.128
0.16 0.124
Willingness to Recommend Score 360.0 720.0 360.0
720.0 540.0 180.0 270.0 630.0 720.0
0.0 360.0 540.0 0.0 540.0 540.0 0.0
30.0 0.0 360.0 720.0 360.0 30.0 630.0
180.0 720.0 450.0 0.0 540.0 180.0
450.0 360.0 270.0 180.0 630.0 30.0
630.0 30.0 450.0 60.0 450.0 90.0 630.0
720.0 360.0 450.0 450.0 0.0 630.0
450.0 630.0 720.0 90.0 450.0 360.0
0.0 0.0 360.0 360.0 60.0 270.0 450.0
180.0 720.0 360.0 720.0 720.0 540.0
630.0 630.0 720.0 630.0 90.0 270.0
450.0 0.0 540.0 270.0 630.0 360.0
0.0 270.0 540.0 60.0 720.0 0.0 0.0 0.0
630.0 540.0 630.0 450.0 540.0 270.0
540.0 270.0 30.0 90.0 630.0 630.0 630.0
540.0 450.0 540.0 630.0 720.0 450.0
540.0 450.0 720.0 630.0 540.0 270.0
30.0 630.0 450.0 450.0 270.0 270.0
360.0 450.0 0.0 540.0 450.0 450.0
450.0 30.0 0.0 450.0 630.0 720.0 540.0
360.0 720.0 0.0 180.0 360.0 540.0
0.0 630.0 540.0 360.0 0.0 720.0 630.0
630.0 180.0 720.0 720.0 0.0 540.0
540.0 270.0 0.0 270.0 180.0 90.0 450.0
720.0 540.0 270.0 270.0 180.0 360.0
0.0 720.0 630.0 720.0 630.0 270.0
270.0 180.0 270.0 0.0 0.0 630.0 450.0
720.0 630.0 450.0 270.0 270.0 180.0
720.0 630.0 360.0 180.0 180.0 270.0
720.0 540.0 540.0 270.0 720.0 180.0
270.0 450.0 270.0 270.0 630.0 0.0
720.0 630.0 540.0 360.0 180.0 540.0
270.0 270.0 270.0 360.0 0.0 630.0
180.0 630.0 540.0 630.0 360.0 540.0
0.0 30.0 540.0 630.0 720.0 180.0 720.0
270.0 630.0 630.0 720.0 540.0 450.0
0.0 630.0 0.0 0.0 630.0 0.0 0.0 270.0
0.0 540.0 360.0 0.0 630.0 720.0 180.0
180.0 360.0 540.0 630.0 5.0 5.0 1.0
5.0 5.0 1.0 5.0 5.0 5.0 1.0 5.0 5.0 5.0 5.0
5.0 1.0 5.0 5.0 4.0 5.0 5.0 4.0 5.0 5.0 5.0
1.0 1.0 5.0 5.0 4.0 5.0 1.0 5.0 5.0 5.0 5.0
5.0 5.0 5.0 5.0 5.0 4.0 5.0 5.0 5.0 3.0 5.0
5.0 5.0 5.0 4.0 5.0 5.0 5.0 5.0 2.0 5.0 5.0
5.0 5.0 5.0 5.0 5.0 4.0 4.0 5.0 5.0 1.0 5.0
5.0 5.0 4.0 5.0 5.0 5.0 5.0 5.0 5.0 4.0 5.0
4.0 5.0 5.0 5.0 5.0 5.0 5.0 4.0 5.0 3.0 4.0
5.0 5.0 4.0 5.0 5.0 5.0 5.0 3.0 5.0 5.0 5.0
5.0 5.0 5.0 5.0 5.0 5.0 5.0 5.0 5.0 5.0 1.0
5.0 5.0 5.0 5.0 5.0 5.0 4.0 5.0 5.0 1.0 5.0
5.0 5.0 5.0 4.0 4.0 4.0 5.0 5.0 5.0 4.0 5.0
5.0 5.0 4.0 5.0 5.0 5.0 5.0 5.0 5.0 5.0 5.0
4.0 1.0 4.0 4.0 5.0 5.0 5.0 4.0 5.0 5.0 4.0
5.0 5.0 4.0 4.0 5.0 5.0 5.0 4.0 5.0 5.0 5.0
4.0 5.0 5.0 4.0 5.0 5.0 5.0 5.0 5.0 5.0 4.0
5.0 5.0 3.0 4.0 5.0 5.0 1.0 5.0 1.0 5.0 5.0
5.0 5.0 4.0 1.0 5.0 2.0 4.0 5.0 5.0 1.0 5.0
5.0 5.0 5.0 1.0 5.0 5.0 5.0 0.0 5.0 5.0 5.0
5.0 1.0 4.0 5.0 1.0 1.0 5.0 5.0 4.0 5.0 5.0
5.0 4.0 5.0 1.0 1.0 5.0 5.0 1.0 5.0 4.0 5.0
5.0 1.0 5.0 2.0 5.0 5.0 5.0 4.0 5.0 5.0 5.0
1.0 5.0 4.0 5.0 5.0
Days to Contract Expiration
Willingness to Recommend Score
CellTel Handset Brands Owned
Customer Handsets iPhone LG Other Samsung 0.416
0.076 0.04 0.468
Percent
Descriptive Statistics
STUDENT
QNT 561
November 3, 2014
Professor Matthew Radio
Running head: DESCRIPTIVE STATISTICS
1
DESCRIPTIVE STATISTICS
3
Descriptive Statistics
Techy-Tech Inc. is a global computer software company with
approximately eight thousand employees in its North Carolina
facility. Techy-Tech is a firm that is plagued with a decrease in
productivity due to low morale and team motivation. To solve
this problem, Team B has suggested opening a coffee bar that is
free for employees in hopes of improving the work environment
by increasing motivation and morale, thus ultimately improving
productivity by reducing stress.
Company surveys have identified that many employees have
expressed that they were experiencing higher stress levels than
compared to past surveys. The company has decided since they
cannot control stress levels by reducing market demand, perhaps
improving the work environment could help reduce stress
levels. Research has shown that a stress-filled employee makes
the wrong decisions and has negative relationships with co-
workers. Reduced productivity, mistakes, low quality of work,
and absenteeism are all signs of a stressed employee (Halkos &
Bousinakis, 2010). The company will research the question,
will adding a free coffee bar improve employee productivity?
Descriptive Statistics
Prior to the implementation of the free coffee bar, Techy-Tech,
Inc. measured monthly production rates of surveyed employees
from January-December 2001. The descriptive statistics are
listed below of production before the coffee bar. Comment by
Matthew Radio: Good.
Central Tendency: Mean 16,079.00 units produced
Dispersion: Standard Deviation is 2,451
Number: Measure was 12 months or 12 measurements
Min/Max: 10,080 and 18,700
Confidence Interval: 14,630 to 17,527
Comment by Matthew Radio: Please see comments at end
of paper. A label is needed.
As mentioned, the Techy-tech has seen a decrease in
production, which the bar graph above shows a downward trend
line in terms of production. At the beginning of 2012, Techy-
Tech opened a free coffee bar in hopes that this would decrease
stress and lead to an increase in employee production. Below
are the descriptive statistics for Tech-Tech after the
implementation of the coffee bar: Comment by Matthew
Radio: Now that we are in week 5,can you plot an actual
regression line? Comment by Matthew Radio: Has anything
else changed that would cause an increase in production?
That should be noted.
Central Tendency: Mean 20,735 units produced
Dispersion: Standard Deviation is 2,663
Number: Measure was 12 months or 12 measurements
Min/Max: 16,300 and 25,000
Confidence Interval: 19,160 to 22,309
After the implementation of the free coffee bar, the production
of surveyed employees that used the coffee bar at Techy-Tech
increased from January 2012 to December 2012. The bar graph
above shows a trend line that production at the company is
improving over the previous year. Comment by Matthew
Radio: OK. Some options for next week’s Inferential Statistics
paper…
Do a hypothesis test for the difference of two means (the mean
for the 12 months before and after the coffee bar).
What other tests could be performed?
Descriptive Statistics Interpretation
Techy-Tech, Inc. measured production levels from 2011 and
compared the production levels to 2012 after the
implementation of a free coffee bar. The mean production
levels in 2011 were 16,079 units produced compared to 20,735
units produced after the implementation of a free coffee bar.
The 2011 production had a minimum production at 10,080 units
and maximum units produced were 18,700. When 2011
production was compared to 2012, the 2012 mininum production
rate was 16,300 units produced, and a maximum of 25,000 units
produced. Techy-Tech was 95% confident that in 2011, the
company would produce between 14,640 to 17,527. However, in
2012, the company was 95% confident that they would produce
between 19,160 to 22,309.
Conclusion
In conclusion, Team B conducted a survey to compare a
productivity measure from before and after the coffee bar was
established with the same measure. The team analysis
determined that Techy-Teach employee productivity increased
due to decreasing workplace stress. The survey concluded that
those who use the coffee bar end up producing units from the
previous year. By having a coffee bar in the workplace helped
Techy-Tech employees decompress and work performance
increase.
DESCRIPTIVE STATISTICS
9
References
Halkos, G., & Bousinakis, D. (2010). The Effects of Stress and
Satisfaction on Productivity. International Journal of
Productivity and Performance Management, 59(5), 415-431.
Appendix A
Production Results in 2011 and 2012
Month
Production Before Coffee Bar
Month
Production After Coffee Bar
1-Jan
18200
2-Jan
19500
1-Feb
16200
2-Feb
18220
1-Mar
17200
2-Mar
21100
1-Apr
18700
2-Apr
23900
1-May
18400
2-May
22100
1-Jun
16600
2-Jun
22600
1-Jul
14900
2-Jul
22600
1-Aug
16800
2-Aug
17400
1-Sep
12100
2-Sep
16300
1-Oct
10800
2-Oct
18000
1-Nov
18500
2-Nov
22100
1-Dec
14550
2-Dec
25000
Content and Development
4 Points
Points Earned
4/4
Additional Comments:
All key elements of the assignment are covered in a substantive
way, including:
· Excel Spreadsheet was created.
· Variables are listed.
· Descriptive stats provided
· Applicable charts/graphs displayed..
· Interpretation of statistics given.
Super!
Let me know if you have questions about possible inferential
statistics to use.
Readability, Style, and Mechanics
1 Point
Points Earned
.95 /1
Additional Comments:
Sentences are complete, clear, and concise. Rules of grammar
are followed.
See correct format for figures and tables in Center for Writing
Excellence. (Title, labels, location etc) APA format?
Figures should have a title and be labeled when they appear in
the document.
https://owl.english.purdue.edu/owl/resource/560/19/
The paper, including the title page, reference page, tables, and
appendixes, follows APA formatting guidelines, including
effective use of style.
The paper is no more than 700 words.
Total
5 Points
Points Earned
4.95/5
Overall Comments:
Production before Coffee
18200.0 16200.0 17200.0 18700.0 18400.0 16600.0
14900.0 16800.0 12100.0 10800.0 18500.0
14550.0
Production after Coffee
19500.0 18220.0 21100.0 23900.0 22100.0 22600.0
22600.0 17400.0 16300.0 18000.0 22100.0
25000.0
Production Before Coffee Bar
18200.0 16200.0 17200.0 18700.0 18400.0 16600.0
14900.0 16800.0 12100.0 10800.0 18500.0
14550.0
Months
Productivity
Production After Coffee Bar
19500.0 18220.0 21100.0 23900.0 22100.0 22600.0
22600.0 17400.0 16300.0 18000.0 22100.0
25000.0
Months
Productivity
BoxPlot
10800.0 14812.5 14812.5 16700.0 16700.0 16700.0
18250.0 18250.0 18700.0 18250.0 18250.0
14812.5 14812.5 2.0 2.0 3.0 3.0 1.0 3.0 3.0
2.0 2.0 2.0 1.0 1.0 2.0
Production Before Coffee Bar
BoxPlot
16300.0 18165.0 18165.0 21600.0 21600.0 21600.0
22600.0 22600.0 25000.0 22600.0 22600.0
18165.0 18165.0 2.0 2.0 3.0 3.0 1.0 3.0 3.0
2.0 2.0 2.0 1.0 1.0 2.0
Production After Coffee Bar
Running Head: DESCRIPTIVE STATISTICS AND
INTERPRETATION 1
DESCRIPTIVE STATISTICS AND INTERPRETATION
8Descriptive Statistics and InterpretationQNT/561
August 4, 2014
Matthew Radio
Descriptive Statistics and Interpretation
After collecting the data for Tarlich Supermarket, the next step
was to use statistics to describe, analyze, and interpret
the data. For the study, the independent variable is the amount
of produce inventory ordered, and the dependent variable is the
loss due to spoilage. The research question for the study asks if
the percentage of food thrown out, at Tarlich Supermarket, due
to spoilage is higher than
the industry average.
Data Collection and Descriptive Statistics
Appendix A shows the raw data collected and the calculated
percentage of food thrown away. The sample was chosen by
recording every third shipment of perishable foods, which came
in every two days. Using the percentage of food thrown away,
histograms were created to assess the distribution; refer to
Appendix B. Since the data is normally distributed
, the appropriate descriptive statistics to use are the mean and
standard deviation. Calculations for the descriptive statistics
can be found in Appendix C.
Percentage of Perishable Food Thrown Out
The perishable foods in each shipment were divided into three
categories
before the data was recorded. The descriptive statistics shows
that an average of 9.5 percent of fruits and vegetables, 6.4
percent of meat and poultry, and 12.9 percent of seafood in each
shipment is thrown out.
Descriptive Statistics Interpretation
One hundred shipments were randomly selected and their
perishable food content for each of three groups recorded, in
pounds. The number of pounds later thrown out per shipment
was also recorded, and the percentage of perishables thrown out
calculated per group.
It was found that 8.2 to 11.3 percent of fruits and vegetables,
5.0 to 7.3 percent of meat and poultry, and 9.8 to 15.6 percent
of seafood spoil before being sold. The average percent of food
thrown away was 9.5 percent for fruits and vegetables, 6.4
percent for meat and poultry, and 12.9 percent for seafood, with
a standard deviation of 1.0, 0.6, and 1.6 percent, respectively.
There is 90% confidence that the population percentage of
spoiled food average is between 9.4 and 9.7 percent for fruits
and vegetables, 6.3 and 6.5 percent for meat and poultry, and
12.6 and 13.1 percent for seafood.
Conclusion
Using the sampling and data collection plan, Tarlich was able to
collect information for the sample of shipments needed. Once
the information was gathered and divided into the determined
groups, Tarlich performes descriptive statistics on the data.
Interpretation of the descriptive statistics has helped Tarlich
supermarket calculate what the spoil rate for their different
perishables are. The research study will continue on to
determine a course of action for the store.Appendix A: Raw
Data
Appendix A: Raw Data Continued
Day
sample
taken
Fruits And
Vegetables
Meat and
Poultry
Seafood
Fruits And
Vegetables
Meat and
Poultry
Seafood
Fruits And
Vegetables
Meat and
Poultry
Seafood
mon1801808017.211.210.29.6%6.2%12.8%
sun1901909016.49.812.38.6%5.2%13.7%
sat20020010020.312.311.510.2%6.2%11.5%
fri
20020010016.513.212.28.3%6.6%12.2%
thurs1901909018.411.59.89.7%6.1%10.9%
wed1801808019.712.610.910.9%7.0%13.6%
tues1801808019.612.012.510.9%6.7%15.6%
mon1801808020.111.910.411.2%6.6%13.0%
sun1901909017.912.311.79.4%6.5%13.0%
sat20020010016.512.99.98.3%6.5%9.9%
fri20020010016.411.410.88.2%5.7%10.8%
thurs1901909020.39.911.510.7%5.2%12.8%
wed1801808016.513.112.29.2%7.3%15.3%
tues1801808019.612.712.210.9%7.1%15.3%
mon1801808020.111.69.811.2%6.4%12.3%
sun1901909017.99.810.99.4%5.2%12.1%
sat20020010017.912.312.59.0%6.2%12.5%
fri20020010016.512.910.98.3%6.5%10.9%
thurs1901909016.411.412.58.6%6.0%13.9%
wed1801808017.29.910.49.6%5.5%13.0%
tues1801808016.413.111.79.1%7.3%14.6%
mon1801808020.311.99.911.3%6.6%12.4%
sun1901909016.512.310.88.7%6.5%12.0%
sat20020010019.712.912.39.9%6.5%12.3%
fri20020010019.612.311.59.8%6.2%11.5%
thurs1901909020.112.912.210.6%6.8%13.6%
wed1801808017.911.412.59.9%6.3%15.6%
tues1801808016.59.910.49.2%5.5%13.0%
mon1801808016.413.111.79.1%7.3%14.6%
sun1901909020.312.79.910.7%6.7%11.0%
sat20020010020.311.610.810.2%5.8%10.8%
fri20020010016.512.311.58.3%6.2%11.5%
thurs1901909019.713.212.210.4%6.9%13.6%
wed1801808019.611.512.210.9%6.4%15.3%
tues1801808016.512.610.49.2%7.0%13.0%
mon1801808016.412.011.79.1%6.7%14.6%
sun1901909017.211.99.99.1%6.3%11.0%
sat20020010016.412.310.88.2%6.2%10.8%
fri20020010020.312.912.310.2%6.5%12.3%
thurs1901909016.511.411.58.7%6.0%12.8%
wed1801808016.59.912.29.2%5.5%15.3%
tues1801808019.713.112.510.9%7.3%15.6%
mon1801808019.613.110.410.9%7.3%13.0%
sun1901909016.512.711.78.7%6.7%13.0%
sat20020010016.411.69.98.2%5.8%9.9%
fri20020010017.212.310.88.6%6.2%10.8%
thurs1901909016.512.011.58.7%6.3%12.8%
wed1801808016.511.912.29.2%6.6%15.3%
tues1801808019.712.312.210.9%6.8%15.3%
mon1801808020.312.910.411.3%7.2%13.0%
sun1901909016.511.411.78.7%6.0%13.0%
sat20020010019.79.99.99.9%5.0%9.9%
fri20020010019.612.710.89.8%6.4%10.8%
thurs1901909020.111.612.310.6%6.1%13.7%
wed1801808019.712.310.810.9%6.8%13.5%
tues1801808020.312.011.511.3%6.7%14.4%
mon1801808016.511.912.29.2%6.6%15.3%
sun1901909016.412.312.28.6%6.5%13.6%
sat20020010017.212.39.88.6%6.2%9.8%
fri20020010016.512.910.98.3%6.5%10.9%
thurs1901909016.511.412.58.7%6.0%13.9%
wed1801808019.79.912.210.9%5.5%15.3%
tues1801808020.312.710.411.3%7.1%13.0%
mon1801808020.111.611.711.2%6.4%14.6%
sun1901909019.712.310.910.4%6.5%12.1%
sat20020010020.311.612.510.2%5.8%12.5%
fri20020010016.512.312.28.3%6.2%12.2%
thurs1901909016.412.010.48.6%6.3%11.6%
wed1801808017.211.912.29.6%6.6%15.3%
tues1801808016.512.310.49.2%6.8%13.0%
mon1801808017.212.311.79.6%6.8%14.6%
sun1901909016.512.99.98.7%6.8%11.0%
sat20020010016.511.410.88.3%5.7%10.8%
fri20020010019.79.912.39.9%5.0%12.3%
thurs1901909020.312.710.810.7%6.7%12.0%
wed1801808016.512.99.89.2%7.2%12.3%
tues1801808016.411.410.99.1%6.3%13.6%
mon1801808017.29.912.59.6%5.5%15.6%
sun1901909016.513.112.28.7%6.9%13.6%
sat20020010017.212.710.48.6%6.4%10.4%
fri20020010016.511.612.28.3%5.8%12.2%
thurs1901909016.512.310.48.7%6.5%11.6%
wed1801808019.713.211.710.9%7.3%14.6%
tues1801808020.312.39.911.3%6.8%12.4%
mon1801808016.512.310.89.2%6.8%13.5%
sun1901909016.412.912.38.6%6.8%13.7%
sat20020010016.511.410.88.3%5.7%10.8%
fri20020010016.49.912.28.2%5.0%12.2%
thurs1901909017.212.710.49.1%6.7%11.6%
wed1801808016.512.911.79.2%7.2%14.6%
tues1801808017.211.49.99.6%6.3%12.4%
mon1801808016.59.910.89.2%5.5%13.5%
sun1901909016.513.112.38.7%6.9%13.7%
sat20020010019.712.310.89.9%6.2%10.8%
fri20020010020.312.912.210.2%6.5%12.2%
thurs1901909016.511.410.48.7%6.0%11.6%
wed1801808016.59.911.79.2%5.5%14.6%
tues1801808019.712.710.810.9%7.1%13.5%
mon1801808020.311.612.311.3%6.4%15.4%
sun1901909016.512.310.88.7%6.5%12.0%
Weight (lb) arrived in shipment
Weight (lb) thrown away due to
spoilage
Percentage thrown away
Appendix B: Histograms
Day
sample
taken
Fruits And
Vegetables
Meat and
Poultry
Seafood
Fruits And
Vegetables
Meat and
Poultry
Seafood
Fruits And
Vegetables
Meat and
Poultry
Seafood
mon1801808017.211.210.29.6%6.2%12.8%
sun1901909016.49.812.38.6%5.2%13.7%
sat20020010020.312.311.510.2%6.2%11.5%
fri
20020010016.513.212.28.3%6.6%12.2%
thurs1901909018.411.59.89.7%6.1%10.9%
wed1801808019.712.610.910.9%7.0%13.6%
tues1801808019.612.012.510.9%6.7%15.6%
mon1801808020.111.910.411.2%6.6%13.0%
sun1901909017.912.311.79.4%6.5%13.0%
sat20020010016.512.99.98.3%6.5%9.9%
fri20020010016.411.410.88.2%5.7%10.8%
thurs1901909020.39.911.510.7%5.2%12.8%
wed1801808016.513.112.29.2%7.3%15.3%
tues1801808019.612.712.210.9%7.1%15.3%
mon1801808020.111.69.811.2%6.4%12.3%
sun1901909017.99.810.99.4%5.2%12.1%
sat20020010017.912.312.59.0%6.2%12.5%
fri20020010016.512.910.98.3%6.5%10.9%
thurs1901909016.411.412.58.6%6.0%13.9%
wed1801808017.29.910.49.6%5.5%13.0%
tues1801808016.413.111.79.1%7.3%14.6%
mon1801808020.311.99.911.3%6.6%12.4%
sun1901909016.512.310.88.7%6.5%12.0%
sat20020010019.712.912.39.9%6.5%12.3%
fri20020010019.612.311.59.8%6.2%11.5%
thurs1901909020.112.912.210.6%6.8%13.6%
wed1801808017.911.412.59.9%6.3%15.6%
tues1801808016.59.910.49.2%5.5%13.0%
mon1801808016.413.111.79.1%7.3%14.6%
sun1901909020.312.79.910.7%6.7%11.0%
sat20020010020.311.610.810.2%5.8%10.8%
fri20020010016.512.311.58.3%6.2%11.5%
thurs1901909019.713.212.210.4%6.9%13.6%
wed1801808019.611.512.210.9%6.4%15.3%
tues1801808016.512.610.49.2%7.0%13.0%
mon1801808016.412.011.79.1%6.7%14.6%
sun1901909017.211.99.99.1%6.3%11.0%
sat20020010016.412.310.88.2%6.2%10.8%
fri20020010020.312.912.310.2%6.5%12.3%
thurs1901909016.511.411.58.7%6.0%12.8%
wed1801808016.59.912.29.2%5.5%15.3%
tues1801808019.713.112.510.9%7.3%15.6%
mon1801808019.613.110.410.9%7.3%13.0%
sun1901909016.512.711.78.7%6.7%13.0%
sat20020010016.411.69.98.2%5.8%9.9%
fri20020010017.212.310.88.6%6.2%10.8%
thurs1901909016.512.011.58.7%6.3%12.8%
wed1801808016.511.912.29.2%6.6%15.3%
tues1801808019.712.312.210.9%6.8%15.3%
mon1801808020.312.910.411.3%7.2%13.0%
sun1901909016.511.411.78.7%6.0%13.0%
sat20020010019.79.99.99.9%5.0%9.9%
fri20020010019.612.710.89.8%6.4%10.8%
thurs1901909020.111.612.310.6%6.1%13.7%
wed1801808019.712.310.810.9%6.8%13.5%
tues1801808020.312.011.511.3%6.7%14.4%
mon1801808016.511.912.29.2%6.6%15.3%
sun1901909016.412.312.28.6%6.5%13.6%
sat20020010017.212.39.88.6%6.2%9.8%
fri20020010016.512.910.98.3%6.5%10.9%
thurs1901909016.511.412.58.7%6.0%13.9%
wed1801808019.79.912.210.9%5.5%15.3%
tues1801808020.312.710.411.3%7.1%13.0%
mon1801808020.111.611.711.2%6.4%14.6%
sun1901909019.712.310.910.4%6.5%12.1%
sat20020010020.311.612.510.2%5.8%12.5%
fri20020010016.512.312.28.3%6.2%12.2%
thurs1901909016.412.010.48.6%6.3%11.6%
wed1801808017.211.912.29.6%6.6%15.3%
tues1801808016.512.310.49.2%6.8%13.0%
mon1801808017.212.311.79.6%6.8%14.6%
sun1901909016.512.99.98.7%6.8%11.0%
sat20020010016.511.410.88.3%5.7%10.8%
fri20020010019.79.912.39.9%5.0%12.3%
thurs1901909020.312.710.810.7%6.7%12.0%
wed1801808016.512.99.89.2%7.2%12.3%
tues1801808016.411.410.99.1%6.3%13.6%
mon1801808017.29.912.59.6%5.5%15.6%
sun1901909016.513.112.28.7%6.9%13.6%
sat20020010017.212.710.48.6%6.4%10.4%
fri20020010016.511.612.28.3%5.8%12.2%
thurs1901909016.512.310.48.7%6.5%11.6%
wed1801808019.713.211.710.9%7.3%14.6%
tues1801808020.312.39.911.3%6.8%12.4%
mon1801808016.512.310.89.2%6.8%13.5%
sun1901909016.412.912.38.6%6.8%13.7%
sat20020010016.511.410.88.3%5.7%10.8%
fri20020010016.49.912.28.2%5.0%12.2%
thurs1901909017.212.710.49.1%6.7%11.6%
wed1801808016.512.911.79.2%7.2%14.6%
tues1801808017.211.49.99.6%6.3%12.4%
mon1801808016.59.910.89.2%5.5%13.5%
sun1901909016.513.112.38.7%6.9%13.7%
sat20020010019.712.310.89.9%6.2%10.8%
fri20020010020.312.912.210.2%6.5%12.2%
thurs1901909016.511.410.48.7%6.0%11.6%
wed1801808016.59.911.79.2%5.5%14.6%
tues1801808019.712.710.810.9%7.1%13.5%
mon1801808020.311.612.311.3%6.4%15.4%
sun1901909016.512.310.88.7%6.5%12.0%
Weight (lb) arrived in shipment
Weight (lb) thrown away due to
spoilage
Percentage thrown away
Appendix C: Descriptive Statistics
Percentage of Fruits and Vegetables Thrown Away Due to
Spoilage
Central Tendency: Mean = 9.5%
Dispersion: Standard Deviation = 1.0%
Number: 100
Min/Max: 8.2% and 11.3%
Confidence Interval: 9.4% to 9.7%
Percentage of Meat and Poultry Thrown Away Due to Spoilage
Central Tendency: Mean = 6.4%
Dispersion: Standard Deviation = 0.6%
Number: 100
Min/Max: 5.0% and 7.3%
Confidence Interval: 6.3% to 6.5%
Percentage of Seafood Thrown Away Due to Spoilage
Central Tendency: Mean = 12.9%
Dispersion: Standard Deviation = 1.6%
Number: 100
Min/Max: 9.8% and 15.6%
Confidence Interval: 12.6% to 13.1%
Content and Development
4 Points
Points Earned
3.8/4
Additional Comments:
All key elements of the assignment are covered in a substantive
way, including:
· Excel Spreadsheet was created.
· Variables are listed.
· Descriptive stats provided
· Applicable charts/graphs displayed..
· Interpretation of statistics given.
Good job. See comments above.
Readability, Style, and Mechanics
1 Point
Points Earned
.95 /1
Additional Comments:
Sentences are complete, clear, and concise. Rules of grammar
are followed.
See correct format for figures and tables in Center for Writing
Excellence. (Title, labels, location etc)
The paper, including the title page, reference page, tables, and
appendixes, follows APA formatting guidelines, including
effective use of style.
The paper is no more than 700 words.
Total
5 Points
Points Earned
4.75/5
Overall Comments:
�Not yet, really. This is inferential statistics.
�Do you want to consider a two-tailed test? It would be good
for Tarlich if they were lower, right?
�No! Why do you say this?
Normality is quite an assumption.
Generally to determine normality you would have to look at a
frequency histogram. You would divide the variable pounds
into intervals of say 100. How many shipments were between
24 and 25 hundred pounds? How may were between 25 and 26?
26 and 27? Etc.
Then you plot a frequency distribution . If it is bell shaped,
then the data is approximately normal.
�A question to consider as a team is whether this division of
food types should give way to 3 separate research questions.
Generally, stratified sampling is used to make sure each
subgroup is represented in one population. The population
parameter applies to all the subgroups. Here it seems that the
various food groups should and do have different shelf lives. Is
it fair to lump them into one percentage that describes all
perishable items?
Your call. You could argue either way.
�None of these “bar graphs” are bell shaped.
SHORT TITLE OF PAPER
1
Running head: DESCRIPTIVE STATISTICS
1Descriptive StatisticsNameQNT/561
Date
Instructor’s NameDescriptive Statistics
Determine the appropriate descriptive statistics.
Note: If the data was normally distributed, use the mean and
standard deviation. If the data was skewed significantly, use the
median and interquartile range.
Numeric Variable Name1
Distribution: State if not normally distributed
Central Tendency:
Dispersion:
Number:
Min/Max:
Confidence Interval: (if distribution is normal)
Numeric Variable Name2 (if applicable)
Distribution: State if not normally distributed
Central Tendency:
Dispersion:
Number:
Min/Max:
Confidence Interval: (if distribution is normal)
Attribute Variable Name (if applicable)
Create a bar chart. Describe the proportions.
Descriptive Statistics Interpretation
Numeric Variable Name1
Describe the variable in laymen terms.
Numeric Variable Name2 (if applicable)
Describe the variable in laymen terms.
Appendix A
Raw data used in the analysis
Fit data to one page.
Appendix B
Charts and Tables
This part of the paper will include items that are then cited in
the body of the paper. Usually, large items are placed here not
to distract from reading the paper.
Appendix C
Descriptive Statistics
This part of the paper will include descriptive statistics.
Individual Assignment
Think about your learning team's research question and figure
out what data would need to be collected from the sample, so
that the organization has the information necessary to solve its
dilemmas.
Create a Microsoft® Excel® spreadsheet with data for the
variables that you deem necessary. The data may come from an
existing data set (textbook, online) or it may be data that you
pretend to collect from your sample.
Analyze the data with Microsoft® Excel® or other statistical
tool(s), including:
· Descriptive stats for each numeric variable
· Histogram for each numeric variable
· Bar chart for each attribute (non numeric) variable
· Scatter plot if the data contains two numeric variables
Determine the appropriate descriptive statistics.
· For normally distributed data use the mean and standard
deviation.
· For significantly skewed data use the median and interquartile
range.
Use theIndividual Methodology Findings Templateto complete
the descriptive statistics. Use the Descriptive Statistics and
Interpretation Exampleto develop an interpretation of the
descriptive statistics. Also use the sample papers that you will
find in my discussion post below.
Format your paper consistent with APA and UoPX writing
guidelines for this level course.
Submit both the spreadsheet and the completed Individual
Methodology Findings Template to the Assignment Files tab..

More Related Content

Similar to 4Running Head WEEK 2 TEAM ASSIGNMENTBusiness Re.docx

Published by Flat World Knowledge, Inc.© 2014 by Flat .docx
Published by Flat World Knowledge, Inc.© 2014 by Flat .docxPublished by Flat World Knowledge, Inc.© 2014 by Flat .docx
Published by Flat World Knowledge, Inc.© 2014 by Flat .docxamrit47
 
NETFLIX SITUATION ANALYSIS
NETFLIX SITUATION ANALYSISNETFLIX SITUATION ANALYSIS
NETFLIX SITUATION ANALYSISDalesmy Gonzalez
 
Use of Analytics by Netflix - Case Study
Use of Analytics by Netflix - Case StudyUse of Analytics by Netflix - Case Study
Use of Analytics by Netflix - Case StudySaket Toshniwal
 
Marketing management power slide usa 2022
Marketing management power slide usa 2022Marketing management power slide usa 2022
Marketing management power slide usa 2022ShashwatAgnivanshi
 
eMarketer Webinar: The Evolving Online Video Landscape
eMarketer Webinar: The Evolving Online Video LandscapeeMarketer Webinar: The Evolving Online Video Landscape
eMarketer Webinar: The Evolving Online Video LandscapeeMarketer
 
Netflix failure & marketing strategy
Netflix   failure & marketing strategyNetflix   failure & marketing strategy
Netflix failure & marketing strategyAshutosh Sahu
 
Netflix a company that did well in recession
Netflix   a company that did well in recessionNetflix   a company that did well in recession
Netflix a company that did well in recessionAmritpal Singh Bedi
 
Increasing Netflix's Revenue, Issue, Analysis, and Recommendations
Increasing Netflix's Revenue, Issue, Analysis, and RecommendationsIncreasing Netflix's Revenue, Issue, Analysis, and Recommendations
Increasing Netflix's Revenue, Issue, Analysis, and RecommendationsEmilyAnneFletcher
 
Increasing Netflix's Revenue, Issue, Analysis, and Recommendation
Increasing Netflix's Revenue, Issue, Analysis, and RecommendationIncreasing Netflix's Revenue, Issue, Analysis, and Recommendation
Increasing Netflix's Revenue, Issue, Analysis, and RecommendationEmilyAnneFletcher
 
One More Episode An Industry and Competitive Analysis for Netfl.docx
One More Episode An Industry and Competitive Analysis for Netfl.docxOne More Episode An Industry and Competitive Analysis for Netfl.docx
One More Episode An Industry and Competitive Analysis for Netfl.docxhopeaustin33688
 
Untitled presentation
Untitled presentationUntitled presentation
Untitled presentationFrank Tufano
 
Netflix-Case Study-- When a Pioneer Has to Reinvent Itself
Netflix-Case Study-- When a Pioneer Has to Reinvent Itself Netflix-Case Study-- When a Pioneer Has to Reinvent Itself
Netflix-Case Study-- When a Pioneer Has to Reinvent Itself James Rothaar
 
Page 1 of 5Strategy in Practice Assignment #2Chapter 4EV.docx
Page 1 of 5Strategy in Practice Assignment #2Chapter 4EV.docxPage 1 of 5Strategy in Practice Assignment #2Chapter 4EV.docx
Page 1 of 5Strategy in Practice Assignment #2Chapter 4EV.docxalfred4lewis58146
 

Similar to 4Running Head WEEK 2 TEAM ASSIGNMENTBusiness Re.docx (20)

Published by Flat World Knowledge, Inc.© 2014 by Flat .docx
Published by Flat World Knowledge, Inc.© 2014 by Flat .docxPublished by Flat World Knowledge, Inc.© 2014 by Flat .docx
Published by Flat World Knowledge, Inc.© 2014 by Flat .docx
 
Netflix
NetflixNetflix
Netflix
 
Netflix: An Analysis
Netflix: An AnalysisNetflix: An Analysis
Netflix: An Analysis
 
NETFLIX SITUATION ANALYSIS
NETFLIX SITUATION ANALYSISNETFLIX SITUATION ANALYSIS
NETFLIX SITUATION ANALYSIS
 
Use of Analytics by Netflix - Case Study
Use of Analytics by Netflix - Case StudyUse of Analytics by Netflix - Case Study
Use of Analytics by Netflix - Case Study
 
Marketing management power slide usa 2022
Marketing management power slide usa 2022Marketing management power slide usa 2022
Marketing management power slide usa 2022
 
eMarketer Webinar: The Evolving Online Video Landscape
eMarketer Webinar: The Evolving Online Video LandscapeeMarketer Webinar: The Evolving Online Video Landscape
eMarketer Webinar: The Evolving Online Video Landscape
 
Netflix failure & marketing strategy
Netflix   failure & marketing strategyNetflix   failure & marketing strategy
Netflix failure & marketing strategy
 
Netflix a company that did well in recession
Netflix   a company that did well in recessionNetflix   a company that did well in recession
Netflix a company that did well in recession
 
Increasing Netflix's Revenue, Issue, Analysis, and Recommendations
Increasing Netflix's Revenue, Issue, Analysis, and RecommendationsIncreasing Netflix's Revenue, Issue, Analysis, and Recommendations
Increasing Netflix's Revenue, Issue, Analysis, and Recommendations
 
Increasing Netflix's Revenue, Issue, Analysis, and Recommendation
Increasing Netflix's Revenue, Issue, Analysis, and RecommendationIncreasing Netflix's Revenue, Issue, Analysis, and Recommendation
Increasing Netflix's Revenue, Issue, Analysis, and Recommendation
 
junior- netflix
junior- netflixjunior- netflix
junior- netflix
 
Verizon FiOS IMC Paper
Verizon FiOS IMC PaperVerizon FiOS IMC Paper
Verizon FiOS IMC Paper
 
One More Episode An Industry and Competitive Analysis for Netfl.docx
One More Episode An Industry and Competitive Analysis for Netfl.docxOne More Episode An Industry and Competitive Analysis for Netfl.docx
One More Episode An Industry and Competitive Analysis for Netfl.docx
 
Untitled presentation
Untitled presentationUntitled presentation
Untitled presentation
 
Netflix-Case Study-- When a Pioneer Has to Reinvent Itself
Netflix-Case Study-- When a Pioneer Has to Reinvent Itself Netflix-Case Study-- When a Pioneer Has to Reinvent Itself
Netflix-Case Study-- When a Pioneer Has to Reinvent Itself
 
Netflix Case Study
Netflix Case StudyNetflix Case Study
Netflix Case Study
 
Netflix (nflx)
Netflix (nflx)Netflix (nflx)
Netflix (nflx)
 
Netflix
Netflix Netflix
Netflix
 
Page 1 of 5Strategy in Practice Assignment #2Chapter 4EV.docx
Page 1 of 5Strategy in Practice Assignment #2Chapter 4EV.docxPage 1 of 5Strategy in Practice Assignment #2Chapter 4EV.docx
Page 1 of 5Strategy in Practice Assignment #2Chapter 4EV.docx
 

More from alinainglis

· Present a discussion of what team is. What type(s) of team do .docx
· Present a discussion of what team is. What type(s) of team do .docx· Present a discussion of what team is. What type(s) of team do .docx
· Present a discussion of what team is. What type(s) of team do .docxalinainglis
 
· Presentation of your project. Prepare a PowerPoint with 8 slid.docx
· Presentation of your project. Prepare a PowerPoint with 8 slid.docx· Presentation of your project. Prepare a PowerPoint with 8 slid.docx
· Presentation of your project. Prepare a PowerPoint with 8 slid.docxalinainglis
 
· Prepare a research proposal, mentioning a specific researchabl.docx
· Prepare a research proposal, mentioning a specific researchabl.docx· Prepare a research proposal, mentioning a specific researchabl.docx
· Prepare a research proposal, mentioning a specific researchabl.docxalinainglis
 
· Previous professional experiences that have had a profound.docx
· Previous professional experiences that have had a profound.docx· Previous professional experiences that have had a profound.docx
· Previous professional experiences that have had a profound.docxalinainglis
 
· Please select ONE of the following questions and write a 200-wor.docx
· Please select ONE of the following questions and write a 200-wor.docx· Please select ONE of the following questions and write a 200-wor.docx
· Please select ONE of the following questions and write a 200-wor.docxalinainglis
 
· Please use Firefox for access to cronometer.com16 ye.docx
· Please use Firefox for access to cronometer.com16 ye.docx· Please use Firefox for access to cronometer.com16 ye.docx
· Please use Firefox for access to cronometer.com16 ye.docxalinainglis
 
· Please share theoretical explanations based on social, cultural an.docx
· Please share theoretical explanations based on social, cultural an.docx· Please share theoretical explanations based on social, cultural an.docx
· Please share theoretical explanations based on social, cultural an.docxalinainglis
 
· If we accept the fact that we may need to focus more on teaching.docx
· If we accept the fact that we may need to focus more on teaching.docx· If we accept the fact that we may need to focus more on teaching.docx
· If we accept the fact that we may need to focus more on teaching.docxalinainglis
 
· How many employees are working for youtotal of 5 employees .docx
· How many employees are working for youtotal of 5 employees  .docx· How many employees are working for youtotal of 5 employees  .docx
· How many employees are working for youtotal of 5 employees .docxalinainglis
 
· How should the risks be prioritized· Who should do the priori.docx
· How should the risks be prioritized· Who should do the priori.docx· How should the risks be prioritized· Who should do the priori.docx
· How should the risks be prioritized· Who should do the priori.docxalinainglis
 
· How does the distribution mechanism control the issues address.docx
· How does the distribution mechanism control the issues address.docx· How does the distribution mechanism control the issues address.docx
· How does the distribution mechanism control the issues address.docxalinainglis
 
· Helen Petrakis Identifying Data Helen Petrakis is a 5.docx
· Helen Petrakis Identifying Data Helen Petrakis is a 5.docx· Helen Petrakis Identifying Data Helen Petrakis is a 5.docx
· Helen Petrakis Identifying Data Helen Petrakis is a 5.docxalinainglis
 
· Global O365 Tenant Settings relevant to SPO, and recommended.docx
· Global O365 Tenant Settings relevant to SPO, and recommended.docx· Global O365 Tenant Settings relevant to SPO, and recommended.docx
· Global O365 Tenant Settings relevant to SPO, and recommended.docxalinainglis
 
· Focus on the identified client within your chosen case.· Analy.docx
· Focus on the identified client within your chosen case.· Analy.docx· Focus on the identified client within your chosen case.· Analy.docx
· Focus on the identified client within your chosen case.· Analy.docxalinainglis
 
· Find current events regarding any issues in public health .docx
· Find current events regarding any issues in public health .docx· Find current events regarding any issues in public health .docx
· Find current events regarding any issues in public health .docxalinainglis
 
· Explore and assess different remote access solutions.Assig.docx
· Explore and assess different remote access solutions.Assig.docx· Explore and assess different remote access solutions.Assig.docx
· Explore and assess different remote access solutions.Assig.docxalinainglis
 
· FASB ASC & GARS Login credentials LinkUser ID AAA51628Pas.docx
· FASB ASC & GARS Login credentials LinkUser ID AAA51628Pas.docx· FASB ASC & GARS Login credentials LinkUser ID AAA51628Pas.docx
· FASB ASC & GARS Login credentials LinkUser ID AAA51628Pas.docxalinainglis
 
· Due Sat. Sep. · Format Typed, double-spaced, sub.docx
· Due Sat. Sep. · Format Typed, double-spaced, sub.docx· Due Sat. Sep. · Format Typed, double-spaced, sub.docx
· Due Sat. Sep. · Format Typed, double-spaced, sub.docxalinainglis
 
· Expectations for Power Point Presentations in Units IV and V I.docx
· Expectations for Power Point Presentations in Units IV and V I.docx· Expectations for Power Point Presentations in Units IV and V I.docx
· Expectations for Power Point Presentations in Units IV and V I.docxalinainglis
 
· Due Friday by 1159pmResearch Paper--IssueTopic Ce.docx
· Due Friday by 1159pmResearch Paper--IssueTopic Ce.docx· Due Friday by 1159pmResearch Paper--IssueTopic Ce.docx
· Due Friday by 1159pmResearch Paper--IssueTopic Ce.docxalinainglis
 

More from alinainglis (20)

· Present a discussion of what team is. What type(s) of team do .docx
· Present a discussion of what team is. What type(s) of team do .docx· Present a discussion of what team is. What type(s) of team do .docx
· Present a discussion of what team is. What type(s) of team do .docx
 
· Presentation of your project. Prepare a PowerPoint with 8 slid.docx
· Presentation of your project. Prepare a PowerPoint with 8 slid.docx· Presentation of your project. Prepare a PowerPoint with 8 slid.docx
· Presentation of your project. Prepare a PowerPoint with 8 slid.docx
 
· Prepare a research proposal, mentioning a specific researchabl.docx
· Prepare a research proposal, mentioning a specific researchabl.docx· Prepare a research proposal, mentioning a specific researchabl.docx
· Prepare a research proposal, mentioning a specific researchabl.docx
 
· Previous professional experiences that have had a profound.docx
· Previous professional experiences that have had a profound.docx· Previous professional experiences that have had a profound.docx
· Previous professional experiences that have had a profound.docx
 
· Please select ONE of the following questions and write a 200-wor.docx
· Please select ONE of the following questions and write a 200-wor.docx· Please select ONE of the following questions and write a 200-wor.docx
· Please select ONE of the following questions and write a 200-wor.docx
 
· Please use Firefox for access to cronometer.com16 ye.docx
· Please use Firefox for access to cronometer.com16 ye.docx· Please use Firefox for access to cronometer.com16 ye.docx
· Please use Firefox for access to cronometer.com16 ye.docx
 
· Please share theoretical explanations based on social, cultural an.docx
· Please share theoretical explanations based on social, cultural an.docx· Please share theoretical explanations based on social, cultural an.docx
· Please share theoretical explanations based on social, cultural an.docx
 
· If we accept the fact that we may need to focus more on teaching.docx
· If we accept the fact that we may need to focus more on teaching.docx· If we accept the fact that we may need to focus more on teaching.docx
· If we accept the fact that we may need to focus more on teaching.docx
 
· How many employees are working for youtotal of 5 employees .docx
· How many employees are working for youtotal of 5 employees  .docx· How many employees are working for youtotal of 5 employees  .docx
· How many employees are working for youtotal of 5 employees .docx
 
· How should the risks be prioritized· Who should do the priori.docx
· How should the risks be prioritized· Who should do the priori.docx· How should the risks be prioritized· Who should do the priori.docx
· How should the risks be prioritized· Who should do the priori.docx
 
· How does the distribution mechanism control the issues address.docx
· How does the distribution mechanism control the issues address.docx· How does the distribution mechanism control the issues address.docx
· How does the distribution mechanism control the issues address.docx
 
· Helen Petrakis Identifying Data Helen Petrakis is a 5.docx
· Helen Petrakis Identifying Data Helen Petrakis is a 5.docx· Helen Petrakis Identifying Data Helen Petrakis is a 5.docx
· Helen Petrakis Identifying Data Helen Petrakis is a 5.docx
 
· Global O365 Tenant Settings relevant to SPO, and recommended.docx
· Global O365 Tenant Settings relevant to SPO, and recommended.docx· Global O365 Tenant Settings relevant to SPO, and recommended.docx
· Global O365 Tenant Settings relevant to SPO, and recommended.docx
 
· Focus on the identified client within your chosen case.· Analy.docx
· Focus on the identified client within your chosen case.· Analy.docx· Focus on the identified client within your chosen case.· Analy.docx
· Focus on the identified client within your chosen case.· Analy.docx
 
· Find current events regarding any issues in public health .docx
· Find current events regarding any issues in public health .docx· Find current events regarding any issues in public health .docx
· Find current events regarding any issues in public health .docx
 
· Explore and assess different remote access solutions.Assig.docx
· Explore and assess different remote access solutions.Assig.docx· Explore and assess different remote access solutions.Assig.docx
· Explore and assess different remote access solutions.Assig.docx
 
· FASB ASC & GARS Login credentials LinkUser ID AAA51628Pas.docx
· FASB ASC & GARS Login credentials LinkUser ID AAA51628Pas.docx· FASB ASC & GARS Login credentials LinkUser ID AAA51628Pas.docx
· FASB ASC & GARS Login credentials LinkUser ID AAA51628Pas.docx
 
· Due Sat. Sep. · Format Typed, double-spaced, sub.docx
· Due Sat. Sep. · Format Typed, double-spaced, sub.docx· Due Sat. Sep. · Format Typed, double-spaced, sub.docx
· Due Sat. Sep. · Format Typed, double-spaced, sub.docx
 
· Expectations for Power Point Presentations in Units IV and V I.docx
· Expectations for Power Point Presentations in Units IV and V I.docx· Expectations for Power Point Presentations in Units IV and V I.docx
· Expectations for Power Point Presentations in Units IV and V I.docx
 
· Due Friday by 1159pmResearch Paper--IssueTopic Ce.docx
· Due Friday by 1159pmResearch Paper--IssueTopic Ce.docx· Due Friday by 1159pmResearch Paper--IssueTopic Ce.docx
· Due Friday by 1159pmResearch Paper--IssueTopic Ce.docx
 

Recently uploaded

Crayon Activity Handout For the Crayon A
Crayon Activity Handout For the Crayon ACrayon Activity Handout For the Crayon A
Crayon Activity Handout For the Crayon AUnboundStockton
 
call girls in Kamla Market (DELHI) 🔝 >༒9953330565🔝 genuine Escort Service 🔝✔️✔️
call girls in Kamla Market (DELHI) 🔝 >༒9953330565🔝 genuine Escort Service 🔝✔️✔️call girls in Kamla Market (DELHI) 🔝 >༒9953330565🔝 genuine Escort Service 🔝✔️✔️
call girls in Kamla Market (DELHI) 🔝 >༒9953330565🔝 genuine Escort Service 🔝✔️✔️9953056974 Low Rate Call Girls In Saket, Delhi NCR
 
Computed Fields and api Depends in the Odoo 17
Computed Fields and api Depends in the Odoo 17Computed Fields and api Depends in the Odoo 17
Computed Fields and api Depends in the Odoo 17Celine George
 
Call Girls in Dwarka Mor Delhi Contact Us 9654467111
Call Girls in Dwarka Mor Delhi Contact Us 9654467111Call Girls in Dwarka Mor Delhi Contact Us 9654467111
Call Girls in Dwarka Mor Delhi Contact Us 9654467111Sapana Sha
 
Class 11 Legal Studies Ch-1 Concept of State .pdf
Class 11 Legal Studies Ch-1 Concept of State .pdfClass 11 Legal Studies Ch-1 Concept of State .pdf
Class 11 Legal Studies Ch-1 Concept of State .pdfakmcokerachita
 
Introduction to ArtificiaI Intelligence in Higher Education
Introduction to ArtificiaI Intelligence in Higher EducationIntroduction to ArtificiaI Intelligence in Higher Education
Introduction to ArtificiaI Intelligence in Higher Educationpboyjonauth
 
Painted Grey Ware.pptx, PGW Culture of India
Painted Grey Ware.pptx, PGW Culture of IndiaPainted Grey Ware.pptx, PGW Culture of India
Painted Grey Ware.pptx, PGW Culture of IndiaVirag Sontakke
 
भारत-रोम व्यापार.pptx, Indo-Roman Trade,
भारत-रोम व्यापार.pptx, Indo-Roman Trade,भारत-रोम व्यापार.pptx, Indo-Roman Trade,
भारत-रोम व्यापार.pptx, Indo-Roman Trade,Virag Sontakke
 
ECONOMIC CONTEXT - LONG FORM TV DRAMA - PPT
ECONOMIC CONTEXT - LONG FORM TV DRAMA - PPTECONOMIC CONTEXT - LONG FORM TV DRAMA - PPT
ECONOMIC CONTEXT - LONG FORM TV DRAMA - PPTiammrhaywood
 
Introduction to AI in Higher Education_draft.pptx
Introduction to AI in Higher Education_draft.pptxIntroduction to AI in Higher Education_draft.pptx
Introduction to AI in Higher Education_draft.pptxpboyjonauth
 
Alper Gobel In Media Res Media Component
Alper Gobel In Media Res Media ComponentAlper Gobel In Media Res Media Component
Alper Gobel In Media Res Media ComponentInMediaRes1
 
The Most Excellent Way | 1 Corinthians 13
The Most Excellent Way | 1 Corinthians 13The Most Excellent Way | 1 Corinthians 13
The Most Excellent Way | 1 Corinthians 13Steve Thomason
 
CARE OF CHILD IN INCUBATOR..........pptx
CARE OF CHILD IN INCUBATOR..........pptxCARE OF CHILD IN INCUBATOR..........pptx
CARE OF CHILD IN INCUBATOR..........pptxGaneshChakor2
 
EPANDING THE CONTENT OF AN OUTLINE using notes.pptx
EPANDING THE CONTENT OF AN OUTLINE using notes.pptxEPANDING THE CONTENT OF AN OUTLINE using notes.pptx
EPANDING THE CONTENT OF AN OUTLINE using notes.pptxRaymartEstabillo3
 
Final demo Grade 9 for demo Plan dessert.pptx
Final demo Grade 9 for demo Plan dessert.pptxFinal demo Grade 9 for demo Plan dessert.pptx
Final demo Grade 9 for demo Plan dessert.pptxAvyJaneVismanos
 
Enzyme, Pharmaceutical Aids, Miscellaneous Last Part of Chapter no 5th.pdf
Enzyme, Pharmaceutical Aids, Miscellaneous Last Part of Chapter no 5th.pdfEnzyme, Pharmaceutical Aids, Miscellaneous Last Part of Chapter no 5th.pdf
Enzyme, Pharmaceutical Aids, Miscellaneous Last Part of Chapter no 5th.pdfSumit Tiwari
 
How to Configure Email Server in Odoo 17
How to Configure Email Server in Odoo 17How to Configure Email Server in Odoo 17
How to Configure Email Server in Odoo 17Celine George
 
internship ppt on smartinternz platform as salesforce developer
internship ppt on smartinternz platform as salesforce developerinternship ppt on smartinternz platform as salesforce developer
internship ppt on smartinternz platform as salesforce developerunnathinaik
 

Recently uploaded (20)

Crayon Activity Handout For the Crayon A
Crayon Activity Handout For the Crayon ACrayon Activity Handout For the Crayon A
Crayon Activity Handout For the Crayon A
 
call girls in Kamla Market (DELHI) 🔝 >༒9953330565🔝 genuine Escort Service 🔝✔️✔️
call girls in Kamla Market (DELHI) 🔝 >༒9953330565🔝 genuine Escort Service 🔝✔️✔️call girls in Kamla Market (DELHI) 🔝 >༒9953330565🔝 genuine Escort Service 🔝✔️✔️
call girls in Kamla Market (DELHI) 🔝 >༒9953330565🔝 genuine Escort Service 🔝✔️✔️
 
Computed Fields and api Depends in the Odoo 17
Computed Fields and api Depends in the Odoo 17Computed Fields and api Depends in the Odoo 17
Computed Fields and api Depends in the Odoo 17
 
Call Girls in Dwarka Mor Delhi Contact Us 9654467111
Call Girls in Dwarka Mor Delhi Contact Us 9654467111Call Girls in Dwarka Mor Delhi Contact Us 9654467111
Call Girls in Dwarka Mor Delhi Contact Us 9654467111
 
Class 11 Legal Studies Ch-1 Concept of State .pdf
Class 11 Legal Studies Ch-1 Concept of State .pdfClass 11 Legal Studies Ch-1 Concept of State .pdf
Class 11 Legal Studies Ch-1 Concept of State .pdf
 
Introduction to ArtificiaI Intelligence in Higher Education
Introduction to ArtificiaI Intelligence in Higher EducationIntroduction to ArtificiaI Intelligence in Higher Education
Introduction to ArtificiaI Intelligence in Higher Education
 
Painted Grey Ware.pptx, PGW Culture of India
Painted Grey Ware.pptx, PGW Culture of IndiaPainted Grey Ware.pptx, PGW Culture of India
Painted Grey Ware.pptx, PGW Culture of India
 
9953330565 Low Rate Call Girls In Rohini Delhi NCR
9953330565 Low Rate Call Girls In Rohini  Delhi NCR9953330565 Low Rate Call Girls In Rohini  Delhi NCR
9953330565 Low Rate Call Girls In Rohini Delhi NCR
 
भारत-रोम व्यापार.pptx, Indo-Roman Trade,
भारत-रोम व्यापार.pptx, Indo-Roman Trade,भारत-रोम व्यापार.pptx, Indo-Roman Trade,
भारत-रोम व्यापार.pptx, Indo-Roman Trade,
 
ECONOMIC CONTEXT - LONG FORM TV DRAMA - PPT
ECONOMIC CONTEXT - LONG FORM TV DRAMA - PPTECONOMIC CONTEXT - LONG FORM TV DRAMA - PPT
ECONOMIC CONTEXT - LONG FORM TV DRAMA - PPT
 
Introduction to AI in Higher Education_draft.pptx
Introduction to AI in Higher Education_draft.pptxIntroduction to AI in Higher Education_draft.pptx
Introduction to AI in Higher Education_draft.pptx
 
TataKelola dan KamSiber Kecerdasan Buatan v022.pdf
TataKelola dan KamSiber Kecerdasan Buatan v022.pdfTataKelola dan KamSiber Kecerdasan Buatan v022.pdf
TataKelola dan KamSiber Kecerdasan Buatan v022.pdf
 
Alper Gobel In Media Res Media Component
Alper Gobel In Media Res Media ComponentAlper Gobel In Media Res Media Component
Alper Gobel In Media Res Media Component
 
The Most Excellent Way | 1 Corinthians 13
The Most Excellent Way | 1 Corinthians 13The Most Excellent Way | 1 Corinthians 13
The Most Excellent Way | 1 Corinthians 13
 
CARE OF CHILD IN INCUBATOR..........pptx
CARE OF CHILD IN INCUBATOR..........pptxCARE OF CHILD IN INCUBATOR..........pptx
CARE OF CHILD IN INCUBATOR..........pptx
 
EPANDING THE CONTENT OF AN OUTLINE using notes.pptx
EPANDING THE CONTENT OF AN OUTLINE using notes.pptxEPANDING THE CONTENT OF AN OUTLINE using notes.pptx
EPANDING THE CONTENT OF AN OUTLINE using notes.pptx
 
Final demo Grade 9 for demo Plan dessert.pptx
Final demo Grade 9 for demo Plan dessert.pptxFinal demo Grade 9 for demo Plan dessert.pptx
Final demo Grade 9 for demo Plan dessert.pptx
 
Enzyme, Pharmaceutical Aids, Miscellaneous Last Part of Chapter no 5th.pdf
Enzyme, Pharmaceutical Aids, Miscellaneous Last Part of Chapter no 5th.pdfEnzyme, Pharmaceutical Aids, Miscellaneous Last Part of Chapter no 5th.pdf
Enzyme, Pharmaceutical Aids, Miscellaneous Last Part of Chapter no 5th.pdf
 
How to Configure Email Server in Odoo 17
How to Configure Email Server in Odoo 17How to Configure Email Server in Odoo 17
How to Configure Email Server in Odoo 17
 
internship ppt on smartinternz platform as salesforce developer
internship ppt on smartinternz platform as salesforce developerinternship ppt on smartinternz platform as salesforce developer
internship ppt on smartinternz platform as salesforce developer
 

4Running Head WEEK 2 TEAM ASSIGNMENTBusiness Re.docx

  • 1. 4 Running Head: WEEK 2 TEAM ASSIGNMENT Business Research Project Part 1 Learning Team A Ly Bui, Tammy del Campo, La Shawn Herron-Guy, Claudia Hernandez, Janice Jenkins, Natasha O’Keefe QNT/561 April 11, 2016 Matthew Radio Flexnet Introduction The consumer product rental industry continues to grow and improve services beyond video stores, “Flexnet steers couch potatoes away from the video store to the mailbox or Internet. The company's more than 57 million subscribers in 50 countries can download movies or rent DVDs for a monthly fee through Flexnet.com” (Hoovers (2016) (para. 1). As the era changes, instead of DVD rental, the focus is on the fast-growing streaming service.
  • 2. Organizational Dilemma Flexnet seems to be successful with strong financial performance. However, Flexnet has faced pricing dilemmas. Many subscribers, investors questioned if Flexnet can develop a competitive market. With a need for a renewal its license, content, and agreements frequently; Flexnet is under pressure to reduce the prices with hiked licensing fees. Amazon Prime and Hulu are one of the main competitors of Flexnet, who stream their contents. Customers expect to get high-quality products at reasonable price. “…Management needs to find the best method to solve these dilemmas” (Business Insider, 2011). Variables Based on Business Dilemma Flexnet premium channel choose a survey to solicit scaled and closed-end responses by customers to determine interest in proposed streaming capabilities. Using the Internet via Facebook and Google AdWords to find respondents, the team commissioned an exploratory study to measure subscription interest in premium channels through Flexnet (independent variable), price structure (dependent variable) and premium channel offering possibilities (dependent variable). The design of the survey questions is causal — designed to determine if an asymmetrical relationship exists between the likelihood of customers’ subscription, channels offered, and monthly fee the client is willing to pay. The method of data collection employed was to collect responses from a sample of convenience from current customers who are on the internet. Whereas the reliability and validity provide challenges in evaluating, the independent status of Team A in the survey mitigates any perceived bias in the study. Research Objective Flexnet has determined the need to raise prices by 12.5 % = $1.00 or 25 % = $2.00 increases in the near future; it is important to provide data and research behind what impact this might have for current and new subscribers. Several important factors to consider when thinking of the price increase decisions are:
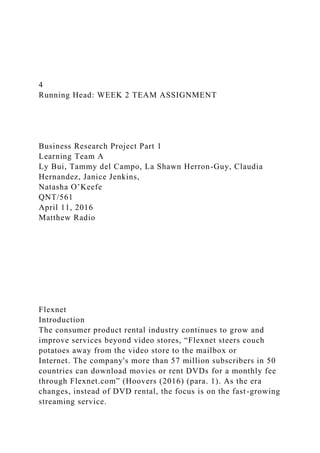
  • 3. 1. Flexnet’s costs 2. Flexnet profits 3. Market demand 4. Industry standards 5. Business Strategy 6. What experiences and service is wanted for the subscribers? 7. Customer expectations Flexnet has decided a survey would be the best possibility to obtain the data needed to make decisions. A few questions in Flexnet mind are for the survey could be: · Will current subscribers cancel? · What would be the cancellation impact? · Could there be something done to extend the current subscribers to be affected? (example: delay their subscription cost for a year or two years) · Will new subscribers enroll? · What would be your source of streaming if you cancel? Research Question and Sample Flexnet has delved into their subscriber's wants and needs and has invested in surveys as a platform to gauge their customer's satisfaction as well as their interest in competition, which come from premium channels such as; HBO, Starz, Cinemax, and other channels offering well-known movies and shows. The results of these surveys is as follows; Regarding satisfaction, the measurement included topics of streaming, DVDs, and overall experience. According to aytm, Flexnet is meeting the needs of their subscribers, “…it’s not surprising that 74.4% of Flexnet users said they are satisfied with their overall experience, and only 9.1% said they are unsatisfied” (Pilon, 2011). Conclusion The question of their likeness to Flexnet to that of competing premium channels was raised;
  • 4. The way people are choosing to watch their preferred programs and choice of movies is ever changing, as of now, Flexnet continues to reach out to their subscribers to ensure their needs and wants are being met. Conclusion Flexnet has continued to evolve and though they have increased their streaming, they do still offer three different packages to their subscribers for DVDs. This is an area they continue to survey. The question of whether or not this will continue to be a part of the company is something looked at often. References Business Insider. (2011). Flexnet's Big Licensing Dilemma. Retrieved from / http://www.businessinsider.com/Flexnets-big-licensing- dilemma-2011-7 GOTTFRIED, M. (2015). The Flexnet Problem: Which Media Company Will Solve / It? Retrieved from http://www.wsj.com/articles/the-Flexnet-problem-which-media-/ company-will-solve-it-1447609351 Hoover's. (2016). Retrieved from http://www.hoovers.com/company-information/cs/company-/ profile.Flexnet_Inc.f336f5bc15a31a6c.htm Pilon, A. (2011). aytm. Retrieved from https://aytm.com/blog/daily-survey-results/Flexnet-survey- subscribers-happy-with-overall-experience/ Measurement of Satisfaction
  • 5. Results Satisfied with Streaming Unsatisfied with streaming Satisfied with variety on DVD Unsatisfied with variety on DVDSatisfied with overall experience Unsatisfied with overall experience 0.65 0.31 0.71 0.08 0.74 0.09 As a Flexnet subscriber, how likely would you subscribe to premium channels (like HBO, Showtime, Starz, Cinemax) over Netflix? Percent Very Likely Somewhat Likely Uncertain Somewhat Unlikely Very unlikely 0.3 0.21 0.12 0.08 0.28999999999999998 1 Running Head: WEEK 3 TEAM ASSIGNMENT Flexnet The consumer product rental industry continues to grow and improve services beyond video stores. “Flexnet steers couch potatoes away from the video store to the mailbox or Internet. The company's more than 57 million subscribers in 50 countries can download movies or rent DVDs for a monthly fee through Flexnet.com” (Hoovers (2016) (para. 1). As the era changes, instead of DVD rental, Flexnet is focusing on its fast-growing overseas streaming service. A Brief History Flexnet was established 18 years ago on August 29, 1997. Its original premise was to offer America the convenience of having your movie rentals mailed to you vs. having to go to the rental store. In 2007, Flexnet introduced streaming to its line of services offered. Both services are provided with the business
  • 6. model of no late fees, a flat rate, and unlimited rentals or streaming. In 2013, flex net received some negative reviews on their streaming content. To the customers, it seemed that if you wanted to get the newest content the best way would be to get the DVD. Flexnet responded to the complaints by acknowledging the issue and stating quite frankly that it’s economical to get the rights to DVDs than to the stream. They also said that the way they choose what will be renewed or added is based on how many streams a movie or show gets. In the coming years with the popularity of streaming devices like Apple TV, Roku, and Amazon Fire and the use of applications for streaming Flexnet has had an increasing battle to stay competitive with content offered and prices charged. Dilemma that the Organization Might Face From the outside, Flexnet seems to be a successful company with strong financial performance. However, Flexnet has faced with pricing and licensing dilemmas. Many subscribers and investors questioned if the company can continue keeping its lead on video rental and streaming services. Flexnet has to renew its license, content, and agreements frequently. Due to the hiking renewal cost, Flexnet has to pay much higher than what they paid in previous years. The company is under pressure to increase the service fee without losing the established customers. If the company does not want to pay high licensing fees, it will lose many subscribers. Amazon Prime and Hulu are one of the main competitors of Flexnet, have the right to stream their contents. Nye (2011), “This leads up to Flexnet’s other biggest obstacle: distribution. The debate is no longer between DVDs and streaming, and the question is now who will offer the best platform from which to distribute the most desirable content” (para. 10). Customers always expect to get high-quality products at reasonable price. The management of Flexnet needs to do some researches to find the best method for solving these dilemmas. Nye (2011), “The company is feeling the pressure from consumers over the price hikes, but without the price
  • 7. hikes, how will it pay increased licensing fees? If it loses licensing contracts, will consumers stick around for limited available content?” (para. 13). Research Questions What does Flexnet need to do to survive with high licensing fees and with strong competitors like, Hulu and Amazon Prime? Will Flexnet be increasing monthly premiums to subscribers within a year; due to the increased cost of licensing? What evidence (data/measures) of impact was there in the past with increases? Flexnet is in a dilemma, decisions surrounding cost increases for their current and new subscribers might affect their overall subscriptions. The need to enhance is due to increases in the licensing to obtain the licenses for the movies. The customers expect excellent service for a great cost, but would this still be the case if we increase the costs by 25%? Decisions surrounding this dilemma will be when the increase takes effect and at what point are the current subscribers affected and when will the new customers receive the impact of the new costs for the monthly premium. Research Plan With the onset of the internet, Flexnet has seen a considerable amount of pressure because not only are their clients opting to stream movies, but also the rise of potential competitors. Flexnet is seeing a grand change in the industry because, a few years ago, they enjoyed monopoly and their large stack of movie libraries is what gained them subscribers in the first place. Combined with manageable licensing rates that could be paid for by the customer’s subscriptions, Flexnet was untouchable. The real concern now is what happens when the licensing rates go up, and their competitors have cheaper ways to deliver the movies (Schneider, 2015). Flexnet could look into expanding into international markets, can take advantage of the public markets and look to make some extra money through the
  • 8. use of smart media acquisitions. Finally, they should look to form mergers and completely redesign their rigid business model to accompany the modern day trends. This challenge requires that Flexnet associates itself with a network with an active media conglomerate so they can invest in innovations and explore new things. The international market is a mine field, and since they were able to tap into the American market, using even better techniques, they could source for revenue from other countries which would go a long way in reducing the burden of costs (Gina, 2012). Second, merging with an already established company and one with a flexible business model will save Flexnet the costs they would incur to redefine their business totally at the expense of a small stake into the company. The acquisitions of smart media can help Flexnet look into the blueprints of other successful media conglomerates where they can learn about the strengths and weaknesses while comparing to their own to promote growth and adaptation. Creating a network will increase the self-worth of Flexnet and thus even more reduced rates for their clients because they will have already established an even larger market pool than they have right now.
  • 9. Appendix Flexnet Broke the Rules and Won Research how the DVD rental company succeeded in a tough marketplace. Besides the online movies and TV shows, Flexnet invested in the video rental market with an incredible result. With this new business model, customers only need to pay a fixed monthly fee, make a list of future video rentals, order those videos online, and extend the rent without late charges. Customers have enjoyed all the best offers from Flexnet’s new rental business. Customers’ wish lists have created a significant advantage for Flexnet to understand what kind of movies that the clients are expecting. Flexnet has tried to carry all movies to meet customers’ demands. The company should stock many movies that can ship to customers immediately. The company needs to create a deadline to encourage all customers return the videos by their due dates and create a rule that the clients need to return the old videos before they can rent the new ones. This rule helped Flexnet on reducing the number of stocking movie copies. Removing deadlines balance the supply and demand, creates a comfortable condition and environment for satisfying customers’ needs and controls their costs effectively. Flexnet does not have to stock all movies (Snyder, 2010). Flexnet – the One True Entertainment Disrupter? Online video streaming service becomes successful because customers can switch using cable and satellite to the streaming service. How Flexnet can continue keeping the leading position in a competitive video rental and streaming services with Hulu and Amazon Prime. Customers believe that Flexnet will beat other companies because Hulu customers got annoyance by their routine commercials, and Amazon Prime Instant Video is not differentiated from Amazon Prime
  • 10. shipping. Flexnet surprised all customers as the sole potential service to replace cable and satellite TV. The research shows 2,500 customers in the US believed that Flexnet becomes one of the three companies which are leading to video streaming services. According to Imoderate (2015), “This popularity is not surprising, as it’s also reflected in market share, with Nielsen reporting that 36 percent of U.S. households subscribe to its service, far more than its nearest competitor.” (para. 3). The Rise and Fall of Flexnet: What Happened and Where Will It Go From Here? Flexnet started 17 years ago, “In 1999, Flexnet initiated its subscription service which provided unlimited DVD rentals for a monthly fee after the company received a $30 million investment from the Group Arnault (Flexnet Inc. Company Profile, 2011)” (Allen, Feils, & Disbrow (2014). Flexnet was, in turn, able to capitalize on the home-delivery market of DVD rentals and to stream TV shows and movies. The company took advantage of the wants and needs of its customers and in turn dominated their market. “In 2011, however, a price hike, poor management decisions, changes in technology, and increased competition threatened Flexnet, leading to a sharp decline in its share price” (Allen, Feils, & Disbrow (2014). Since 2011, Flexnet has continued to receive competitors in a market they once didn’t. In turn, their costs have increased, “. "Flexnet's content costs have jumped to $3.5 billion over the past several years, up from the $2.4 billion reported previously..." (Lang, 2011). The potentially severe increase in the cost of content could have a major impact on Flexnet's ability to generate profits in the future (Allen, Feils, & Disbrow (2014). The Flexnet Recommender System: Algorithms, Business Value, and Innovation Keeping the interest of a subscriber is something that Flexnet reviews and looks into to aid in ensuring their customers hold the interest in the programs and movies are being offered. This strategy decreases the chances of the subscriber losing interest and moving to another outlet for entertainment such as; HBO,
  • 11. Amazon Prime, or Hulu. “Consumer research suggests that a typical Flexnet member loses interest after perhaps 60 to 90 seconds of choosing, having reviewed 10 to 20 titles (perhaps 3 in detail) on one or two screens. The user either finds something of interest or the risk of the user abandoning our service increases substantially” (Gomez, C. A., & Hunt, N. (2016, January). Flexnet has since invested in changing the look and view of their pages, which includes all devices to share the same view: laptops, iPads, phones, and TV’s, “It has a matrix- like layout. Each entry in the matrix is a recommended video, and each row of videos contains recommendations with a similar “theme.” Rows are labeled according to their theme to make the theme transparent and (we think) more intuitive to our members” (Gomez, C. A., & Hunt, N. (2016, January). Flexnet: Rebranding and Price increase Debacle. In this article, the author takes a particular case into one of Flexnet’s strategic move that had a fundamental impact on the operations of the company. The author notes that Flexnet had earned the reputation of being the number one online film and rental services. Its revenue mostly came from clients who paid fees to have DVDs delivered to their doorsteps via the U.S. mail service. Some customers paid fees to watch directly TV shows through the internet on the TV sets, mobile phones, or laptops (Hoffman, 2013). The author looks at how an attempt by the company to rebrand and then alter the price of its services affected the company. Flexnet had tried to differentiate its online streaming service from its DVD delivery service. This move did not materialize well for the company as many of its customers failed to understand the reason behind the company’s decision to do that. The consequence of this action was that the company ended up losing an estimated 800,000 thousand clients (Hoffman, 2013). The company was forced to rescind this move and reintegrate the delivery and streaming services to avoid further losses. Despite suffering the major setback, Flexnet executives were confident that the company could still salvage the situation by convincing its customers that its services were
  • 12. still the best in the market and could not be beaten by that of any other company. Flexnet was able to retain its remaining customers and even attract most of their clients back to the company by offering quality services at a lower price. The information covered in this article is essential because it shows the challenges that rapidly expanding companies face as they strive to remain relevant and ahead of their competition. The focus on Flexnet demonstrates how the company was able to utilize thoughtful tactics to rectify a classical business misstep that threatened the company’s excellent progress to becoming the ultimate entertainment supply platform. Flexnet’s Original Programming Strategies and the On-Demand Television Transition. In this article, the author examines and analyzes the promotional strategies that Flexnet has been utilizing to promote its services. The author, Tyron, investigates comprehensive details that may not be so obvious to the normal person to explore the factors that have been instrumental in contributing to the rising success that Flexnet has enjoyed (Tyron, 2015). The author reviews various sources that talk about current management developments throughout the globe and highlights practical promotional strategies that Flexnet has adopted to strengthen its position as a key player in the market. By conducting a cutting edge research and studying several case studies, the author provides the reader with valuable insights and practical knowledge that have put Flexnet on top of its competitors. Tyron suggests that the success story of Flexnet can be explained through Pierre Bourdieu's concept of “discourses of distinction.” With this concept, Tyron suggests that Flexnet has become a hit because it practically applied the concept by offering an abundance of unique services intended towards attracting their client’s loyal participation on the company’s streaming services. Tyrone also points to the company’s association with the HBO cable channel as a pivotal engagement that reinforces its Flexnet’s discourse. Finally, Tyrone credits other promotional avenues that Flexnet has used
  • 13. as being significant in popularizing the company across the globe. Tyrone particularly notes that the “TV Got Better Campaign” that tended greatly naturalized viewing habits for example binge watching as part of a cult phenomenon of a narrative cutting edge and technological society (Tyron, 2015). The content written in this article is relevant to the research project because it reveals important information that is bound to save any researcher precious time as it pinpoints pertinent information about the company and presents it in a condensed form that is easy to understand. Challenges and opportunities in high-dimensional choice data analyses As is the case for Flexnet, modern businesses capture data. Data collected by Flexnet could be as far views of a specific movie, ratings provided after the video is viewed, attempt to have high quality movies that are “wants to be seen” by their subscribers and entice additional peoples or consumers to subscribe to their service. The informative datasets have been bettered with higher quality of results as the years have passed as well as streaming instead of waiting for a video (CD) to arrive to your home to watch. The creations of alternatives to provide what the consumer is wanting and expecting is important but also at a real cost; that is affordable and competitive. Predictive markets rely on proper data and research results; Flexnet is having the ability to predictive the market is similar to the reasoning behind our team assignment. Vulnerabilities and Countermeasures in Context-Aware Social Rating Services The importance of social trusts and the results from research questions is important to earn the recommendation of those who are already using the product in this case “Flexnet”. The rating of the system usage as well as the preference by the subscribers; the ability to provide what is expected is critical therefore the importance to be the leader in the competitive world as well as having excellent ratings and outcomes; being fair and cost effective is important. The reputation is also
  • 14. analyzed by the consumers before signing up for a service being rated by stars and comments is important; this provider trust worthy reputations that will provide leading “kudos” when the discussion about raising costs to provide the better selection. The feedback on this article provides: 1. Customer reviews 2. Star ratings 3. Graphs of the (smiley face) rating a. Happy (excellent) b. Smiley (Good) c. Not Happy nor sad (Ok, could have been better or maybe just ok) d. So-So (not great) e. Sad (Bad) Flexnet will use their ratings for promoting their new movies, available movies, better or leading in the industry, etc. Flexnet is making a move into the Chinese market Rumors are surfacing that Flexnet partnering with a local Chinese company. Vice President of Chinese company revealed that discussions are on-going regarding the entry of Flexnet into the Chinese market. Upon entry, Flexnet will face intense competition which is the reason for seeking a suitable partner. With the knowledge of knowing that neither Google, YouTube, Facebook, nor Twitter is providing regular services in China, Flexnet CEO is unsure that the company can get licensed to operate in China (Yalan, 2015). By partnering with a local company, Flexnet would avoid the challenge and difficulty of applying for a variety of different licenses. “Flexnet makes money by charging all subscribers a fee, but these subscriptions are unheard of in the Chinese media market” (Yalan, 2015). China enjoys free media and breaking this habit could be extraordinarily difficult. What we know about the Netflix price hike Flexnet downplayed its planned rate hike, stating it would only be a dollar or two difference. Flexnet introduced a DVD spinoff name Speedster and charged their customers $7.99 each instead
  • 15. of one price of $9.99 for both. Within four months, this caused Flexnet to lose 800,000 subscribers and their stock to drop in value by 77%. “The company hasn't touched a US price increase in the three years since, but its ambition to become a must-have part of every consumer's TV budget has driven Netflix to spend more on licensing top content and creating high-budget original programming of its own” (Solsman, 2014). New members are paying $1 to $2 higher than Flexnet current customers. The question now is “how long existing members would continue paying their current rate before the higher price applies to them” (Solsman, 2014). Flexnet Quick Guide: How Does Flexnet Decide What's On Flexnet This video was released in 2013 by Flexnet as an explanation of how and why the selection process happens for streaming and DVD movie choices. The representative on the video is Jenny McCabe who is the Director of Global Media Relations. At that time, Flexnet goal “was to deliver a mix of tv shows and movies that give an exclusive experience” (McCabe,2013) rather than being television and film library. One of the ways they differentiate themselves is by licensing TV shows exclusively to give the consumer a unique experience. An example of that would be “Orange is the New Black” or “House of Card”. Because Flexnet cannot license everything and maintain their low prices, content is chosen by the viewership of the customer. So those titles that will garner higher numbers of streaming will be selected to be licensed. The cost of the licensing is taken into consideration as well. If the viewership is high, it will justify the cost which could get a possible renewal when the agreement runs out. So essentially Flexnet is saying that the ball in our court to choose what we want to see on there. This is relevant because it speaks on the licensing issue and its Flexnet response to customer complaints. Where else should this information come from other than from the horse mouth?
  • 16. Flexnet Review – Online DVD Rentals and Video Streaming The article is about Flexnet, how its run. It tells the story of how Flexnet became a household name with its DVD rental concept. Once it transitioned to streaming it became even more of a household name reaching people who are at the front of the streaming craze. The only limitations to the services where are online content choices. After conquering the streaming service they decided to expand from a TV only platform and started making applications to your phone, and blue-ray players then growing to console integration so you can use you gaming system to stream content. This article showed how Flexnet compares the competition, and Flexnet excels when it comes to convenience and variety of features and the pricing. Its greatest motto is the no late fees. The article is relevant because it clearly depicted the road it took for Flexnet to get where it is now. It also talked about the constant struggle Flexnet has with staying competitive in the area of pricing. It also touched on the problems with the content available for streaming which alludes to the licensing issues. . References Allen, G., Feils, D., & Disbrow, H. (2014). The Rise and Fall of Flexnet: What Happened and Where Will it Go from Here?? (). Arden: Jordan Whitney Enterprises, Inc. Retrieved from http://search.proquest.com/docview/1647822304?accountid=458 Feng, Q., Liu, L., & Dai, Y. (2012, January) Vulnerabilities and countermeasures in context-aware social rating services. ACM Transactions on Internet Technology (TOIT), 11(3). Doi:10.1145/2078316.2078319 Gina K., (2012), Flexnet: The Epic Battle for America’s Eyeballs, Portfolio/ Penguin Print. Gomez, C. A., & Hunt, N. (2016, January). The Flexnet Recommender System: Algorithms, Business Value, and Innovation. ACM Transactions on Management Information Systems, 6(13). Guina, R. (2016, February 18). Netflix Review – Online DVD
  • 17. Rentals and Video Streaming. Retrieved April 17, 2016, from http://cashmoneylife.com/netflix-review-online-dvd-rentals/ Hoffman, A. (2013). Flexnet: Rebranding and Price increase Debacle. Erasmus Research Institute Management. Hoover's. (2016). Retrieved from http://www.hoovers.com/company-information/cs/company-/ profile.Flexnet_Inc.f336f5bc15a31a6c.htm Imoderate. (2015). Flexnet – the one true entertainment disrupter? Retrieved from http://www.imoderate.com/new- study-reveals-why-consumers-prefer-Flexnet-over-hulu-and- amazon/ Lang, Brent and Waxman, Sharon (October 25, 2011). Flexnet Stock Plunge: Will Reed Hastings' Hubris Bring Down an Internet Meteor? www.reuters.com. Retrieved May 13, 2012 from http://www.reuters.com/article/201 l/10/25/idUS375477277620111025 McCabe, J (Author and Director of Global Media Relations). Flexnet Quick Guide: How does Flexnet Decide What's on Flexnet [video file]. Available from YouTube website: https://www.youtube.com/watch?v=VvpoUh9gx58 Naik, P., Wedel, M., Bacon, L., Bodapati, A., Bradlow, E., Kamakura, W., Montgomery, A. (2008). Challenges and opportunities in high-dimensional choice data analyses. Marketing Letters, 19(3-4), 201-213. doi: http://dx.doi.org/10.1007/s11002-008-9036-3 Nye, H. (2011).Flexnet’s Big Licensing Dilemma. Retrieved from http://www.businessinsider.com/Flexnets-big-licensing- dilemma-2011-7 Schneider S., (2015), What must Flexnet do to survive? retrieved from the USA today. Snyder, B. (2010). Flexnet Broke the Rules and Won. Retrieved from https://www.gsb.stanford.edu/insights/Flexnet-broke-rules- won Solsman, J. E. (2014, April 21). What we know about the Netflix price hike. CNET. Retrieved from http://www.cnet.com/news/what-we-know-about-the-netflix-
  • 18. price-hike/ Tyron, C. (2015). TV Got Better: Flexnet’s Original Programming Strategies and the On- Demand Television Transition. Media Industries, 2.2 (2015). Yalan, L. (2015, October). Flexnet is making a move into the Chinese market. Business Insider. Retrieved from http://www.businessinsider.com/netflix-will- likely-enter-chinese-market-2015-10 1 Running Head: WEEK 3 TEAM ASSIGNMENT Flexnet The consumer product rental industry continues to grow and improve services beyond video stores. “Flexnet steers couch potatoes away from the video store to the mailbox or Internet. The company's more than 57 million subscribers in 50 countries can download movies or rent DVDs for a monthly fee through Flexnet.com” (Hoovers (2016) (para. 1). As the era changes, instead of DVD rental, Flexnet is focusing on its fast-growing overseas streaming service. A Brief History Flexnet was established 18 years ago on August 29, 1997. Its original premise was to offer America the convenience of having your movie rentals mailed to you vs. having to go to the rental store. In 2007, Flexnet introduced streaming to its line of services offered. Both services are provided with the business model of no late fees, a flat rate, and unlimited rentals or streaming. In 2013, flex net received some negative reviews on their streaming content. To the customers, it seemed that if you wanted to get the newest content the best way would be to get the DVD. Flexnet responded to the complaints by acknowledging the issue and stating quite frankly that it’s economical to get the rights to DVDs than to the stream. They
  • 19. also said that the way they choose what will be renewed or added is based on how many streams a movie or show gets. In the coming years with the popularity of streaming devices like Apple TV, Roku, and Amazon Fire and the use of applications for streaming Flexnet has had an increasing battle to stay competitive with content offered and prices charged. Dilemma that the Organization Might Face From the outside, Flexnet seems to be a successful company with strong financial performance. However, Flexnet has faced with pricing and licensing dilemmas. Many subscribers and investors questioned if the company can continue keeping its lead on video rental and streaming services. Flexnet has to renew its license, content, and agreements frequently. Due to the hiking renewal cost, Flexnet has to pay much higher than what they paid in previous years. The company is under pressure to increase the service fee without losing the established customers. If the company does not want to pay high licensing fees, it will lose many subscribers. Amazon Prime and Hulu are one of the main competitors of Flexnet, have the right to stream their contents. Nye (2011), “This leads up to Flexnet’s other biggest obstacle: distribution. The debate is no longer between DVDs and streaming, and the question is now who will offer the best platform from which to distribute the most desirable content” (para. 10). Customers always expect to get high-quality products at reasonable price. The management of Flexnet needs to do some researches to find the best method for solving these dilemmas. Nye (2011), “The company is feeling the pressure from consumers over the price hikes, but without the price hikes, how will it pay increased licensing fees? If it loses licensing contracts, will consumers stick around for limited available content?” (para. 13). Research Questions What does Flexnet need to do to survive with high licensing fees and with strong competitors like, Hulu and Amazon Prime?
  • 20. Will Flexnet be increasing monthly premiums to subscribers within a year; due to the increased cost of licensing? What evidence (data/measures) of impact was there in the past with increases? Flexnet is in a dilemma, decisions surrounding cost increases for their current and new subscribers might affect their overall subscriptions. The need to enhance is due to increases in the licensing to obtain the licenses for the movies. The customers expect excellent service for a great cost, but would this still be the case if we increase the costs by 25%? Decisions surrounding this dilemma will be when the increase takes effect and at what point are the current subscribers affected and when will the new customers receive the impact of the new costs for the monthly premium. Research Plan With the onset of the internet, Flexnet has seen a considerable amount of pressure because not only are their clients opting to stream movies, but also the rise of potential competitors. Flexnet is seeing a grand change in the industry because, a few years ago, they enjoyed monopoly and their large stack of movie libraries is what gained them subscribers in the first place. Combined with manageable licensing rates that could be paid for by the customer’s subscriptions, Flexnet was untouchable. The real concern now is what happens when the licensing rates go up, and their competitors have cheaper ways to deliver the movies (Schneider, 2015). Flexnet could look into expanding into international markets, can take advantage of the public markets and look to make some extra money through the use of smart media acquisitions. Finally, they should look to form mergers and completely redesign their rigid business model to accompany the modern day trends. This challenge requires that Flexnet associates itself with a network with an active media conglomerate so they can invest in innovations and explore new things. The international market is a mine field, and since they were able to tap into the
  • 21. American market, using even better techniques, they could source for revenue from other countries which would go a long way in reducing the burden of costs (Gina, 2012). Second, merging with an already established company and one with a flexible business model will save Flexnet the costs they would incur to redefine their business totally at the expense of a small stake into the company. The acquisitions of smart media can help Flexnet look into the blueprints of other successful media conglomerates where they can learn about the strengths and weaknesses while comparing to their own to promote growth and adaptation. Creating a network will increase the self-worth of Flexnet and thus even more reduced rates for their clients because they will have already established an even larger market pool than they have right now. Appendix Flexnet Broke the Rules and Won Research how the DVD rental company succeeded in a tough
  • 22. marketplace. Besides the online movies and TV shows, Flexnet invested in the video rental market with an incredible result. With this new business model, customers only need to pay a fixed monthly fee, make a list of future video rentals, order those videos online, and extend the rent without late charges. Customers have enjoyed all the best offers from Flexnet’s new rental business. Customers’ wish lists have created a significant advantage for Flexnet to understand what kind of movies that the clients are expecting. Flexnet has tried to carry all movies to meet customers’ demands. The company should stock many movies that can ship to customers immediately. The company needs to create a deadline to encourage all customers return the videos by their due dates and create a rule that the clients need to return the old videos before they can rent the new ones. This rule helped Flexnet on reducing the number of stocking movie copies. Removing deadlines balance the supply and demand, creates a comfortable condition and environment for satisfying customers’ needs and controls their costs effectively. Flexnet does not have to stock all movies (Snyder, 2010). Flexnet – the One True Entertainment Disrupter? Online video streaming service becomes successful because customers can switch using cable and satellite to the streaming service. How Flexnet can continue keeping the leading position in a competitive video rental and streaming services with Hulu and Amazon Prime. Customers believe that Flexnet will beat other companies because Hulu customers got annoyance by their routine commercials, and Amazon Prime Instant Video is not differentiated from Amazon Prime shipping. Flexnet surprised all customers as the sole potential service to replace cable and satellite TV. The research shows 2,500 customers in the US believed that Flexnet becomes one of the three companies which are leading to video streaming services. According to Imoderate (2015), “This popularity is not surprising, as it’s also reflected in market share, with Nielsen reporting that 36 percent of U.S. households subscribe to its
  • 23. service, far more than its nearest competitor.” (para. 3). The Rise and Fall of Flexnet: What Happened and Where Will It Go From Here? Flexnet started 17 years ago, “In 1999, Flexnet initiated its subscription service which provided unlimited DVD rentals for a monthly fee after the company received a $30 million investment from the Group Arnault (Flexnet Inc. Company Profile, 2011)” (Allen, Feils, & Disbrow (2014). Flexnet was, in turn, able to capitalize on the home-delivery market of DVD rentals and to stream TV shows and movies. The company took advantage of the wants and needs of its customers and in turn dominated their market. “In 2011, however, a price hike, poor management decisions, changes in technology, and increased competition threatened Flexnet, leading to a sharp decline in its share price” (Allen, Feils, & Disbrow (2014). Since 2011, Flexnet has continued to receive competitors in a market they once didn’t. In turn, their costs have increased, “. "Flexnet's content costs have jumped to $3.5 billion over the past several years, up from the $2.4 billion reported previously..." (Lang, 2011). The potentially severe increase in the cost of content could have a major impact on Flexnet's ability to generate profits in the future (Allen, Feils, & Disbrow (2014). The Flexnet Recommender System: Algorithms, Business Value, and Innovation Keeping the interest of a subscriber is something that Flexnet reviews and looks into to aid in ensuring their customers hold the interest in the programs and movies are being offered. This strategy decreases the chances of the subscriber losing interest and moving to another outlet for entertainment such as; HBO, Amazon Prime, or Hulu. “Consumer research suggests that a typical Flexnet member loses interest after perhaps 60 to 90 seconds of choosing, having reviewed 10 to 20 titles (perhaps 3 in detail) on one or two screens. The user either finds something of interest or the risk of the user abandoning our service increases substantially” (Gomez, C. A., & Hunt, N. (2016, January). Flexnet has since invested in changing the look and
  • 24. view of their pages, which includes all devices to share the same view: laptops, iPads, phones, and TV’s, “It has a matrix- like layout. Each entry in the matrix is a recommended video, and each row of videos contains recommendations with a similar “theme.” Rows are labeled according to their theme to make the theme transparent and (we think) more intuitive to our members” (Gomez, C. A., & Hunt, N. (2016, January). Flexnet: Rebranding and Price increase Debacle. In this article, the author takes a particular case into one of Flexnet’s strategic move that had a fundamental impact on the operations of the company. The author notes that Flexnet had earned the reputation of being the number one online film and rental services. Its revenue mostly came from clients who paid fees to have DVDs delivered to their doorsteps via the U.S. mail service. Some customers paid fees to watch directly TV shows through the internet on the TV sets, mobile phones, or laptops (Hoffman, 2013). The author looks at how an attempt by the company to rebrand and then alter the price of its services affected the company. Flexnet had tried to differentiate its online streaming service from its DVD delivery service. This move did not materialize well for the company as many of its customers failed to understand the reason behind the company’s decision to do that. The consequence of this action was that the company ended up losing an estimated 800,000 thousand clients (Hoffman, 2013). The company was forced to rescind this move and reintegrate the delivery and streaming services to avoid further losses. Despite suffering the major setback, Flexnet executives were confident that the company could still salvage the situation by convincing its customers that its services were still the best in the market and could not be beaten by that of any other company. Flexnet was able to retain its remaining customers and even attract most of their clients back to the company by offering quality services at a lower price. The information covered in this article is essential because it shows the challenges that rapidly expanding companies face as they strive to remain relevant and ahead of their competition. The
  • 25. focus on Flexnet demonstrates how the company was able to utilize thoughtful tactics to rectify a classical business misstep that threatened the company’s excellent progress to becoming the ultimate entertainment supply platform. Flexnet’s Original Programming Strategies and the On-Demand Television Transition. In this article, the author examines and analyzes the promotional strategies that Flexnet has been utilizing to promote its services. The author, Tyron, investigates comprehensive details that may not be so obvious to the normal person to explore the factors that have been instrumental in contributing to the rising success that Flexnet has enjoyed (Tyron, 2015). The author reviews various sources that talk about current management developments throughout the globe and highlights practical promotional strategies that Flexnet has adopted to strengthen its position as a key player in the market. By conducting a cutting edge research and studying several case studies, the author provides the reader with valuable insights and practical knowledge that have put Flexnet on top of its competitors. Tyron suggests that the success story of Flexnet can be explained through Pierre Bourdieu's concept of “discourses of distinction.” With this concept, Tyron suggests that Flexnet has become a hit because it practically applied the concept by offering an abundance of unique services intended towards attracting their client’s loyal participation on the company’s streaming services. Tyrone also points to the company’s association with the HBO cable channel as a pivotal engagement that reinforces its Flexnet’s discourse. Finally, Tyrone credits other promotional avenues that Flexnet has used as being significant in popularizing the company across the globe. Tyrone particularly notes that the “TV Got Better Campaign” that tended greatly naturalized viewing habits for example binge watching as part of a cult phenomenon of a narrative cutting edge and technological society (Tyron, 2015). The content written in this article is relevant to the research project because it reveals important information that is bound to
  • 26. save any researcher precious time as it pinpoints pertinent information about the company and presents it in a condensed form that is easy to understand. Challenges and opportunities in high-dimensional choice data analyses As is the case for Flexnet, modern businesses capture data. Data collected by Flexnet could be as far views of a specific movie, ratings provided after the video is viewed, attempt to have high quality movies that are “wants to be seen” by their subscribers and entice additional peoples or consumers to subscribe to their service. The informative datasets have been bettered with higher quality of results as the years have passed as well as streaming instead of waiting for a video (CD) to arrive to your home to watch. The creations of alternatives to provide what the consumer is wanting and expecting is important but also at a real cost; that is affordable and competitive. Predictive markets rely on proper data and research results; Flexnet is having the ability to predictive the market is similar to the reasoning behind our team assignment. Vulnerabilities and Countermeasures in Context-Aware Social Rating Services The importance of social trusts and the results from research questions is important to earn the recommendation of those who are already using the product in this case “Flexnet”. The rating of the system usage as well as the preference by the subscribers; the ability to provide what is expected is critical therefore the importance to be the leader in the competitive world as well as having excellent ratings and outcomes; being fair and cost effective is important. The reputation is also analyzed by the consumers before signing up for a service being rated by stars and comments is important; this provider trust worthy reputations that will provide leading “kudos” when the discussion about raising costs to provide the better selection. The feedback on this article provides: 1. Customer reviews 2. Star ratings
  • 27. 3. Graphs of the (smiley face) rating a. Happy (excellent) b. Smiley (Good) c. Not Happy nor sad (Ok, could have been better or maybe just ok) d. So-So (not great) e. Sad (Bad) Flexnet will use their ratings for promoting their new movies, available movies, better or leading in the industry, etc. Flexnet is making a move into the Chinese market Rumors are surfacing that Flexnet partnering with local Chinese company. Vice President of Chinese company revealed that discussions are on-going regarding the entry of Flexnet into the Chinese market. Upon entry, Flexnet will face intense competition which is the reason for seeking suitable partner. With the knowledge of knowing that neither Google, YouTube, Facebook, nor Twitter is providing regular services in China, Flexnet CEO is unsure that the company can get licensed to operate in China (Yalan, 2015). By partnering with local company, Flexnet would avoid the challenge and difficulty of applying for a variety of different licenses. “Flexnet makes money by charging all subscribers a fee, but these subscriptions are unheard of in the Chinese media market” (Yalan, 2015). China enjoys the rule of free media and breaking this habit could be extremely difficulty. Flexnet Quick Guide: How Does Flexnet Decide What's On Flexnet This video was released in 2013 by Flexnet as an explanation of how and why the selection process happens for streaming and DVD movie choices. The representative on the video is Jenny McCabe who is the Director of Global Media Relations. At that time, Flexnet goal “was to deliver a mix of tv shows and movies that give an exclusive experience”(McCabe,2013) rather than being television and film library. One of the ways they differentiate themselves is by licensing tv shows exclusively to give the consumer a unique
  • 28. experience. An example of that would be “Orange is the New Black” or “House of Card”. Because Flexnet cannot license everything and maintain their low prices, content is chosen by the viewership of the customer. So those titles that will garner higher numbers of streaming will be selected to be licensed. The cost of the licensing is taken into consideration as well. If the viewership is high, it will justify the cost which could get a possible renewal when the agreement runs out. So essentially Flexnet is saying that the ball in our court to choose what we want to see on there. This is relevant because it speaks on the licensing issue and its Flexnet response to customer complaints. Where else should this information come from other than from the horse mouth. Flexnet Review – Online DVD Rentals and Video Streaming The article is about Flexnet, how its run. It tells the story of how Flexnet became a household name with its DVD rental concept. Once it transitioned to streaming it became even more of a household name reaching people who are at the front of the streaming craze. The only limitations to the services where are online content choices. After conquering the streaming service they decided to expand from a tv only platform and started making applications to your phone, and blue-ray players then growing to console integration so you can use you gaming system to stream content. This article showed how Flexnet compares the competition, and Flexnet excels when it comes to convenience and variety of features and the pricing. Its greatest motto is the no late fees. The article is relevant because it clearly depicted the road it took for Flexnet to get where it is now. It also talked about the constant struggle Flexnet has with staying competitive in the area of pricing. It also touched on the problems with the content available for streaming which alludes to the licensing issues. .
  • 29. References Allen, G., Feils, D., & Disbrow, H. (2014). The Rise and Fall of Flexnet: What Happened and Where Will it Go from Here?? (). Arden: Jordan Whitney Enterprises, Inc. Retrieved from http://search.proquest.com/docview/1647822304?accountid=458 Feng, Q., Liu, L., & Dai, Y. (2012, January) Vulnerabilities and countermeasures in context-aware social rating services. ACM Transactions on Internet Technology (TOIT), 11(3). Doi:10.1145/2078316.2078319 Gina K., (2012), Flexnet: The Epic Battle for America’s Eyeballs, Portfolio/ Penguin Print. Gomez, C. A., & Hunt, N. (2016, January). The Flexnet Recommender System: Algorithms, Business Value, and Innovation. ACM Transactions on Management Information Systems, 6(13). Hoffman, A. (2013). Flexnet: Rebranding and Price increase Debacle. Erasmus Research Institute Management. Hoover's. (2016). Retrieved from http://www.hoovers.com/company-information/cs/company-/ profile.Flexnet_Inc.f336f5bc15a31a6c.htm Imoderate. (2015). Flexnet – the one true entertainment disrupter? Retrieved from http://www.imoderate.com/new- study-reveals-why-consumers-prefer-Flexnet-over-hulu-and- amazon/ Lang, Brent and Waxman, Sharon (October 25, 2011). Flexnet Stock Plunge: Will Reed Hastings' Hubris Bring Down an
  • 30. Internet Meteor? www.reuters.com. Retrieved May 13, 2012 from http://www.reuters.com/article/201 l/10/25/idUS375477277620111025 Naik, P., Wedel, M., Bacon, L., Bodapati, A., Bradlow, E., Kamakura, W., Montgomery, A. (2008). Challenges and opportunities in high-dimensional choice data analyses. Marketing Letters, 19(3-4), 201-213. doi: http://dx.doi.org/10.1007/s11002-008-9036-3 Nye, H. (2011).Flexnet’s Big Licensing Dilemma. Retrieved from http://www.businessinsider.com/Flexnets-big-licensing- dilemma-2011-7 Schneider S., (2015), What must Flexnet do to survive? retrieved from the USA today. Snyder, B. (2010). Flexnet Broke the Rules and Won. Retrieved from https://www.gsb.stanford.edu/insights/Flexnet-broke-rules- won Tyron, C. (2015). TV Got Better: Flexnet’s Original Programming Strategies and the On- Demand Television Transition. Media Industries, 2.2 (2015). Yalan, L. (2015, October). Flexnet is making a move into the Chinese market. Business Insider. Retrieved from http://www.businessinsider.com/netflix-will- likely-enter-chinese-market-2015-10 McCabe,J (Author and Director of Global Media Relations). Flexnet Quick Guide: How does Flexnet Decide What's on Flexnet [video file]. Available from YouTube website:https://www.youtube.com/watch?v=VvpoUh9gx58 Guina, R. (2016, February 18). Netflix Review – Online DVD Rentals and Video Streaming. Retrieved April 17, 2016, from http://cashmoneylife.com/netflix-review-online-dvd-rentals/
  • 31. Descriptive StatisticsJane DoeQNT/561 July 14, 2014 Matthew Radio SHORT TITLE OF PAPER 1 Running head: DESCRIPTIVE STATISTICS 1 Descriptive Statistics Numeric Variable: Willingness to Recommend (collected from customer satisfaction survey) Distribution is not normally distributed. Central Tendency: Mean = 4.37 Median = 5 Mode = 5 Dispersion: Standard deviation = 1.26 Interquartile range (IQR) = 1.00 Range = 5 Number: 250 records Min/Max: 1 and 5 Confidence Interval: There is a 95% confidence that the
  • 32. population average is between 4.22 and 4.53 See the descriptive statistics in Appendix B and the histogram in Appendix C. Numeric Variable: Days to Contract Expiration Central Tendency: Mean = 388.68 Median = 450.00 Mode = 630.00 Dispersion: Standard deviation = 242.28 Interquartile range (IQR) = 450.00 Range = 720.00 Number: 250 records Min/Max: 0 and 720 Confidence Interval: There is a 95% confidence that the customer Days to Contract Expiration is between 358.65 and 418.71 See the descriptive statistics in Appendix B and the histogram in Appendix C. Attribute Variable Handset Brands 250 customers who called into the contact center within the last
  • 33. three months were selected at random. 46.8% of the customers own a Samsung brand device, 41.6% own an iPhone, 7.6% own an LG, and 4.0% own a brand under the "Other" category (this includes brands like Palm, Kyoceta, and CellTel). See bar chart in Appendix E. Comment by Matthew Radio: Would a pie chart be more effective? Descriptive Statistics Interpretation Willingness to Recommend 250 customers were surveyed at random. The customers were asked how likely they would recommend CellTel to a friend or relative. Customers could select from 1 - 5: 5 = Would Definitely Recommend 4 = Very Likely To Recommend 3 = for Undecided 2 = Not Likely to Recommend 1 = Would Definitely Not Recommend The average score was 4.37, with a variation of plus or minus 0.16. 71.6% of the responses were scored as a 5 - Would Definitely Recommend. There is a 95% confidence that the population score averages between 4.22 and 4.53. Comment by Matthew Radio: What do you mean by “variation”? Do you mean variance, standard deviation, or some other metric of dispersion? Days to Contract Expiration 250 customers who called into the contact center within the last three months were selected at random. The average time to contract expiration was 388.68 days, with a variation of plus or minus 30.03 days. One half or more of the customers were above 450 days to their contract expiration. 13.20% of the customers have contracts that have already expired. There is a 95% confidence that the population (CellTel's customer base)
  • 34. average days to contract expiration is between 358.65 and 418.71 days. DESCRIPTIVE STATISTICS 2 APPENDIX A Raw data used in the analysis APPENDIX B Descriptive Statistics Willingness to Recommend and Contract Expiration Comment by Matthew Radio: What does the “nominal score” mean? Be sure that the meaning of all figures are readily apparent to the reader. APPENDIX C Willingness to Recommend and Days to Contract Expiration Histograms Comment by Matthew Radio: Should each bar be a range and not a single value? If the horizontal scale is continuous, should this be a histogram? (i.e. the bars touch each other) APPENDIX D Scatterplot Willingness to Recommend versus Days to Contract
  • 35. Expiration APPENDIX E Descriptive Statistics Attribute Variable Handset Brands Willingness to Recommend Percent 1.0 2.0 3.0 4.0 5.0 0.1 0.012 0.016 0.156 0.716 Days to Contract Expiration Percent 0.0 30.0 60.0 90.0 180.0 270.0 360.0 450.0 540.0 630.0 720.0 0.132 0.032 0.012 0.02 0.076 0.12 0.092 0.104 0.128 0.16 0.124 Willingness to Recommend Score 360.0 720.0 360.0 720.0 540.0 180.0 270.0 630.0 720.0 0.0 360.0 540.0 0.0 540.0 540.0 0.0 30.0 0.0 360.0 720.0 360.0 30.0 630.0 180.0 720.0 450.0 0.0 540.0 180.0 450.0 360.0 270.0 180.0 630.0 30.0 630.0 30.0 450.0 60.0 450.0 90.0 630.0 720.0 360.0 450.0 450.0 0.0 630.0 450.0 630.0 720.0 90.0 450.0 360.0 0.0 0.0 360.0 360.0 60.0 270.0 450.0 180.0 720.0 360.0 720.0 720.0 540.0 630.0 630.0 720.0 630.0 90.0 270.0 450.0 0.0 540.0 270.0 630.0 360.0 0.0 270.0 540.0 60.0 720.0 0.0 0.0 0.0 630.0 540.0 630.0 450.0 540.0 270.0 540.0 270.0 30.0 90.0 630.0 630.0 630.0 540.0 450.0 540.0 630.0 720.0 450.0
  • 36. 540.0 450.0 720.0 630.0 540.0 270.0 30.0 630.0 450.0 450.0 270.0 270.0 360.0 450.0 0.0 540.0 450.0 450.0 450.0 30.0 0.0 450.0 630.0 720.0 540.0 360.0 720.0 0.0 180.0 360.0 540.0 0.0 630.0 540.0 360.0 0.0 720.0 630.0 630.0 180.0 720.0 720.0 0.0 540.0 540.0 270.0 0.0 270.0 180.0 90.0 450.0 720.0 540.0 270.0 270.0 180.0 360.0 0.0 720.0 630.0 720.0 630.0 270.0 270.0 180.0 270.0 0.0 0.0 630.0 450.0 720.0 630.0 450.0 270.0 270.0 180.0 720.0 630.0 360.0 180.0 180.0 270.0 720.0 540.0 540.0 270.0 720.0 180.0 270.0 450.0 270.0 270.0 630.0 0.0 720.0 630.0 540.0 360.0 180.0 540.0 270.0 270.0 270.0 360.0 0.0 630.0 180.0 630.0 540.0 630.0 360.0 540.0 0.0 30.0 540.0 630.0 720.0 180.0 720.0 270.0 630.0 630.0 720.0 540.0 450.0 0.0 630.0 0.0 0.0 630.0 0.0 0.0 270.0 0.0 540.0 360.0 0.0 630.0 720.0 180.0 180.0 360.0 540.0 630.0 5.0 5.0 1.0 5.0 5.0 1.0 5.0 5.0 5.0 1.0 5.0 5.0 5.0 5.0 5.0 1.0 5.0 5.0 4.0 5.0 5.0 4.0 5.0 5.0 5.0 1.0 1.0 5.0 5.0 4.0 5.0 1.0 5.0 5.0 5.0 5.0 5.0 5.0 5.0 5.0 5.0 4.0 5.0 5.0 5.0 3.0 5.0 5.0 5.0 5.0 4.0 5.0 5.0 5.0 5.0 2.0 5.0 5.0 5.0 5.0 5.0 5.0 5.0 4.0 4.0 5.0 5.0 1.0 5.0 5.0 5.0 4.0 5.0 5.0 5.0 5.0 5.0 5.0 4.0 5.0 4.0 5.0 5.0 5.0 5.0 5.0 5.0 4.0 5.0 3.0 4.0 5.0 5.0 4.0 5.0 5.0 5.0 5.0 3.0 5.0 5.0 5.0 5.0 5.0 5.0 5.0 5.0 5.0 5.0 5.0 5.0 5.0 1.0 5.0 5.0 5.0 5.0 5.0 5.0 4.0 5.0 5.0 1.0 5.0 5.0 5.0 5.0 4.0 4.0 4.0 5.0 5.0 5.0 4.0 5.0 5.0 5.0 4.0 5.0 5.0 5.0 5.0 5.0 5.0 5.0 5.0
  • 37. 4.0 1.0 4.0 4.0 5.0 5.0 5.0 4.0 5.0 5.0 4.0 5.0 5.0 4.0 4.0 5.0 5.0 5.0 4.0 5.0 5.0 5.0 4.0 5.0 5.0 4.0 5.0 5.0 5.0 5.0 5.0 5.0 4.0 5.0 5.0 3.0 4.0 5.0 5.0 1.0 5.0 1.0 5.0 5.0 5.0 5.0 4.0 1.0 5.0 2.0 4.0 5.0 5.0 1.0 5.0 5.0 5.0 5.0 1.0 5.0 5.0 5.0 0.0 5.0 5.0 5.0 5.0 1.0 4.0 5.0 1.0 1.0 5.0 5.0 4.0 5.0 5.0 5.0 4.0 5.0 1.0 1.0 5.0 5.0 1.0 5.0 4.0 5.0 5.0 1.0 5.0 2.0 5.0 5.0 5.0 4.0 5.0 5.0 5.0 1.0 5.0 4.0 5.0 5.0 Days to Contract Expiration Willingness to Recommend Score CellTel Handset Brands Owned Customer Handsets iPhone LG Other Samsung 0.416 0.076 0.04 0.468 Percent Descriptive Statistics STUDENT QNT 561 November 3, 2014 Professor Matthew Radio Running head: DESCRIPTIVE STATISTICS 1 DESCRIPTIVE STATISTICS 3
  • 38. Descriptive Statistics Techy-Tech Inc. is a global computer software company with approximately eight thousand employees in its North Carolina facility. Techy-Tech is a firm that is plagued with a decrease in productivity due to low morale and team motivation. To solve this problem, Team B has suggested opening a coffee bar that is free for employees in hopes of improving the work environment by increasing motivation and morale, thus ultimately improving productivity by reducing stress. Company surveys have identified that many employees have expressed that they were experiencing higher stress levels than compared to past surveys. The company has decided since they cannot control stress levels by reducing market demand, perhaps improving the work environment could help reduce stress levels. Research has shown that a stress-filled employee makes the wrong decisions and has negative relationships with co- workers. Reduced productivity, mistakes, low quality of work, and absenteeism are all signs of a stressed employee (Halkos & Bousinakis, 2010). The company will research the question, will adding a free coffee bar improve employee productivity? Descriptive Statistics Prior to the implementation of the free coffee bar, Techy-Tech, Inc. measured monthly production rates of surveyed employees from January-December 2001. The descriptive statistics are listed below of production before the coffee bar. Comment by Matthew Radio: Good. Central Tendency: Mean 16,079.00 units produced Dispersion: Standard Deviation is 2,451 Number: Measure was 12 months or 12 measurements Min/Max: 10,080 and 18,700 Confidence Interval: 14,630 to 17,527 Comment by Matthew Radio: Please see comments at end
  • 39. of paper. A label is needed. As mentioned, the Techy-tech has seen a decrease in production, which the bar graph above shows a downward trend line in terms of production. At the beginning of 2012, Techy- Tech opened a free coffee bar in hopes that this would decrease stress and lead to an increase in employee production. Below are the descriptive statistics for Tech-Tech after the implementation of the coffee bar: Comment by Matthew Radio: Now that we are in week 5,can you plot an actual regression line? Comment by Matthew Radio: Has anything else changed that would cause an increase in production? That should be noted. Central Tendency: Mean 20,735 units produced Dispersion: Standard Deviation is 2,663 Number: Measure was 12 months or 12 measurements Min/Max: 16,300 and 25,000 Confidence Interval: 19,160 to 22,309 After the implementation of the free coffee bar, the production of surveyed employees that used the coffee bar at Techy-Tech increased from January 2012 to December 2012. The bar graph above shows a trend line that production at the company is improving over the previous year. Comment by Matthew Radio: OK. Some options for next week’s Inferential Statistics paper… Do a hypothesis test for the difference of two means (the mean for the 12 months before and after the coffee bar). What other tests could be performed? Descriptive Statistics Interpretation Techy-Tech, Inc. measured production levels from 2011 and compared the production levels to 2012 after the
  • 40. implementation of a free coffee bar. The mean production levels in 2011 were 16,079 units produced compared to 20,735 units produced after the implementation of a free coffee bar. The 2011 production had a minimum production at 10,080 units and maximum units produced were 18,700. When 2011 production was compared to 2012, the 2012 mininum production rate was 16,300 units produced, and a maximum of 25,000 units produced. Techy-Tech was 95% confident that in 2011, the company would produce between 14,640 to 17,527. However, in 2012, the company was 95% confident that they would produce between 19,160 to 22,309. Conclusion In conclusion, Team B conducted a survey to compare a productivity measure from before and after the coffee bar was established with the same measure. The team analysis determined that Techy-Teach employee productivity increased due to decreasing workplace stress. The survey concluded that those who use the coffee bar end up producing units from the previous year. By having a coffee bar in the workplace helped Techy-Tech employees decompress and work performance increase. DESCRIPTIVE STATISTICS 9
  • 41. References Halkos, G., & Bousinakis, D. (2010). The Effects of Stress and Satisfaction on Productivity. International Journal of Productivity and Performance Management, 59(5), 415-431. Appendix A Production Results in 2011 and 2012 Month Production Before Coffee Bar Month Production After Coffee Bar 1-Jan
  • 43. 10800 2-Oct 18000 1-Nov 18500 2-Nov 22100 1-Dec 14550 2-Dec 25000 Content and Development 4 Points Points Earned 4/4 Additional Comments: All key elements of the assignment are covered in a substantive way, including: · Excel Spreadsheet was created. · Variables are listed. · Descriptive stats provided · Applicable charts/graphs displayed.. · Interpretation of statistics given. Super! Let me know if you have questions about possible inferential
  • 44. statistics to use. Readability, Style, and Mechanics 1 Point Points Earned .95 /1 Additional Comments: Sentences are complete, clear, and concise. Rules of grammar are followed. See correct format for figures and tables in Center for Writing Excellence. (Title, labels, location etc) APA format? Figures should have a title and be labeled when they appear in the document. https://owl.english.purdue.edu/owl/resource/560/19/ The paper, including the title page, reference page, tables, and appendixes, follows APA formatting guidelines, including effective use of style. The paper is no more than 700 words. Total 5 Points Points Earned 4.95/5 Overall Comments: Production before Coffee 18200.0 16200.0 17200.0 18700.0 18400.0 16600.0 14900.0 16800.0 12100.0 10800.0 18500.0 14550.0
  • 45. Production after Coffee 19500.0 18220.0 21100.0 23900.0 22100.0 22600.0 22600.0 17400.0 16300.0 18000.0 22100.0 25000.0 Production Before Coffee Bar 18200.0 16200.0 17200.0 18700.0 18400.0 16600.0 14900.0 16800.0 12100.0 10800.0 18500.0 14550.0 Months Productivity Production After Coffee Bar 19500.0 18220.0 21100.0 23900.0 22100.0 22600.0 22600.0 17400.0 16300.0 18000.0 22100.0 25000.0 Months Productivity BoxPlot 10800.0 14812.5 14812.5 16700.0 16700.0 16700.0 18250.0 18250.0 18700.0 18250.0 18250.0 14812.5 14812.5 2.0 2.0 3.0 3.0 1.0 3.0 3.0 2.0 2.0 2.0 1.0 1.0 2.0 Production Before Coffee Bar
  • 46. BoxPlot 16300.0 18165.0 18165.0 21600.0 21600.0 21600.0 22600.0 22600.0 25000.0 22600.0 22600.0 18165.0 18165.0 2.0 2.0 3.0 3.0 1.0 3.0 3.0 2.0 2.0 2.0 1.0 1.0 2.0 Production After Coffee Bar Running Head: DESCRIPTIVE STATISTICS AND INTERPRETATION 1 DESCRIPTIVE STATISTICS AND INTERPRETATION 8Descriptive Statistics and InterpretationQNT/561 August 4, 2014 Matthew Radio Descriptive Statistics and Interpretation After collecting the data for Tarlich Supermarket, the next step was to use statistics to describe, analyze, and interpret the data. For the study, the independent variable is the amount of produce inventory ordered, and the dependent variable is the loss due to spoilage. The research question for the study asks if the percentage of food thrown out, at Tarlich Supermarket, due to spoilage is higher than the industry average. Data Collection and Descriptive Statistics Appendix A shows the raw data collected and the calculated percentage of food thrown away. The sample was chosen by recording every third shipment of perishable foods, which came in every two days. Using the percentage of food thrown away, histograms were created to assess the distribution; refer to Appendix B. Since the data is normally distributed
  • 47. , the appropriate descriptive statistics to use are the mean and standard deviation. Calculations for the descriptive statistics can be found in Appendix C. Percentage of Perishable Food Thrown Out The perishable foods in each shipment were divided into three categories before the data was recorded. The descriptive statistics shows that an average of 9.5 percent of fruits and vegetables, 6.4 percent of meat and poultry, and 12.9 percent of seafood in each shipment is thrown out. Descriptive Statistics Interpretation One hundred shipments were randomly selected and their perishable food content for each of three groups recorded, in pounds. The number of pounds later thrown out per shipment was also recorded, and the percentage of perishables thrown out calculated per group. It was found that 8.2 to 11.3 percent of fruits and vegetables, 5.0 to 7.3 percent of meat and poultry, and 9.8 to 15.6 percent of seafood spoil before being sold. The average percent of food thrown away was 9.5 percent for fruits and vegetables, 6.4 percent for meat and poultry, and 12.9 percent for seafood, with a standard deviation of 1.0, 0.6, and 1.6 percent, respectively. There is 90% confidence that the population percentage of spoiled food average is between 9.4 and 9.7 percent for fruits and vegetables, 6.3 and 6.5 percent for meat and poultry, and 12.6 and 13.1 percent for seafood. Conclusion Using the sampling and data collection plan, Tarlich was able to collect information for the sample of shipments needed. Once the information was gathered and divided into the determined groups, Tarlich performes descriptive statistics on the data.
  • 48. Interpretation of the descriptive statistics has helped Tarlich supermarket calculate what the spoil rate for their different perishables are. The research study will continue on to determine a course of action for the store.Appendix A: Raw Data Appendix A: Raw Data Continued Day sample taken Fruits And Vegetables Meat and Poultry Seafood Fruits And Vegetables Meat and Poultry Seafood Fruits And Vegetables Meat and Poultry Seafood mon1801808017.211.210.29.6%6.2%12.8% sun1901909016.49.812.38.6%5.2%13.7% sat20020010020.312.311.510.2%6.2%11.5% fri 20020010016.513.212.28.3%6.6%12.2% thurs1901909018.411.59.89.7%6.1%10.9% wed1801808019.712.610.910.9%7.0%13.6% tues1801808019.612.012.510.9%6.7%15.6% mon1801808020.111.910.411.2%6.6%13.0%
  • 49. sun1901909017.912.311.79.4%6.5%13.0% sat20020010016.512.99.98.3%6.5%9.9% fri20020010016.411.410.88.2%5.7%10.8% thurs1901909020.39.911.510.7%5.2%12.8% wed1801808016.513.112.29.2%7.3%15.3% tues1801808019.612.712.210.9%7.1%15.3% mon1801808020.111.69.811.2%6.4%12.3% sun1901909017.99.810.99.4%5.2%12.1% sat20020010017.912.312.59.0%6.2%12.5% fri20020010016.512.910.98.3%6.5%10.9% thurs1901909016.411.412.58.6%6.0%13.9% wed1801808017.29.910.49.6%5.5%13.0% tues1801808016.413.111.79.1%7.3%14.6% mon1801808020.311.99.911.3%6.6%12.4% sun1901909016.512.310.88.7%6.5%12.0% sat20020010019.712.912.39.9%6.5%12.3% fri20020010019.612.311.59.8%6.2%11.5% thurs1901909020.112.912.210.6%6.8%13.6% wed1801808017.911.412.59.9%6.3%15.6% tues1801808016.59.910.49.2%5.5%13.0% mon1801808016.413.111.79.1%7.3%14.6% sun1901909020.312.79.910.7%6.7%11.0% sat20020010020.311.610.810.2%5.8%10.8% fri20020010016.512.311.58.3%6.2%11.5% thurs1901909019.713.212.210.4%6.9%13.6% wed1801808019.611.512.210.9%6.4%15.3% tues1801808016.512.610.49.2%7.0%13.0% mon1801808016.412.011.79.1%6.7%14.6% sun1901909017.211.99.99.1%6.3%11.0% sat20020010016.412.310.88.2%6.2%10.8% fri20020010020.312.912.310.2%6.5%12.3% thurs1901909016.511.411.58.7%6.0%12.8% wed1801808016.59.912.29.2%5.5%15.3% tues1801808019.713.112.510.9%7.3%15.6% mon1801808019.613.110.410.9%7.3%13.0% sun1901909016.512.711.78.7%6.7%13.0%
  • 50. sat20020010016.411.69.98.2%5.8%9.9% fri20020010017.212.310.88.6%6.2%10.8% thurs1901909016.512.011.58.7%6.3%12.8% wed1801808016.511.912.29.2%6.6%15.3% tues1801808019.712.312.210.9%6.8%15.3% mon1801808020.312.910.411.3%7.2%13.0% sun1901909016.511.411.78.7%6.0%13.0% sat20020010019.79.99.99.9%5.0%9.9% fri20020010019.612.710.89.8%6.4%10.8% thurs1901909020.111.612.310.6%6.1%13.7% wed1801808019.712.310.810.9%6.8%13.5% tues1801808020.312.011.511.3%6.7%14.4% mon1801808016.511.912.29.2%6.6%15.3% sun1901909016.412.312.28.6%6.5%13.6% sat20020010017.212.39.88.6%6.2%9.8% fri20020010016.512.910.98.3%6.5%10.9% thurs1901909016.511.412.58.7%6.0%13.9% wed1801808019.79.912.210.9%5.5%15.3% tues1801808020.312.710.411.3%7.1%13.0% mon1801808020.111.611.711.2%6.4%14.6% sun1901909019.712.310.910.4%6.5%12.1% sat20020010020.311.612.510.2%5.8%12.5% fri20020010016.512.312.28.3%6.2%12.2% thurs1901909016.412.010.48.6%6.3%11.6% wed1801808017.211.912.29.6%6.6%15.3% tues1801808016.512.310.49.2%6.8%13.0% mon1801808017.212.311.79.6%6.8%14.6% sun1901909016.512.99.98.7%6.8%11.0% sat20020010016.511.410.88.3%5.7%10.8% fri20020010019.79.912.39.9%5.0%12.3% thurs1901909020.312.710.810.7%6.7%12.0% wed1801808016.512.99.89.2%7.2%12.3% tues1801808016.411.410.99.1%6.3%13.6% mon1801808017.29.912.59.6%5.5%15.6% sun1901909016.513.112.28.7%6.9%13.6% sat20020010017.212.710.48.6%6.4%10.4%
  • 51. fri20020010016.511.612.28.3%5.8%12.2% thurs1901909016.512.310.48.7%6.5%11.6% wed1801808019.713.211.710.9%7.3%14.6% tues1801808020.312.39.911.3%6.8%12.4% mon1801808016.512.310.89.2%6.8%13.5% sun1901909016.412.912.38.6%6.8%13.7% sat20020010016.511.410.88.3%5.7%10.8% fri20020010016.49.912.28.2%5.0%12.2% thurs1901909017.212.710.49.1%6.7%11.6% wed1801808016.512.911.79.2%7.2%14.6% tues1801808017.211.49.99.6%6.3%12.4% mon1801808016.59.910.89.2%5.5%13.5% sun1901909016.513.112.38.7%6.9%13.7% sat20020010019.712.310.89.9%6.2%10.8% fri20020010020.312.912.210.2%6.5%12.2% thurs1901909016.511.410.48.7%6.0%11.6% wed1801808016.59.911.79.2%5.5%14.6% tues1801808019.712.710.810.9%7.1%13.5% mon1801808020.311.612.311.3%6.4%15.4% sun1901909016.512.310.88.7%6.5%12.0% Weight (lb) arrived in shipment Weight (lb) thrown away due to spoilage Percentage thrown away Appendix B: Histograms Day sample taken Fruits And Vegetables Meat and Poultry Seafood Fruits And
  • 52. Vegetables Meat and Poultry Seafood Fruits And Vegetables Meat and Poultry Seafood mon1801808017.211.210.29.6%6.2%12.8% sun1901909016.49.812.38.6%5.2%13.7% sat20020010020.312.311.510.2%6.2%11.5% fri 20020010016.513.212.28.3%6.6%12.2% thurs1901909018.411.59.89.7%6.1%10.9% wed1801808019.712.610.910.9%7.0%13.6% tues1801808019.612.012.510.9%6.7%15.6% mon1801808020.111.910.411.2%6.6%13.0% sun1901909017.912.311.79.4%6.5%13.0% sat20020010016.512.99.98.3%6.5%9.9% fri20020010016.411.410.88.2%5.7%10.8% thurs1901909020.39.911.510.7%5.2%12.8% wed1801808016.513.112.29.2%7.3%15.3% tues1801808019.612.712.210.9%7.1%15.3% mon1801808020.111.69.811.2%6.4%12.3% sun1901909017.99.810.99.4%5.2%12.1% sat20020010017.912.312.59.0%6.2%12.5% fri20020010016.512.910.98.3%6.5%10.9% thurs1901909016.411.412.58.6%6.0%13.9% wed1801808017.29.910.49.6%5.5%13.0% tues1801808016.413.111.79.1%7.3%14.6% mon1801808020.311.99.911.3%6.6%12.4% sun1901909016.512.310.88.7%6.5%12.0% sat20020010019.712.912.39.9%6.5%12.3% fri20020010019.612.311.59.8%6.2%11.5% thurs1901909020.112.912.210.6%6.8%13.6%
  • 53. wed1801808017.911.412.59.9%6.3%15.6% tues1801808016.59.910.49.2%5.5%13.0% mon1801808016.413.111.79.1%7.3%14.6% sun1901909020.312.79.910.7%6.7%11.0% sat20020010020.311.610.810.2%5.8%10.8% fri20020010016.512.311.58.3%6.2%11.5% thurs1901909019.713.212.210.4%6.9%13.6% wed1801808019.611.512.210.9%6.4%15.3% tues1801808016.512.610.49.2%7.0%13.0% mon1801808016.412.011.79.1%6.7%14.6% sun1901909017.211.99.99.1%6.3%11.0% sat20020010016.412.310.88.2%6.2%10.8% fri20020010020.312.912.310.2%6.5%12.3% thurs1901909016.511.411.58.7%6.0%12.8% wed1801808016.59.912.29.2%5.5%15.3% tues1801808019.713.112.510.9%7.3%15.6% mon1801808019.613.110.410.9%7.3%13.0% sun1901909016.512.711.78.7%6.7%13.0% sat20020010016.411.69.98.2%5.8%9.9% fri20020010017.212.310.88.6%6.2%10.8% thurs1901909016.512.011.58.7%6.3%12.8% wed1801808016.511.912.29.2%6.6%15.3% tues1801808019.712.312.210.9%6.8%15.3% mon1801808020.312.910.411.3%7.2%13.0% sun1901909016.511.411.78.7%6.0%13.0% sat20020010019.79.99.99.9%5.0%9.9% fri20020010019.612.710.89.8%6.4%10.8% thurs1901909020.111.612.310.6%6.1%13.7% wed1801808019.712.310.810.9%6.8%13.5% tues1801808020.312.011.511.3%6.7%14.4% mon1801808016.511.912.29.2%6.6%15.3% sun1901909016.412.312.28.6%6.5%13.6% sat20020010017.212.39.88.6%6.2%9.8% fri20020010016.512.910.98.3%6.5%10.9% thurs1901909016.511.412.58.7%6.0%13.9% wed1801808019.79.912.210.9%5.5%15.3%
  • 54. tues1801808020.312.710.411.3%7.1%13.0% mon1801808020.111.611.711.2%6.4%14.6% sun1901909019.712.310.910.4%6.5%12.1% sat20020010020.311.612.510.2%5.8%12.5% fri20020010016.512.312.28.3%6.2%12.2% thurs1901909016.412.010.48.6%6.3%11.6% wed1801808017.211.912.29.6%6.6%15.3% tues1801808016.512.310.49.2%6.8%13.0% mon1801808017.212.311.79.6%6.8%14.6% sun1901909016.512.99.98.7%6.8%11.0% sat20020010016.511.410.88.3%5.7%10.8% fri20020010019.79.912.39.9%5.0%12.3% thurs1901909020.312.710.810.7%6.7%12.0% wed1801808016.512.99.89.2%7.2%12.3% tues1801808016.411.410.99.1%6.3%13.6% mon1801808017.29.912.59.6%5.5%15.6% sun1901909016.513.112.28.7%6.9%13.6% sat20020010017.212.710.48.6%6.4%10.4% fri20020010016.511.612.28.3%5.8%12.2% thurs1901909016.512.310.48.7%6.5%11.6% wed1801808019.713.211.710.9%7.3%14.6% tues1801808020.312.39.911.3%6.8%12.4% mon1801808016.512.310.89.2%6.8%13.5% sun1901909016.412.912.38.6%6.8%13.7% sat20020010016.511.410.88.3%5.7%10.8% fri20020010016.49.912.28.2%5.0%12.2% thurs1901909017.212.710.49.1%6.7%11.6% wed1801808016.512.911.79.2%7.2%14.6% tues1801808017.211.49.99.6%6.3%12.4% mon1801808016.59.910.89.2%5.5%13.5% sun1901909016.513.112.38.7%6.9%13.7% sat20020010019.712.310.89.9%6.2%10.8% fri20020010020.312.912.210.2%6.5%12.2% thurs1901909016.511.410.48.7%6.0%11.6% wed1801808016.59.911.79.2%5.5%14.6% tues1801808019.712.710.810.9%7.1%13.5%
  • 55. mon1801808020.311.612.311.3%6.4%15.4% sun1901909016.512.310.88.7%6.5%12.0% Weight (lb) arrived in shipment Weight (lb) thrown away due to spoilage Percentage thrown away Appendix C: Descriptive Statistics Percentage of Fruits and Vegetables Thrown Away Due to Spoilage Central Tendency: Mean = 9.5% Dispersion: Standard Deviation = 1.0% Number: 100 Min/Max: 8.2% and 11.3% Confidence Interval: 9.4% to 9.7% Percentage of Meat and Poultry Thrown Away Due to Spoilage Central Tendency: Mean = 6.4% Dispersion: Standard Deviation = 0.6% Number: 100 Min/Max: 5.0% and 7.3% Confidence Interval: 6.3% to 6.5% Percentage of Seafood Thrown Away Due to Spoilage Central Tendency: Mean = 12.9% Dispersion: Standard Deviation = 1.6% Number: 100 Min/Max: 9.8% and 15.6% Confidence Interval: 12.6% to 13.1% Content and Development 4 Points Points Earned 3.8/4 Additional Comments: All key elements of the assignment are covered in a substantive
  • 56. way, including: · Excel Spreadsheet was created. · Variables are listed. · Descriptive stats provided · Applicable charts/graphs displayed.. · Interpretation of statistics given. Good job. See comments above. Readability, Style, and Mechanics 1 Point Points Earned .95 /1 Additional Comments: Sentences are complete, clear, and concise. Rules of grammar are followed. See correct format for figures and tables in Center for Writing Excellence. (Title, labels, location etc) The paper, including the title page, reference page, tables, and appendixes, follows APA formatting guidelines, including effective use of style. The paper is no more than 700 words. Total 5 Points Points Earned
  • 57. 4.75/5 Overall Comments: �Not yet, really. This is inferential statistics. �Do you want to consider a two-tailed test? It would be good for Tarlich if they were lower, right? �No! Why do you say this? Normality is quite an assumption. Generally to determine normality you would have to look at a frequency histogram. You would divide the variable pounds into intervals of say 100. How many shipments were between 24 and 25 hundred pounds? How may were between 25 and 26? 26 and 27? Etc. Then you plot a frequency distribution . If it is bell shaped, then the data is approximately normal. �A question to consider as a team is whether this division of food types should give way to 3 separate research questions.
  • 58. Generally, stratified sampling is used to make sure each subgroup is represented in one population. The population parameter applies to all the subgroups. Here it seems that the various food groups should and do have different shelf lives. Is it fair to lump them into one percentage that describes all perishable items? Your call. You could argue either way. �None of these “bar graphs” are bell shaped. SHORT TITLE OF PAPER 1 Running head: DESCRIPTIVE STATISTICS 1Descriptive StatisticsNameQNT/561 Date Instructor’s NameDescriptive Statistics Determine the appropriate descriptive statistics. Note: If the data was normally distributed, use the mean and standard deviation. If the data was skewed significantly, use the median and interquartile range. Numeric Variable Name1 Distribution: State if not normally distributed
  • 59. Central Tendency: Dispersion: Number: Min/Max: Confidence Interval: (if distribution is normal) Numeric Variable Name2 (if applicable) Distribution: State if not normally distributed Central Tendency: Dispersion: Number: Min/Max: Confidence Interval: (if distribution is normal) Attribute Variable Name (if applicable) Create a bar chart. Describe the proportions. Descriptive Statistics Interpretation Numeric Variable Name1 Describe the variable in laymen terms. Numeric Variable Name2 (if applicable) Describe the variable in laymen terms. Appendix A Raw data used in the analysis Fit data to one page. Appendix B Charts and Tables This part of the paper will include items that are then cited in the body of the paper. Usually, large items are placed here not to distract from reading the paper. Appendix C Descriptive Statistics
  • 60. This part of the paper will include descriptive statistics. Individual Assignment Think about your learning team's research question and figure out what data would need to be collected from the sample, so that the organization has the information necessary to solve its dilemmas. Create a Microsoft® Excel® spreadsheet with data for the variables that you deem necessary. The data may come from an existing data set (textbook, online) or it may be data that you pretend to collect from your sample. Analyze the data with Microsoft® Excel® or other statistical tool(s), including: · Descriptive stats for each numeric variable · Histogram for each numeric variable · Bar chart for each attribute (non numeric) variable · Scatter plot if the data contains two numeric variables Determine the appropriate descriptive statistics. · For normally distributed data use the mean and standard deviation. · For significantly skewed data use the median and interquartile range. Use theIndividual Methodology Findings Templateto complete the descriptive statistics. Use the Descriptive Statistics and Interpretation Exampleto develop an interpretation of the descriptive statistics. Also use the sample papers that you will find in my discussion post below. Format your paper consistent with APA and UoPX writing guidelines for this level course. Submit both the spreadsheet and the completed Individual
  • 61. Methodology Findings Template to the Assignment Files tab..