Marketplace and Quality Assurance Presentation - Vincent Chirchir
Assignment ba sp
1. Ahmad Jahanzaib
183300
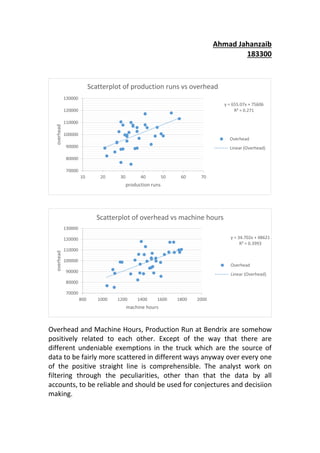
Overhead and Machine Hours, Production Run at Bendrix are somehow
positively related to each other. Except of the way that there are
different undeniable exemptions in the truck which are the source of
data to be fairly more scattered in different ways anyway over every one
of the positive straight line is comprehensible. The analyst work on
filtering through the peculiarities, other than that the data by all
accounts, to be reliable and should be used for conjectures and decisiion
making.
y = 655.07x + 75606
R² = 0.271
70000
80000
90000
100000
110000
120000
130000
10 20 30 40 50 60 70
overhead
production runs
Scatterplot of production runs vs overhead
Overhead
Linear (Overhead)
y = 34.702x + 48621
R² = 0.3993
70000
80000
90000
100000
110000
120000
130000
800 1000 1200 1400 1600 1800 2000
overhead
machine hours
Scatterplot of overhead vs machine hours
Overhead
Linear (Overhead)