AWS Community Day CPH - Three problems of Terraform
Facebook insights (2)
1. Alex Palermo
psychic@tremont-tearoom.com
Example Company
(999) 999-9999
http://yourwebsite.com
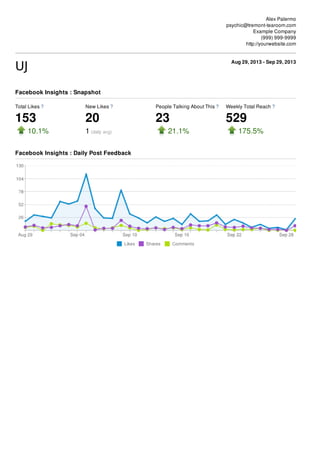
Aug 29, 2013 - Sep 29, 2013
UJUJ
Total Likes ?
153
10.1%
New Likes ?
20
1 (daily avg)
People Talking About This ?
23
21.1%
Weekly Total Reach ?
529
175.5%
Facebook Insights : Snapshot
Facebook Insights : Daily Post Feedback
2. Top 10 by Talking About This
TypeType DateDate PostPost ReachReach 11 EngagedEngaged
UsersUsers 22
TalkingTalking
About ThisAbout This 33 ViralityVirality 44
Sep 5, 2013 (From the CEO) 1638 139 107 6.53%
Sep 9, 2013
Monday 9/9/13
Live Talk
Radio...
1298 76 59 4.55%
Sep 20, 2013
Friday 9/20/13
Live radio
Shows...
829 116 44 5.31%
Sep 29, 2013
Sunday 9/29/13
Live Shows
(AKA...
571 37 25 4.38%
Sep 19, 2013
Thurs 9/19/13
Live Radio
shows...
536 32 24 4.48%
Sep 6, 2013
This is our
newest member
of the...
271 45 21 7.75%
Sep 7, 2013
Being fearless
does not
mean...
638 26 20 3.13%
Sep 9, 2013
go live in 10
minutes......
325 22 16 4.92%
Sep 10, 2013
I am very proud
of my brother...
433 51 15 3.46%
Sep 15, 2013
Sunday 9/15/13
Live Radio
Shows...
263 20 14 5.32%
1. The number of unique people who have seen your post. Click on the number to see more details. Figures are for the first 28
days after a post's publication only. Click on "Reach" to sort your posts.
2. The number of unique people who have clicked on your post. Click on the number to see more details. Figures are for the first
28 days after a post's publication only. Click on "Engaged Users" to sort your posts.
3. The number of unique people who have created a story from your Page post. Stories are created when someone likes,
comments on or shares your post; answers a question you posted; or responds to your event. Click on the number to see
more details. Figures are for the first 28 days after a post's publication only. Click on "Talking About This" to sort your posts.
4. The percentage of people who have created a story from your Page post out of the total number of unique people who have
seen it. Click on "Virality" to sort your posts.
Facebook Insights : Per-Post Metrics Top 10
3. Countries Likes
United States 1,389
United Kingdom 82
Canada 61
Nigeria 30
Australia 28
India 26
South Africa 22
Brazil 21
Turkey 18
Kenya 17
35 more countries 208
Facebook Insights : Likes by Region Facebook Insights : Likes by Demographic -
Graphical
Age Male Female
13-17 2% 1.4%
18-24 9.9% 2.6%
25-34 9% 8.1%
35-44 8.9% 12.5%
45-54 8.5% 16.2%
55-64 5.2% 9.3%
65+ 2.5% 3%
Facebook Insights : Likes by Demographic -
Tabular
Facebook Insights : Daily Likes
4. Languages Likes
U.S. English 1,615
British English 182
Spanish (Laos) 23
Brazilian Portuguese 18
French (France) 17
Turkish (Turkey) 15
Iberian Spanish 10
Italian (Italy) 10
Greek (Greece) 10
German (Germany) 8
24 more languages 60
Facebook Insights : Likes by Language
Sources Likes
Page Profile 93
External Connect 38
Mobile 34
Reminder Box Invite 30
Page Invite 17
Mobile Ads 9
Fan Context Story 6
Invitations 5
Search 4
Hovercard 4
21 more sources 12
Facebook Insights : Likes by Source