
Recommended
More Related Content
More from SKF
More from SKF (20)
Skf diagram
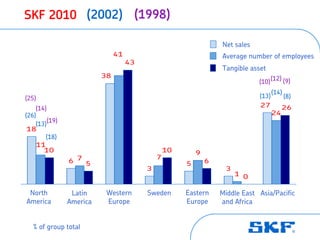
- 1. SKF 2010 (2002) (1998) Net sales 41 Average number of employees 43 Tangible asset 38 (12) (9) (10) (14) (25) (13) (8) (14) 27 26 (26) 24 (19) (13) 18 (18) 11 10 10 9 7 6 7 5 5 6 3 3 1 0 North Latin Western Sweden Eastern Middle East Asia/Pacific America America Europe Europe and Africa % of group total