IRJET- Review Paper on – ERP System for Departmental Activity Management
FinalProject_IST722_2
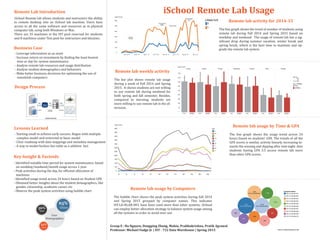
1. iSchool Remote Lab Usage
Business Case
Remote Lab Introduction
Design Process
Lessons Learned
Key Insight & Factoids
Sunday Monday Tuesday Wednesday Thursday Friday Saturday
FALL SPRING FALL SPRING FALL SPRING FALL SPRING FALL SPRING FALL SPRING FALL SPRING
0
150
300
450
600
750
900
1050
1200
1350
0 2 4 6 8 10 12 14 16 18 20 22
0
50
100
150
200
250
300
350
400
450
500
550 GPA
0
0.5
1
1.5
2
2.5
3
3.5
4
Jun 15, 14 Jul 27, 14 Sep 7, 14 Oct 19, 14 Nov 30, 14 Jan 11, 15 Feb 22, 15 Apr 5, 15
0
100
200
300
400
500
600
Spring Break
Dip
Winter Break
Thanksgiving
Break
Summer
Vacation
IsWeekdayYesNo
N
Y
Am Pm
AM
PM
FALL-SPRING
FALL
SPRING
iSchool Remote lab allows students and instructors the ability
to remote desktop into an iSchool lab machine. Users have
access to all the same software and resources as in physical
computer lab, using both Windows or Mac.
There are 35 machines in the IST pool reserved for students
and 8 machines under Test pool for instructors and falcuties.
- Leverage information as an asset
- Increase return on investment by �inding the least busiest
time or day for system maintainance
- Analyze remote lab resources and usage distribution
- Analyze student demographics and behaviors
- Make better business decisions for optimizing the use of
remotelab computers
Remote lab activity for 2014-15
The line graph shows the trend of number of students using
remote lab during Fall 2014 and Spring 2015 based on
weekday and weekend. The usage of remote lab has a sig-
ni�icant drop during summer vacation, winter break and
spring break, which is the best time to maintain and up-
grade the remote lab system.
- Starting small to achieve early success. Begun with multiple
complex model and restricted to basic model
- Clear roadmap with data mappings and metadata management
- A way to model factless fact table as a additive fact
- Identi�ied suitable time period for system maintenance, based
on weekday/weekend/month usage across 1 year
- Peak activities during the day, for ef�icient allocation of
machines
- Identi�ied usage trend across 24 hours based on Student GPA
- Obtained better insights about the student demographics, like
gender, citizenship, academic career, etc
- Observe the peak system activities using bubble chart
695
874
984
897
1,212
1,105
1,643
IST-LD-RLAB-H04
1,028
1,919
IST-LD-RLAB-H02
2,163
IST-LD-RLAB-H01
Computer Name
IST-LD-RLAB-H01
IST-LD-RLAB-H02
IST-LD-RLAB-H03
IST-LD-RLAB-H04
IST-LD-RLAB-H05
IST-LD-RLAB-H06
IST-LD-RLAB-H07
IST-LD-RLAB-H08
IST-LD-RLAB-H09
IST-LD-RLAB-H10
User
Demographics
65%
Citizen56%
Male
54%
Male
Grad
Login Count
Login Count
Login Count
Group E : Ha Nguyen, Dongping Zhang, Mahin, Prabhukrishna, Pratik Agrawal
Professor: Michael Fudge Jr. | IST - 722 Data Warehouse | Spring 2015
Remote lab weekly activity
The bar plot shows remote lab usage
during a week of Fall 2014 and Spring
2015. It shows students are not willing
to use remote lab during weekend for
both spring and fall semester. Besides,
compared to morning, students are
more willing to use remote lab in the af-
ternoon.
Remote lab usage by Time & GPA
The line graph shows the usage trend across 24
hours based on students’ GPA. The trends of all the
GPA scores is similar, activity linearly increasing to-
wards the evening and dipping after mid-night. Also
students having GPA 3.5 access remote lab more
than other GPA scores.
Remote lab usage by Computers
The bubble chart shows the peak system activities during Fall 2014
and Spring 2015 grouped by computer names. This indicates
IST-LD-RLAB-H01 have been used more than other systems. iSchool
can employ better allocation strategy to balance system usage among
all the systems in order to avoid over-use
Source: iSchool Remote Lab