1. American International Journal of Business Management (AIJBM)
ISSN- 2379-106X, www.aijbm.com Volume 3, Issue 12 (December 2020), PP 51-56
*Corresponding Author: Encep Huda Cindarsah www.aijbm.com 51 | Page
The Effect of Financial Performance on the Stock Price of
PT. Unilever Indonesia, TBK
Encep Huda Cindarsah
(Management, Perbanas Institute, Jakarta, Indonesia)
*Corresponding Author: Encep Huda Cindarsah
ABSTRACT : The study aims to determine the effect of Financial Performance consisting of Current Ratio
(CR), Earning Per Share (EPS), and Return on Equity (ROE) on the Stock Price of PT. Unilever Indonesia, Tbk
for the 2011 – 2018 periods. The research method used in this research is quantitative methods. The type of data
used in this study is Time Series data during the first quarter of 2011 to the fourth quarter of 2018 from PT.
Unilever Indonesia, Tbk as the research sample. The data source used comes from secondary data that has been
published and accessed through the Indonesia Stock Exchange website www.idx.go.id. The data collection
method used in this study was purposive sampling method. The analysis in this study uses multiple linear
regression analysis with the OLS (Ordinary Least Square) method. The result show that simultaneous variables
of financial performance consisting of Current Ratio (CR), Earning Per Share (EPS), and Return on Equity
(ROE) have a significant influence on The Stock Price of PT. Unilever Indonesia, Tbk for the 2011 – 2018
periods. Based on these results, PT Unilever Indonesia, Tbk need to increase CR, EPS, ROE in order to generate
higher the Stock Price. Furthermore, it is also necessary to carry out further research from other companies in
the consumer good sector that have been listed in Indonesia Stock Exchange.
KEYWORDS – Current Ratio, Earnings Per Share, Financial Performance, Return on Equity, Stock Price
I. INTRODUCTION
The company's financial performance can be measured by using fundamental analysis. Investors can
analyze balance reports, income statements, statement of changes in equity, statement of cash flows and
financial ratio analysis. The results of the ratio analysis are used as a basis for investors in making investment
decisions. Financial statements may use as a tool for performance measurement. Financial statements are the
primary means of communicating financial information both within the firm and outside the firm (Prastuti, D.,
& Setianingrum, P. H., 2019).
Companies that can generate profits every year will have the possibility to increase the demand for
shares owned by the company. If this happens, the company's stock price will indirectly increase higher than
before because of the trust of investors or potential investors in the company.
Investors in predicting stock prices on the Indonesia Stock Exchange use many fundamental and
technical approaches. Somethings that are included in the fundamental aspects of stocks are financial
performance, company industry, including company revenue and sales structure. The stock analysis approach
through a technical approach can also be carried out by investors apart from the fundamental approach (Tarmidi,
D., Pramukty, R., & Akbar, T., 2020).
One of the sectors listed on the capital market on the Indonesia Stock Exchange is consumer goods
industry. The consumer goods industry is a sector that is quite interesting because it produces consumer goods
needed in everyday human life such as the business sector of PT. Unilever Indonesia, Tbk.
PT. Unilever Indonesia, Tbk as a consumer goods sector company that has made an Initial Public
Offering (IPO) on the Indonesia Stock Exchange in 1982. During the period 2011-2018 PT Unilever Indonesia,
Tbk has always published its financial statements with the condition that the company never suffered a loss. In
that period too, the company was not delisted on the Indonesia Stock Exchange.
II. LITERATURE REVIEW
2.1. Investment
Tandelilin (2016: 2) states that investment is a commitment to a number of funds or other resources
made at this time, with the aim of obtaining a number of benefits in the future.
2.2. Stock
Proof of equity ownership in a company for investors is Stock, namely in the form of acquisition of
stocks. Investors who will invest in the company consider information about the company's financial
2. The Effect of Financial Performance on the Stock Price of PT. Unilever Indonesia, Tbk
*Corresponding Author: Encep Huda Cindarsah www.aijbm.com 52 | Page
performance or look for other alternatives. The better the company's financial performance, the higher the
company's value (Hapsoro & Husain, 2019).
2.3. Stock Price
Halimatussakdiah (2017) states that the stock price is the price of a stock in the ongoing market, if the
market is closed, the stock price is the closing price.
The stock price determines the shareholder's wealth. Maximization of shareholder wealth is translated
into maximizing the company's share price (Brigham and Houston, 2010: 7).
2.4. Current Ratio (CR)
Kasmir (2015: 111) states that the current ratio is a ratio to measure the company's ability to pay short-
term obligations or debts that are due immediately when they are collected as a whole.
The better the company is in managing its short term debt, the better the company value will be.
Investors will be interested in investing in the company if there is an increase in the value of the company's
stocks because it will provide high stock returns for investors (Hapsoro & Husain, 2019).
2.5. Earning Per Share (EPS)
Salamun and Isworo (2013: 26) states that Earning Per Share (EPS) or earnings per share is a measure
of a company's ability to generate profits per share of the owner. The profit used as a measure is profit for the
owner or profit after tax.
2.6. Return on Equity (ROE)
Kasmir (2015: 11) states that Return on Equity (ROE) is a ratio used to measure a company's ability to
generate net income based on certain share capital, this ratio is a measure of profitability from the perspective of
shareholders.
Return on Equity (ROE) is the company's ability to generate profits with its own capital, so that this
ROE is called its own capital profitability (Salamun and Isworo, 2013).
2.7. Hypothesis
Figure 2.1 Research Framework
The hypothesis in this study is as follows:
H1: There is an effect of Current Ratio (CR) on the Stock Price of PT. Unilever Indonesia, Tbk for the 2011 –
2018 periods;
H2: There is an effect of Earning Per Share (EPS) on the Stock Price of PT. Unilever Indonesia, Tbk for the
2011 – 2018 periods;
H3: There is an effect of Return on Equity (ROE) on the Stock Price of PT. Unilever Indonesia, Tbk for the
2011 – 2018 periods;
III. RESEARCH METHODE
The research method used in this research is quantitative methods. The samples used in this research
are Current Ratio (CR), Earning Per Share (EPS), Return on Equity (ROE) and PT. Unilever Indonesia, Tbk
Current Ratio (X1)
Earning Per Share (X2)
Return on Equity (X3)
Stock Price (Y)
H1
H2
H3
3. The Effect of Financial Performance on the Stock Price of PT. Unilever Indonesia, Tbk
*Corresponding Author: Encep Huda Cindarsah www.aijbm.com 53 | Page
which is listed on the Indonesia Stock Exchange which was formed during the first quarter of 2011 to the fourth
quarter of 2018 is used in this research. The company uses the unit of Rupiah (IDR) in financial statements.
The samples used as data in this study are as follows:
a. PT. Unilever Indonesia, Tbk as a consumer goods sector company that has made an Initial Public Offering
(IPO) on the Indonesia Stock Exchange prior to the period 2011-2018;
b. PT. Unilever Indonesia, Tbk as a consumer goods sector company that has been listed on the Indonesia
Stock Exchange which always announces company performance through the publication of financial reports
during the 2011-2018 period;
c. PT. Unilever Indonesia, Tbk as a consumer goods sector company that was not delisted on the Indonesia
Stock Exchange during the 2011-2018 period;
d. PT. Unilever Indonesia, Tbk as a consumer goods sector company that has never suffered a financial loss
during the 2011-2018 period;
The type of data used in this study is Time Series data during the first quarter of 2011 to the fourth
quarter of 2018 from PT. Unilever Indonesia, Tbk as the research sample. The data source used comes from
secondary data that has been published and accessed through the Indonesia Stock Exchange website
www.idx.go.id. The data collection method used in this study was purposive sampling method.
The analysis in this study uses multiple linear regression analysis with the OLS (Ordinary Least
Square) method so that you will still be able to get BLUE β0, β1, β2 and β3 in order to obtain the regression line
as close as possible to the actual data. The general form of the multiple linear regression equation used in this
study is as follows:
Y = β0 + β1X1 + β2X2 + β3X3 + e
Where :
Y = Stock Price
β0, β1, β2, β3 = Constants / Slope
X1 = Current Ratio (CR)
X2 = Earning Per Share (EPS)
X3 = Return on Equity (ROE)
e = random error (error term)
IV. RESULT
4.1. Normality Test
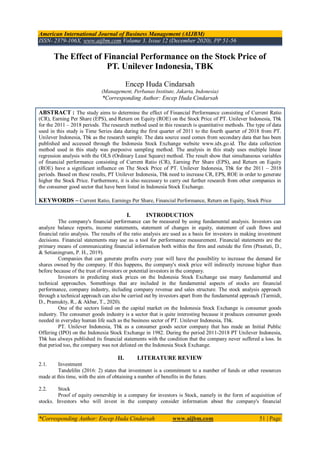
Figure 4.1 Normality Test
Source: Eviews Calculation Result
Based on the data above, it can be seen that each minimum value, maximum value, mean, and standard
deviation with a total of 32 data.
Based on these results it appears that the statistical value of the Jarque-Bera test is JB (0.104712) <X2
(9.49) or p-value (0.948991)> α (0.05), so the null hypothesis fails to be rejected, which means that the residuals
of the research model are normally distributed so that the T test and the F test can be done to see the significance
of the model.
Based on the results of the normality test above, the following are the results of multiple regression
calculations:
0
1
2
3
4
5
6
7
8
9
-2000 -1000 0 1000 2000 3000
Series: Residuals
Sample 2011Q1 2018Q4
Observations 32
Mean -6.82e-13
Median 122.9985
Maximum 2683.798
Minimum -2404.695
Std. Dev. 1265.072
Skewness -0.117265
Kurtosis 2.846606
Jarque-Bera 0.104712
Probability 0.948991
4. The Effect of Financial Performance on the Stock Price of PT. Unilever Indonesia, Tbk
*Corresponding Author: Encep Huda Cindarsah www.aijbm.com 54 | Page
Dependent Variable: Stock_Price
Method: Least Squares
Date: 11/29/20 Time: 14:47
Sample: 2011Q1 2018Q4
Included observations: 32
Variable Coefficient Std. Error t-Statistic Prob.
C 26890.70 3597.807 7.474191 0.0000
CR -23862.87 4034.095 -5.915296 0.0000
ROE -11972.20 1747.422 -6.851353 0.0000
EPS 14.09273 1.967592 7.162424 0.0000
R-squared 0.704261 Mean dependent var 6865.156
Adjusted R-squared 0.672575 S.D. dependent var 2326.277
S.E. of regression 1331.120 Akaike info criterion 17.34190
Sum squared resid 49612656 Schwarz criterion 17.52511
Log likelihood -273.4704 Hannan-Quinn criter. 17.40263
F-statistic 22.22608 Durbin-Watson stat 0.995169
Prob(F-statistic) 0.000000
Table 4.1 Multiple Regression Test Results
Source: Eviews Calculation Result
4.2. The Classic Assumption Test
4.2.1. Multikolinearitas Test
CR EPS ROE
CR 1.000000 -0.477716 -0.693540
EPS -0.477716 1.000000 0.869237
ROE -0.693540 0.869237 1.000000
Table 4.2 Multikolinearitas Test
Source: Eviews Calculation Result
From the results of the correlation coefficient test between the independent variables, there is no
multicollinearity between the independent variables CR and EPS, CR and ROE, EPS and CR, and ROE and CR
where the correlation value between the independent variables is below 0.85.
However, the correlation value between EPS and ROE variables is above 0.85. This indicates a
multicollinearity problem between the independent variables. The multicollinearity problem in the regression
equation in this study, the estimator is still BLUE so that individually the independent variables do not affect the
dependent variable through the t test and f test. Therefore, the authors did not make changes.
With the multicollinearity problem, the regression results still produce BLUE estimators because the
BLUE estimator problems do not require the assumption of no correlation between independent variables
(Widarjono 2016: 108-110).
4.3. Regression Analysis Results
Dependent Variable: Stock_Price
Method: Least Squares
Included observations: 32
Variable Coefficient Std. Error t-Statistic Prob.
C 26890.70 2392.173 11.24112 0.0000
CR -23862.87 2788.755 -8.556817 0.0000
ROE -11972.20 1376.985 -8.694503 0.0000
EPS 14.09273 2.478621 5.685715 0.0000
Table 4.3 Regression Analysis Results
Source: Eviews Calculation Result
5. The Effect of Financial Performance on the Stock Price of PT. Unilever Indonesia, Tbk
*Corresponding Author: Encep Huda Cindarsah www.aijbm.com 55 | Page
Multiple regression model in analyzing CR, ROE and EPS of PT. Unilever Indonesia, Tbk (UNVR) as
follows:
Y (UNVR) = β0 + β1 (CR) + β2 (ROE) + β3 (EPS) + e
Based on the results of multiple regression analysis in table 4.3 above, the coefficients for the
independent variables are CR = -23862.87, ROE = -11972.20 and EPS = 14.09273, with an intercept / constant
of 26890.70. So that from these results the regression equation model is:
Y (UNVR) = 26890.70 - 23862.87 (CR) - 11972.20 (ROE) +14.09273 (EPS) + e
4.4. Hypothesis test
4.4.1. T Test
Dependent Variable: Stock_Price
Method: Least Squares
Included observations: 32
Variable Coefficient Std. Error t-Statistic Prob.
C 26890.70 2392.173 11.24112 0.0000
CR -23862.87 2788.755 -8.556817 0.0000
ROE -11972.20 1376.985 -8.694503 0.0000
EPS 14.09273 2.478621 5.685715 0.0000
Table 4.4 T Test
Source: Eviews Calculation Result
4.4.2. F Test
F-statistic 22.22608
Prob(F-statistic) 0.000000
Table 4.5 Hypothesis Test (Simultaneous F)
Source: Eviews Calculation Result
4.5. Coefficient of Determination
R-squared 0.704261
Adjusted R-squared 0.672575
Table 4.6 Determination Coefficient Test (R2
)
Source: Eviews Calculation Result
V. CONCLUSION AND RECOMMENDATION
5.1. Analysis of the Effect of Current Ratio on the Stock Price
The variable Current Ratio (CR) partially has a significant correlation coefficient value to the stock
price of PT. Unilever Indonesia Tbk. This shows that the fluctuation in the value of the Current Ratio (CR) does
not affect the fluctuation of the Unilever Stock Price. This can be seen from the results of the t test calculation
for the CR variable, where t count (-8.556817) < t table (2.048).
Current Ratio (CR) is the liquidity ratio, this ratio is an indicator to describe the company's ability to
pay all short-term liabilities or debts that are due immediately when billed with current assets as a whole.
The results of this study indicate that PT. Unilever Indonesia, Tbk during the first quarter of 2011 to
the fourth quarter of 2018 has the ability to pay current debts (short-term debt) with its current assets. This
means that the current assets it owns are still greater than current debts that must be paid at maturity.
5.2. Analysis of the Effect of Earning Per Share on the Stock Price
Variable Earning Per Share (EPS) partially has a positive and significant correlation coefficient on the
stock price of PT. Unilever Indonesia Tbk. This illustrates that the fluctuation of the value of Earning Per Share
(EPS) greatly affects the fluctuation of the stock price. This can be seen in the results of the t test calculation for
the EPS variable, where t count (5.685715) > t table (2.048).
Earning Per Share is a profitability ratio, where this ratio is very important for investors because
through this ratio it can be seen to what extent the investment made by investors is able to provide a profit in
accordance with the expected level because EPS information can describe the earnings of a company in the
6. The Effect of Financial Performance on the Stock Price of PT. Unilever Indonesia, Tbk
*Corresponding Author: Encep Huda Cindarsah www.aijbm.com 56 | Page
future. With that, prospective shareholders will be very interested in investing because the higher the value of
EPS, the greater the profits will be
The results of this study indicate that the EPS value increased during the first quarter of 2011 to the
fourth quarter of 2018, PT. Unilever Indonesia, Tbk has shown better performance in generating operating
profits.
5.3. Analysis of the Effect of Return on Equity on the Stock Price
The variable Return on Equity (ROE) partially has a significant correlation coefficient value on the
stock price of PT. Unilever Indonesia Tbk. This shows that the fluctuation in the value of Return on Equity
(ROE) does not affect the rise and fall of Unilever's Stock Price. This can be seen from the results of the t test
calculation for the USD exchange rate variable, where t count (-8.694503)> t table (2.048).
Return on Equity (ROE) is the ratio of profitability, where this ratio is very important for investors
because through this ratio it can be seen the company's ability to generate profits with its own capital, so this
ROE is called its own capital profitability.
The results of this study indicate that all profits generated by PT. Unilever Indonesia, Tbk during the
first quarter of 2011 to the fourth quarter of 2018 showed that it was able to generate good enough profits so that
this could affect investors in investing their capital.
5.4. Simultaneous Analysis of the Effect of CR, ROE and EPS on The Stock Price
Current Ratio (CR), Return on Equity (ROE), and Earning Per Share (EPS) variables together have a
significant influence on The Stock Price of PT. Unilever Indonesia, Tbk for the 2011 – 2018 periods. This is
indicated by the value of F count (22.22608) > F table (2.82).
5.5. Determination Coefficient Test Results
From the results of these calculations, the influence of the independent variable on the dependent
variable which can be explained by the model in this equation is 0.704261 or 70.42%. This shows that the
variations in CR, ROE and EPS are able to explain variations in the rise or fall of the PT. Unilever Indonesia
Tbk amounted to 70.42% while the remaining 29.58% was explained by other variables not included in this
regression model.
5.6. Recommendation
Based on these results, PT Unilever Indonesia, Tbk need to increase Current Ratio, Earning Per Share,
and Return on Equity in order to generate higher the Stock Price. Furthermore, it is also necessary to carry out
further research from other companies in the consumer good sector that have been listed in Indonesia Stock
Exchange.
REFERENCES
[1]. Idx. (2011-2018). www.idx.co.id. Retrieved from www.idx.co.id.
[2]. Prastuti, D., & Setianingrum, P. H. (2019). Company Performance and Macroeconomics Variables
Influence on Stock Price. 74(AICMaR 2018), 32–35.
[3]. Tarmidi, D., Pramukty, R., & Akbar, T. (2020). Fundamental Analysis of Financial Ratios on Stock
Prices. Saudi Journal of Economics and Finance, 4(5), 176–180.
[4]. Tandelilin, E. (2016). "Portofolio dan Investasi, Teori dan Aplikasi", Yogyakarta: Penerbit Kanisius.
[5]. Hapsoro, D., & Husain, Z.F. (2019). Does sustainability report moderate the effect of financial
performance on investor reaction? Evidence of Indonesian listed firms. International Journal of
Business, 24(3), 308–328.
[6]. Halimahtussakdiah. (2018). Pengaruh Profitabilitas, Likuiditas dan Deviden per Share terhadap Harga
Saham pada Perusahaan LQ-45 yang terdaftar di Bursa Efek Indonesia. JurnalValuta Vol. 4 No 1.
[7]. Brigham, Eugene.F and Joel F. Houston, (2010). Dasar-Dasar Manajemen Keuangan, Alih Bahasa Ali
Akbar Yulianto, Edisi Kesebelas, Jilid I & II. Jakarta: Salemba Empat.
[8]. Kasmir. (2015). Analisis Laporan Keuangan. Jakarta: PT. Raja Grafindo Persada.
[9]. Isworo, FX and Salamun Suyono. (2013). Financial Management Investment Financing. IFM
Publishing. Jakarta. p. 26
[10]. Widarjono, Agus. (2016). Ekonometrika Pengantar dan Aplikasinya Disertai Panduan Eviews, edisi
keempat. UPP STIM YKPN, Yogyakarta, 108-110.
*Corresponding Author: Encep Huda Cindarsah
1
(Management, Perbanas Institute, Jakarta, Indonesia)