0001
•Download as DOCX, PDF•
0 likes•8 views
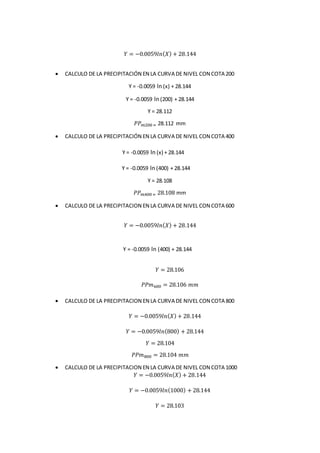
The document contains calculations of predicted precipitation (PP) levels along contour lines at different cotas or elevations using the equation Y = -0.0059ln(X) + 28.144. It performs these calculations for contour lines at 200, 400, 600, 800, 1000, and 1200 cotas and determines the predicted precipitation is 28.112 mm, 28.108 mm, 28.106 mm, 28.104 mm, 28.103 mm, and 28.102 mm respectively.
Report
Share
Report
Share

Recommended
Recommended
Model Call Girl Services in Delhi reach out to us at 🔝 9953056974 🔝✔️✔️
Our agency presents a selection of young, charming call girls available for bookings at Oyo Hotels. Experience high-class escort services at pocket-friendly rates, with our female escorts exuding both beauty and a delightful personality, ready to meet your desires. Whether it's Housewives, College girls, Russian girls, Muslim girls, or any other preference, we offer a diverse range of options to cater to your tastes.
We provide both in-call and out-call services for your convenience. Our in-call location in Delhi ensures cleanliness, hygiene, and 100% safety, while our out-call services offer doorstep delivery for added ease.
We value your time and money, hence we kindly request pic collectors, time-passers, and bargain hunters to refrain from contacting us.
Our services feature various packages at competitive rates:
One shot: ₹2000/in-call, ₹5000/out-call
Two shots with one girl: ₹3500/in-call, ₹6000/out-call
Body to body massage with sex: ₹3000/in-call
Full night for one person: ₹7000/in-call, ₹10000/out-call
Full night for more than 1 person: Contact us at 🔝 9953056974 🔝. for details
Operating 24/7, we serve various locations in Delhi, including Green Park, Lajpat Nagar, Saket, and Hauz Khas near metro stations.
For premium call girl services in Delhi 🔝 9953056974 🔝. Thank you for considering us!CHEAP Call Girls in Saket (-DELHI )🔝 9953056974🔝(=)/CALL GIRLS SERVICE
CHEAP Call Girls in Saket (-DELHI )🔝 9953056974🔝(=)/CALL GIRLS SERVICE9953056974 Low Rate Call Girls In Saket, Delhi NCR
Ashok Vihar Call Girls in Delhi (–9953330565) Escort Service In Delhi NCR PROVIDE 100% REAL GIRLS ALL ARE GIRLS LOOKING MODELS AND RAM MODELS ALL GIRLS” INDIAN , RUSSIAN ,KASMARI ,PUNJABI HOT GIRLS AND MATURED HOUSE WIFE BOOKING ONLY DECENT GUYS AND GENTLEMAN NO FAKE PERSON FREE HOME SERVICE IN CALL FULL AC ROOM SERVICE IN SOUTH DELHI Ultimate Destination for finding a High Profile Independent Escorts in Delhi.Gurgaon.Noida..!.Like You Feel 100% Real Girl Friend Experience. We are High Class Delhi Escort Agency offering quality services with discretion. We only offer services to gentlemen people. We have lots of girls working with us like students, Russian, models, house wife, and much More We Provide Short Time and Full Night Service Call ☎☎+91–9953330565 ❤꧂ • In Call and Out Call Service in Delhi NCR • 3* 5* 7* Hotels Service in Delhi NCR • 24 Hours Available in Delhi NCR • Indian, Russian, Punjabi, Kashmiri Escorts • Real Models, College Girls, House Wife, Also Available • Short Time and Full Time Service Available • Hygienic Full AC Neat and Clean Rooms Avail. In Hotel 24 hours • Daily New Escorts Staff Available • Minimum to Maximum Range Available. Location;- Delhi, Gurgaon, NCR, Noida, and All Over in Delhi Hotel and Home Services HOTEL SERVICE AVAILABLE :-REDDISSON BLU,ITC WELCOM DWARKA,HOTEL-JW MERRIOTT,HOLIDAY INN MAHIPALPUR AIROCTY,CROWNE PLAZA OKHALA,EROSH NEHRU PLACE,SURYAA KALKAJI,CROWEN PLAZA ROHINI,SHERATON PAHARGANJ,THE AMBIENC,VIVANTA,SURAJKUND,ASHOKA CONTINENTAL , LEELA CHANKYAPURI,_ALL 3* 5* 7* STARTS HOTEL SERVICE BOOKING CALL Call WHATSAPP Call ☎+91–9953330565❤꧂ NIGHT SHORT TIME BOTH ARE AVAILABLE
Call Girls In Shalimar Bagh ( Delhi) 9953330565 Escorts Service
Call Girls In Shalimar Bagh ( Delhi) 9953330565 Escorts Service9953056974 Low Rate Call Girls In Saket, Delhi NCR
Saudi Arabia [ Abortion pills) Jeddah/riaydh/dammam/+966572737505☎️] cytotec tablets uses abortion pills 💊💊
How effective is the abortion pill? 💊💊 +966572737505) "Abortion pills in Jeddah" how to get cytotec tablets in Riyadh " Abortion pills in dammam*💊💊
The abortion pill is very effective. If you’re taking mifepristone and misoprostol, it depends on how far along the pregnancy is, and how many doses of medicine you take:💊💊 +966572737505) how to buy cytotec pills
At 8 weeks pregnant or less, it works about 94-98% of the time. +966572737505[ 💊💊💊
At 8-9 weeks pregnant, it works about 94-96% of the time. +966572737505)
At 9-10 weeks pregnant, it works about 91-93% of the time. +966572737505)💊💊
If you take an extra dose of misoprostol, it works about 99% of the time.
At 10-11 weeks pregnant, it works about 87% of the time. +966572737505)
If you take an extra dose of misoprostol, it works about 98% of the time.
In general, taking both mifepristone and+966572737505 misoprostol works a bit better than taking misoprostol only.
+966572737505
Taking misoprostol alone works to end the+966572737505 pregnancy about 85-95% of the time — depending on how far along the+966572737505 pregnancy is and how you take the medicine.
+966572737505
The abortion pill usually works, but if it doesn’t, you can take more medicine or have an in-clinic abortion.
+966572737505
When can I take the abortion pill?+966572737505
In general, you can have a medication abortion up to 77 days (11 weeks)+966572737505 after the first day of your last period. If it’s been 78 days or more since the first day of your last+966572737505 period, you can have an in-clinic abortion to end your pregnancy.+966572737505
Why do people choose the abortion pill?
Which kind of abortion you choose all depends on your personal+966572737505 preference and situation. With+966572737505 medication+966572737505 abortion, some people like that you don’t need to have a procedure in a doctor’s office. You can have your medication abortion on your own+966572737505 schedule, at home or in another comfortable place that you choose.+966572737505 You get to decide who you want to be with during your abortion, or you can go it alone. Because+966572737505 medication abortion is similar to a miscarriage, many people feel like it’s more “natural” and less invasive. And some+966572737505 people may not have an in-clinic abortion provider close by, so abortion pills are more available to+966572737505 them.
+966572737505
Your doctor, nurse, or health center staff can help you decide which kind of abortion is best for you.
+966572737505
More questions from patients:
Saudi Arabia+966572737505
CYTOTEC Misoprostol Tablets. Misoprostol is a medication that can prevent stomach ulcers if you also take NSAID medications. It reduces the amount of acid in your stomach, which protects your stomach lining. The brand name of this medication is Cytotec®.+966573737505)
Unwanted Kit is a combination of two mediciAbortion pills in Doha Qatar (+966572737505 ! Get Cytotec
Abortion pills in Doha Qatar (+966572737505 ! Get CytotecAbortion pills in Riyadh +966572737505 get cytotec
More Related Content
Recently uploaded
Model Call Girl Services in Delhi reach out to us at 🔝 9953056974 🔝✔️✔️
Our agency presents a selection of young, charming call girls available for bookings at Oyo Hotels. Experience high-class escort services at pocket-friendly rates, with our female escorts exuding both beauty and a delightful personality, ready to meet your desires. Whether it's Housewives, College girls, Russian girls, Muslim girls, or any other preference, we offer a diverse range of options to cater to your tastes.
We provide both in-call and out-call services for your convenience. Our in-call location in Delhi ensures cleanliness, hygiene, and 100% safety, while our out-call services offer doorstep delivery for added ease.
We value your time and money, hence we kindly request pic collectors, time-passers, and bargain hunters to refrain from contacting us.
Our services feature various packages at competitive rates:
One shot: ₹2000/in-call, ₹5000/out-call
Two shots with one girl: ₹3500/in-call, ₹6000/out-call
Body to body massage with sex: ₹3000/in-call
Full night for one person: ₹7000/in-call, ₹10000/out-call
Full night for more than 1 person: Contact us at 🔝 9953056974 🔝. for details
Operating 24/7, we serve various locations in Delhi, including Green Park, Lajpat Nagar, Saket, and Hauz Khas near metro stations.
For premium call girl services in Delhi 🔝 9953056974 🔝. Thank you for considering us!CHEAP Call Girls in Saket (-DELHI )🔝 9953056974🔝(=)/CALL GIRLS SERVICE
CHEAP Call Girls in Saket (-DELHI )🔝 9953056974🔝(=)/CALL GIRLS SERVICE9953056974 Low Rate Call Girls In Saket, Delhi NCR
Ashok Vihar Call Girls in Delhi (–9953330565) Escort Service In Delhi NCR PROVIDE 100% REAL GIRLS ALL ARE GIRLS LOOKING MODELS AND RAM MODELS ALL GIRLS” INDIAN , RUSSIAN ,KASMARI ,PUNJABI HOT GIRLS AND MATURED HOUSE WIFE BOOKING ONLY DECENT GUYS AND GENTLEMAN NO FAKE PERSON FREE HOME SERVICE IN CALL FULL AC ROOM SERVICE IN SOUTH DELHI Ultimate Destination for finding a High Profile Independent Escorts in Delhi.Gurgaon.Noida..!.Like You Feel 100% Real Girl Friend Experience. We are High Class Delhi Escort Agency offering quality services with discretion. We only offer services to gentlemen people. We have lots of girls working with us like students, Russian, models, house wife, and much More We Provide Short Time and Full Night Service Call ☎☎+91–9953330565 ❤꧂ • In Call and Out Call Service in Delhi NCR • 3* 5* 7* Hotels Service in Delhi NCR • 24 Hours Available in Delhi NCR • Indian, Russian, Punjabi, Kashmiri Escorts • Real Models, College Girls, House Wife, Also Available • Short Time and Full Time Service Available • Hygienic Full AC Neat and Clean Rooms Avail. In Hotel 24 hours • Daily New Escorts Staff Available • Minimum to Maximum Range Available. Location;- Delhi, Gurgaon, NCR, Noida, and All Over in Delhi Hotel and Home Services HOTEL SERVICE AVAILABLE :-REDDISSON BLU,ITC WELCOM DWARKA,HOTEL-JW MERRIOTT,HOLIDAY INN MAHIPALPUR AIROCTY,CROWNE PLAZA OKHALA,EROSH NEHRU PLACE,SURYAA KALKAJI,CROWEN PLAZA ROHINI,SHERATON PAHARGANJ,THE AMBIENC,VIVANTA,SURAJKUND,ASHOKA CONTINENTAL , LEELA CHANKYAPURI,_ALL 3* 5* 7* STARTS HOTEL SERVICE BOOKING CALL Call WHATSAPP Call ☎+91–9953330565❤꧂ NIGHT SHORT TIME BOTH ARE AVAILABLE
Call Girls In Shalimar Bagh ( Delhi) 9953330565 Escorts Service
Call Girls In Shalimar Bagh ( Delhi) 9953330565 Escorts Service9953056974 Low Rate Call Girls In Saket, Delhi NCR
Saudi Arabia [ Abortion pills) Jeddah/riaydh/dammam/+966572737505☎️] cytotec tablets uses abortion pills 💊💊
How effective is the abortion pill? 💊💊 +966572737505) "Abortion pills in Jeddah" how to get cytotec tablets in Riyadh " Abortion pills in dammam*💊💊
The abortion pill is very effective. If you’re taking mifepristone and misoprostol, it depends on how far along the pregnancy is, and how many doses of medicine you take:💊💊 +966572737505) how to buy cytotec pills
At 8 weeks pregnant or less, it works about 94-98% of the time. +966572737505[ 💊💊💊
At 8-9 weeks pregnant, it works about 94-96% of the time. +966572737505)
At 9-10 weeks pregnant, it works about 91-93% of the time. +966572737505)💊💊
If you take an extra dose of misoprostol, it works about 99% of the time.
At 10-11 weeks pregnant, it works about 87% of the time. +966572737505)
If you take an extra dose of misoprostol, it works about 98% of the time.
In general, taking both mifepristone and+966572737505 misoprostol works a bit better than taking misoprostol only.
+966572737505
Taking misoprostol alone works to end the+966572737505 pregnancy about 85-95% of the time — depending on how far along the+966572737505 pregnancy is and how you take the medicine.
+966572737505
The abortion pill usually works, but if it doesn’t, you can take more medicine or have an in-clinic abortion.
+966572737505
When can I take the abortion pill?+966572737505
In general, you can have a medication abortion up to 77 days (11 weeks)+966572737505 after the first day of your last period. If it’s been 78 days or more since the first day of your last+966572737505 period, you can have an in-clinic abortion to end your pregnancy.+966572737505
Why do people choose the abortion pill?
Which kind of abortion you choose all depends on your personal+966572737505 preference and situation. With+966572737505 medication+966572737505 abortion, some people like that you don’t need to have a procedure in a doctor’s office. You can have your medication abortion on your own+966572737505 schedule, at home or in another comfortable place that you choose.+966572737505 You get to decide who you want to be with during your abortion, or you can go it alone. Because+966572737505 medication abortion is similar to a miscarriage, many people feel like it’s more “natural” and less invasive. And some+966572737505 people may not have an in-clinic abortion provider close by, so abortion pills are more available to+966572737505 them.
+966572737505
Your doctor, nurse, or health center staff can help you decide which kind of abortion is best for you.
+966572737505
More questions from patients:
Saudi Arabia+966572737505
CYTOTEC Misoprostol Tablets. Misoprostol is a medication that can prevent stomach ulcers if you also take NSAID medications. It reduces the amount of acid in your stomach, which protects your stomach lining. The brand name of this medication is Cytotec®.+966573737505)
Unwanted Kit is a combination of two mediciAbortion pills in Doha Qatar (+966572737505 ! Get Cytotec
Abortion pills in Doha Qatar (+966572737505 ! Get CytotecAbortion pills in Riyadh +966572737505 get cytotec
Recently uploaded (20)
Chintamani Call Girls: 🍓 7737669865 🍓 High Profile Model Escorts | Bangalore ...
Chintamani Call Girls: 🍓 7737669865 🍓 High Profile Model Escorts | Bangalore ...
BDSM⚡Call Girls in Mandawali Delhi >༒8448380779 Escort Service
BDSM⚡Call Girls in Mandawali Delhi >༒8448380779 Escort Service
Cheap Rate Call girls Sarita Vihar Delhi 9205541914 shot 1500 night
Cheap Rate Call girls Sarita Vihar Delhi 9205541914 shot 1500 night
CHEAP Call Girls in Saket (-DELHI )🔝 9953056974🔝(=)/CALL GIRLS SERVICE
CHEAP Call Girls in Saket (-DELHI )🔝 9953056974🔝(=)/CALL GIRLS SERVICE
Call Girls In Nandini Layout ☎ 7737669865 🥵 Book Your One night Stand
Call Girls In Nandini Layout ☎ 7737669865 🥵 Book Your One night Stand
Call Girls In Bellandur ☎ 7737669865 🥵 Book Your One night Stand
Call Girls In Bellandur ☎ 7737669865 🥵 Book Your One night Stand
Jual Obat Aborsi Surabaya ( Asli No.1 ) 085657271886 Obat Penggugur Kandungan...
Jual Obat Aborsi Surabaya ( Asli No.1 ) 085657271886 Obat Penggugur Kandungan...
Call Girls in Sarai Kale Khan Delhi 💯 Call Us 🔝9205541914 🔝( Delhi) Escorts S...
Call Girls in Sarai Kale Khan Delhi 💯 Call Us 🔝9205541914 🔝( Delhi) Escorts S...
5CL-ADBA,5cladba, Chinese supplier, safety is guaranteed
5CL-ADBA,5cladba, Chinese supplier, safety is guaranteed
Call Girls In Shalimar Bagh ( Delhi) 9953330565 Escorts Service
Call Girls In Shalimar Bagh ( Delhi) 9953330565 Escorts Service
Mg Road Call Girls Service: 🍓 7737669865 🍓 High Profile Model Escorts | Banga...
Mg Road Call Girls Service: 🍓 7737669865 🍓 High Profile Model Escorts | Banga...
➥🔝 7737669865 🔝▻ mahisagar Call-girls in Women Seeking Men 🔝mahisagar🔝 Esc...
➥🔝 7737669865 🔝▻ mahisagar Call-girls in Women Seeking Men 🔝mahisagar🔝 Esc...
Escorts Service Kumaraswamy Layout ☎ 7737669865☎ Book Your One night Stand (B...
Escorts Service Kumaraswamy Layout ☎ 7737669865☎ Book Your One night Stand (B...
Digital Advertising Lecture for Advanced Digital & Social Media Strategy at U...
Digital Advertising Lecture for Advanced Digital & Social Media Strategy at U...
➥🔝 7737669865 🔝▻ Mathura Call-girls in Women Seeking Men 🔝Mathura🔝 Escorts...
➥🔝 7737669865 🔝▻ Mathura Call-girls in Women Seeking Men 🔝Mathura🔝 Escorts...
Abortion pills in Doha Qatar (+966572737505 ! Get Cytotec
Abortion pills in Doha Qatar (+966572737505 ! Get Cytotec
VIP Model Call Girls Hinjewadi ( Pune ) Call ON 8005736733 Starting From 5K t...
VIP Model Call Girls Hinjewadi ( Pune ) Call ON 8005736733 Starting From 5K t...
Vip Mumbai Call Girls Thane West Call On 9920725232 With Body to body massage...
Vip Mumbai Call Girls Thane West Call On 9920725232 With Body to body massage...
Featured
Featured (20)
Product Design Trends in 2024 | Teenage Engineerings
Product Design Trends in 2024 | Teenage Engineerings
How Race, Age and Gender Shape Attitudes Towards Mental Health
How Race, Age and Gender Shape Attitudes Towards Mental Health
AI Trends in Creative Operations 2024 by Artwork Flow.pdf
AI Trends in Creative Operations 2024 by Artwork Flow.pdf
Content Methodology: A Best Practices Report (Webinar)
Content Methodology: A Best Practices Report (Webinar)
How to Prepare For a Successful Job Search for 2024
How to Prepare For a Successful Job Search for 2024
Social Media Marketing Trends 2024 // The Global Indie Insights
Social Media Marketing Trends 2024 // The Global Indie Insights
Trends In Paid Search: Navigating The Digital Landscape In 2024
Trends In Paid Search: Navigating The Digital Landscape In 2024
5 Public speaking tips from TED - Visualized summary
5 Public speaking tips from TED - Visualized summary
Google's Just Not That Into You: Understanding Core Updates & Search Intent
Google's Just Not That Into You: Understanding Core Updates & Search Intent
The six step guide to practical project management
The six step guide to practical project management
Beginners Guide to TikTok for Search - Rachel Pearson - We are Tilt __ Bright...
Beginners Guide to TikTok for Search - Rachel Pearson - We are Tilt __ Bright...
Unlocking the Power of ChatGPT and AI in Testing - A Real-World Look, present...
Unlocking the Power of ChatGPT and AI in Testing - A Real-World Look, present...
0001
- 1. 𝑌 = −0.0059𝑙𝑛( 𝑋) + 28.144 CALCULO DE LA PRECIPITACIÓN EN LA CURVA DE NIVEL CON COTA 200 Y = -0.0059 ln (x) + 28.144 Y = -0.0059 ln (200) + 28.144 Y = 28.112 𝑃𝑃 𝑚200= 28.112 mm CALCULO DE LA PRECIPITACIÓN EN LA CURVA DE NIVEL CON COTA 400 Y = -0.0059 ln (x) + 28.144 Y = -0.0059 ln (400) + 28.144 Y = 28.108 𝑃𝑃 𝑚400= 28.108 mm CALCULO DE LA PRECIPITACION EN LA CURVA DE NIVEL CON COTA 600 𝑌 = −0.0059𝑙𝑛( 𝑋) + 28.144 Y = -0.0059 ln (400) + 28.144 𝑌 = 28.106 𝑃𝑃𝑚600 = 28.106 𝑚𝑚 CALCULO DE LA PRECIPITACION EN LA CURVA DE NIVEL CON COTA 800 𝑌 = −0.0059𝑙𝑛( 𝑋) + 28.144 𝑌 = −0.0059𝑙𝑛(800) + 28.144 𝑌 = 28.104 𝑃𝑃𝑚800 = 28.104 𝑚𝑚 CALCULO DE LA PRECIPITACION EN LA CURVA DE NIVEL CON COTA 1000 𝑌 = −0.0059𝑙𝑛( 𝑋) + 28.144 𝑌 = −0.0059𝑙𝑛(1000) + 28.144 𝑌 = 28.103
- 2. 𝑃𝑃𝑚1000 = 28.103 𝑚𝑚 CALCULO DE LA PRECIPITACION EN LA CURVA DE NIVEL CON COTA 1200 𝑌 = −0.0059𝑙𝑛( 𝑋) + 28.144 𝑌 = −0.0059 ln(1200) + 28.144 𝑌 = 28.102 𝑃𝑃𝑚1200 = 28.102 𝑚𝑚