SlideShare a Scribd company logo
1 of 10
Introduction
The Pearson product-moment correlation coefficient (Pearson’s correlation, for short) is a measure of the
strength and direction of association that exists between two variables measured on at least an interval
scale.
For example, you could use a Pearson’s correlation to understand whether there is an association between
exam performance and time spent revising. You could also use a Pearson's correlation to understand
whether there is an association between depression and length of unemployment.
A Pearson’s correlation attempts to draw a line of best fit through the data of two variables, and the Pearson
correlation coefficient, r, indicates how far away all these data points are from this line of best fit (i.e., how
well the data points fit this model/line of best fit). You can learn more here, which we recommend if you are
not familiar with this test.
Example
A researcher wants to know whether a person's height is related to how well they perform in a long
jump. The researcher recruited untrained individuals from the general population, measured their
height and had them performa long jump. The researcher then investigated whether there was an
association between height and long jump performance by running a Pearson's correlation.
The results are presented in a matrix such that, as can be seen above, the correlations are replicated.
Nevertheless, the table presents the Pearson correlation coefficient, its significance value and the sample
size that the calculation is based on.
In this example, we can see that the Pearson correlation coefficient, r, is 0.706, and that it is statistically
significant (p = 0.005). For interpreting multiple correlations, see our enhanced Pearson’s guid
Reporting the Output
In our example above, you might report the results as follows:
A Pearson product-moment correlation was run to determine the relationship between height and distance jumped in a
long jump. There was a strong, positive correlation between heightand distance jumped, which was statistically
significant (r = .7 06, n = 14, p = .005).
Introduction
Partial correlation is a measure of the strength and direction of a linear relationship
between two continuous variables whilst controlling for the effect of one or more other
continuous variables (also known as 'covariates' or 'control' variables). Although partial
correlation does not make the distinction between independent and dependent variables,
the two variables are often considered in such a manner (i.e., you have one continuous
dependent variable and one continuous independent variable, as well as one or more
continuous control variables).
Example & Data Setup in SPSS Statistics
A researcher wants to know whether there is a statistically significant linear relationship
between VO2max (a marker of aerobic fitness) and a person's weight. Furthermore, the
researcher wants to know whether this relationship remains after accounting for a
person's age (i.e., if the relationship is influenced by a person's age). Therefore, the
researcher uses partial correlation to determine whether there is a linear relationship
between VO2max and weight, whilst controlling for age (i.e., the continuous dependent
variable is "VO2max", measured in ml/min/kg, the continuous independent variable is
"weight", measured in kg, and the control variable – that is, the additional continuous
independent variable the researcher is adjusting for – is "age", measured in years).
You will be presented with the Descriptive Statistics and Correlations tables in
the IBM SPSS Statistics Viewer window. We suggest starting with the Descriptive
Statistics table to get a 'feel' for your data, as shown below:
Published with written permission from SPSS Statistics,IBM Corporation.
The descriptive statistics show that we had no missing data since the recorded sample
size, N = 100, is the same as the number of participants that took part in the study. We
can also see that the mean value of the dependent variable, VO2max, was 43.63
ml/min/kg (with a standard deviation of 8.57 ml/min/kg), whilst the mean weight of
participants was 79.7 kg (with a standard deviation of 15.1 kg), and finally, the mean age
of participants was 31.1 years (with a standard deviation of 9.1 years). This suggests
that the sample of participants was slightly on the younger side rather than representing
the population as a whole, which is useful to know when discussing the generalizability
of the findings in your report.
Next, we suggest looking at the Correlations table, as shown below:
Published with written permission from SPSS Statistics,IBM Corporation.
The Correlations table is split into two main parts: (a) the Pearson product-moment
correlation coefficients for all your variables – that is, your dependent variable,
independent variable, and one or more control variables – as highlighted by
the blue rectangle; and (b) the results from the partial correlation where the Pearson
product-moment correlation coefficient between the dependent and independent variable
has been adjusted to take into account the control variable(s), as highlighted by
the red rectangle.
The results of the partial correlation highlighted by the red rectangle show that there was
a moderate, negative partial correlation between the dependent variable, "VO2max", and
independent variable, "weight", whilst controlling for "age", which was statistically
significant (r(97) = -.314, n = 100, p = .002). However, when we refer to the Pearson's
product-moment correlation – also known as the zero-order correlation – between
"VO2max" and "weight", without controlling for "age", as highlighted by
the blue rectangle, we can see that there was also a statistically significant, moderate,
negative correlation between "VO2max" and "weight" (r(98) = -.307, n = 100, p = .002).
This suggests that "age" had very little influence in controlling for the relationship
between "VO2max" and "weight"
Introduction
The Spearman rank-order correlation coefficient (Spearman’s correlation, for short) is a
nonparametric measure of the strength and direction of association that exists between
two variables measured on at least an ordinal scale. It is denoted by the symbol rs (or the
Greek letter ρ, pronounced rho). The test is used for either ordinal variables or for
continuous data that has failed the assumptions necessary for conducting the Pearson's
product-moment correlation. For example, you could use a Spearman’s correlation to
understand whether there is an association between exam performance and time spent
revising; whether there is an association between depression and length of
unemployment; and so forth.
Example
A teacher is interested in whether those who do better at English also do better in maths.
To test whether this is the case, the teacher records the scores of her 10 students in
their end-of-year examinations for both English and maths. Therefore, one variable
records the English scores and the second variable records the maths scores for the 10
pupils.
The results are presented in a matrix such that, as can be seen above, the correlations
are replicated. Nevertheless, the table presents Spearman's correlation, its significance
value and the sample size that the calculation was based on. In this example, we can
see that Spearman's correlation coefficient, rs, is 0.669, and that this is statistically
significant (p = .035).
Reporting the Output
A Spearman's rank-order correlation was run to determine the relationship between 10 students'
English and maths exam marks. There was a strong, positive correlation between English and maths
marks, which was statistically significant (rs(8) = .669, p = .035).
Introduction
Kendall's tau-b (τb) correlation coefficient (Kendall's tau-b, for short) is a nonparametric
measure of the strength and direction of association that exists between two variables
measured on at least an ordinal scale. It is considered a nonparametric alternative to
the Pearson’s product-moment correlation when your data has failed one or more of the
assumptions of this test. It is also considered an alternative to the
nonparametric Spearman rank-order correlation coefficient (especially when you have a
small sample size with many tied ranks). If you consider one of your variables as an
independent variable and the other as a dependent variable, you might consider running
a Somers' dtest instead.
you could use Kendall's tau-b to understand whether there is an association between
customer satisfaction and delivery time (i.e., where delivery time had four categories –
next day, 2 working days, 3-5 working days, and more than 5 working days – and
customer satisfaction was measured in terms of the level of agreement customers had
with the following statement, "I am satisfied with the time it took for my parcel to be
delivered", where the level of agreement had five categories: strongly agree, agree,
neither agree nor disagree, disagree and strongly disagree).
Example & Data Setup in SPSS Statistics
Taxes have the ability to elicit strong responses in many people, with some thinking they
are too high, whilst others think they should be higher. A researcher conducted a simple
study where they presented participants with the statement: "Tax is too high in this
country", and asked them how much they agreed with this statement. They had four
options how to respond: "Strongly Disagree", "Disagree", "Agree" or "Strongly Agree".
These ordered responses were the categories of the dependent variable, tax_too_high .
The researcher also asked participants to state whether they had a "low", "middle" or
"high" income, where each of these categories had specified income ranges (e.g., a low
income was any income under £18,000 per annum). The income level of participants
was recorded in the variable, income .
A Kendall's tau-b correlation was run to determine the relationship between income level and views towards
income taxes amongst 24 participants. There was a strong, positive correlation between income level and the
view that taxes were too high, which was statistically significant (τb = .535, p = .003).
Introduction
Linear regression is the next step up after correlation. It is used when we want to predict
the value of a variable based on the value of another variable. The variable we want to
predict is called the dependent variable (or sometimes, the outcome variable). The
variable we are using to predict the other variable's value is called the independent
variable (or sometimes, the predictor variable). For example, you could use linear
regression to understand whether exam performance can be predicted based on revision
time; whether cigarette consumption can be predicted based on smoking duration; and
so forth. If you have two or more independent variables, rather than just one, you need
to use multiple regression.
Example
A salesperson for a large car brand wants to determine whether there is a relationship
between an individual's income and the price they pay for a car. As such, the individual's
"income" is the independent variable and the "price" they pay for a car is the dependent
variable. The salesperson wants to use this information to determine which cars to offer
potential customers in new areas where average income is known.
The first table of interest is the Model Summary table, as shown below:
Published with written permission from SPSS Statistics,IBM Corporation.
This table provides the R and R2
values. The R value represents the simple correlation
and is 0.873 (the "R" Column), which indicates a high degree of correlation. The R2
value
(the "R Square" column) indicates how much of the total variation in the dependent
variable, Price , can be explained by the independent variable, Income . In this case,
76.2% can be explained, which is very large.
The next table is the ANOVA table, which reports how well the regression equation fits
the data (i.e., predicts the dependent variable) and is shown below:
Published with written permission from SPSS Statistics,IBM Corporation.
This table indicates that the regression model predicts the dependent variable
significantly well. How do we know this? Look at the "Regression" row and go to the
"Sig." column. This indicates the statistical significance of the regression model that was
run. Here, p < 0.0005, which is less than 0.05, and indicates that, overall, the regression
model statistically significantly predicts the outcome variable (i.e., it is a good fit for the
data).
The Coefficients table provides us with the necessary information to predict price from
income, as well as determine whether income contributes statistically significantly to the
model (by looking at the "Sig." column). Furthermore, we can use the values in the "B"
column under the "Unstandardized Coefficients"column, as shown below:
Published with written permission from SPSS Statistics,IBM Corporation.
to present the regression equation as:
Price = 8287 + 0.564(Income)
Introduction
Multiple regression is an extension of simple linear regression. It is used when we want
to predict the value of a variable based on the value of two or more other variables. The
variable we want to predict is called the dependent variable (or sometimes, the outcome,
target or criterion variable). The variables we are using to predict the value of the
dependent variable are called the independent variables (or sometimes, the predictor,
explanatory or regressor variables).
For example, you could use multiple regression to understand whether exam
performance can be predicted based on revision time, test anxiety, lecture attendance
and gender. Alternately, you could use multiple regression to understand whether daily
cigarette consumption can be predicted based on smoking duration, age when started
smoking, smoker type, income and gender.
Example
A health researcher wants to be able to predict "VO2max", an indicator of fitness and
health. Normally, to perform this procedure requires expensive laboratory equipment and
necessitates that an individual exercise to their maximum (i.e., until they can longer
continue exercising due to physical exhaustion). This can put off those individuals who
are not very active/fit and those individuals who might be at higher risk of ill health (e.g.,
older unfit subjects). For these reasons, it has been desirable to find a way of predicting
an individual's VO2max based on attributes that can be measured more easily and
cheaply. To this end, a researcher recruited 100 participants to perform a maximum
VO2max test, but also recorded their "age", "weight", "heart rate" and "gender". Heart
rate is the average of the last 5 minutes of a 20 minute, much easier, lower workload
cycling test. The researcher's goal is to be able to predict VO2max based on these four
attributes: age, weight, heart rate and gender.
Determining how well the model fits
The first table of interest is the Model Summary table. This table provides the R, R2
,
adjusted R2
, and the standard error of the estimate, which can be used to determine how
well a regression model fits the data:
Published with written permission from SPSS Statistics,IBM Corporation.
The "R" column represents the value of R, the multiple correlation coefficient. R can
be considered to be one measure of the quality of the prediction of the dependent
variable; in this case, VO2max. A value of 0.760, in this example, indicates a good level of
prediction. The "R Square" column represents the R2
value (also called the coefficient of
determination), which is the proportion of variance in the dependent variable that can be
explained by the independent variables (technically, it is the proportion of variation
accounted for by the regression model above and beyond the mean model). You can
see from our value of 0.577 that our independent variables explain 57.7% of the
variability of our dependent variable, VO2max. However, you also need to be able to
interpret "Adjusted R Square" (adj. R2
) to accurately report your data. We explain the
reasons for this, as well as the output, in our enhanced multiple regression guide.
Statistical significance
The F-ratio in the ANOVA table (see below) tests whether the overall regression model
is a good fit for the data. The table shows that the independent variables statistically
significantly predict the dependent variable, F(4, 95) = 32.393, p < .0005 (i.e., the
regression model is a good fit of the data).
Estimated model coefficients
The general form of the equation to predict VO2max from age , weight , heart_rate , gender ,
is:predicted VO2max = 87.83 – (0.165 x age ) – (0.385 x weight ) – (0.118 x heart_rate ) +
(13.208 x gender )
This is obtained from the Coefficients table, as shown below:
.Unstandardized coefficients indicate how much the dependent variable varies with an
independent variable when all other independent variables are held constant. Consider
the effect of age in this example. The unstandardized coefficient, B1, for age is equal to
-0.165 (see Coefficients table). This means that for each one year increase in age,
there is a decrease in VO2max of 0.165 ml/min/kg.
Statistical significance of the independent variables
You can test for the statistical significance of each of the independent variables. This
tests whether the unstandardized (or standardized) coefficients are equal to 0 (zero) in
the population. If p < .05, you can conclude that the coefficients are statistically
significantly different to 0 (zero). The t-value and corresponding p-value are located in
the "t" and "Sig." columns, respectively, as highlighted below:
Published with written permission from SPSS Statistics,IBM Corporation.
You can see from the "Sig." column that all independent variable coefficients are
statistically significantly different from 0 (zero). Although the intercept, B0, is tested for
statistical significance, this is rarely an important or interesting finding.
Putting it all together
You could write up the results as follows:
 General
A multiple regression was run to predict VO2 max from gender, age, weight and heart rate. These
variables statistically significantly predicted VO2 max, F(4, 95) = 32.393, p < .0005, R2 = .577. All
four variables added statistically significantly to the prediction, p < .05.

More Related Content

What's hot

Applications of statistics in daily life
Applications of statistics in daily lifeApplications of statistics in daily life
Applications of statistics in daily lifeminah habib
 
Business statistics (Basics)
Business statistics (Basics)Business statistics (Basics)
Business statistics (Basics)AhmedToheed3
 
Oral defense presentation
Oral defense presentationOral defense presentation
Oral defense presentationRONALDO QUITCO
 
Statistics 1
Statistics 1Statistics 1
Statistics 1Saed Jama
 
Pearson Correlation, Spearman Correlation &Linear Regression
Pearson Correlation, Spearman Correlation &Linear RegressionPearson Correlation, Spearman Correlation &Linear Regression
Pearson Correlation, Spearman Correlation &Linear RegressionAzmi Mohd Tamil
 
The chi square test of indep of categorical variables
The chi square test of indep of categorical variablesThe chi square test of indep of categorical variables
The chi square test of indep of categorical variablesRegent University
 
Statistical Treatment
Statistical TreatmentStatistical Treatment
Statistical TreatmentDaryl Tabogoc
 
Research paper (pre ed 2)
Research paper (pre ed 2)Research paper (pre ed 2)
Research paper (pre ed 2)Ysa Garcera
 
FACTORS AFFECTING PERFORMANCE IN SCIENCE OF FOURTH YEAR STUDENTS IN THE NATIO...
FACTORS AFFECTING PERFORMANCE IN SCIENCE OF FOURTH YEAR STUDENTS IN THE NATIO...FACTORS AFFECTING PERFORMANCE IN SCIENCE OF FOURTH YEAR STUDENTS IN THE NATIO...
FACTORS AFFECTING PERFORMANCE IN SCIENCE OF FOURTH YEAR STUDENTS IN THE NATIO...ASU-CHARRM
 
Data Analysis with SPSS : One-way ANOVA
Data Analysis with SPSS : One-way ANOVAData Analysis with SPSS : One-way ANOVA
Data Analysis with SPSS : One-way ANOVADr Ali Yusob Md Zain
 
Role of Statistics in Scientific Research
Role of Statistics in Scientific ResearchRole of Statistics in Scientific Research
Role of Statistics in Scientific ResearchVaruna Harshana
 
2 way ANOVA(Analysis Of VAriance
2 way ANOVA(Analysis Of VAriance2 way ANOVA(Analysis Of VAriance
2 way ANOVA(Analysis Of VAriancemusadoto
 
Data and data collection procedures pdf
Data and data collection procedures pdfData and data collection procedures pdf
Data and data collection procedures pdfHumbertovsky
 

What's hot (20)

Applications of statistics in daily life
Applications of statistics in daily lifeApplications of statistics in daily life
Applications of statistics in daily life
 
Business statistics (Basics)
Business statistics (Basics)Business statistics (Basics)
Business statistics (Basics)
 
Oral defense presentation
Oral defense presentationOral defense presentation
Oral defense presentation
 
Statistics 1
Statistics 1Statistics 1
Statistics 1
 
Samplels & Sampling Techniques
Samplels & Sampling TechniquesSamplels & Sampling Techniques
Samplels & Sampling Techniques
 
Pearson Correlation, Spearman Correlation &Linear Regression
Pearson Correlation, Spearman Correlation &Linear RegressionPearson Correlation, Spearman Correlation &Linear Regression
Pearson Correlation, Spearman Correlation &Linear Regression
 
Two-Way ANOVA
Two-Way ANOVATwo-Way ANOVA
Two-Way ANOVA
 
Final thesis-jen
Final thesis-jenFinal thesis-jen
Final thesis-jen
 
Wilcoxon example2008
Wilcoxon example2008Wilcoxon example2008
Wilcoxon example2008
 
Correlation analysis
Correlation analysisCorrelation analysis
Correlation analysis
 
swot analynsis.docx
swot analynsis.docxswot analynsis.docx
swot analynsis.docx
 
The chi square test of indep of categorical variables
The chi square test of indep of categorical variablesThe chi square test of indep of categorical variables
The chi square test of indep of categorical variables
 
Statistical Treatment
Statistical TreatmentStatistical Treatment
Statistical Treatment
 
Research paper (pre ed 2)
Research paper (pre ed 2)Research paper (pre ed 2)
Research paper (pre ed 2)
 
FACTORS AFFECTING PERFORMANCE IN SCIENCE OF FOURTH YEAR STUDENTS IN THE NATIO...
FACTORS AFFECTING PERFORMANCE IN SCIENCE OF FOURTH YEAR STUDENTS IN THE NATIO...FACTORS AFFECTING PERFORMANCE IN SCIENCE OF FOURTH YEAR STUDENTS IN THE NATIO...
FACTORS AFFECTING PERFORMANCE IN SCIENCE OF FOURTH YEAR STUDENTS IN THE NATIO...
 
Data Analysis with SPSS : One-way ANOVA
Data Analysis with SPSS : One-way ANOVAData Analysis with SPSS : One-way ANOVA
Data Analysis with SPSS : One-way ANOVA
 
Role of Statistics in Scientific Research
Role of Statistics in Scientific ResearchRole of Statistics in Scientific Research
Role of Statistics in Scientific Research
 
2 way ANOVA(Analysis Of VAriance
2 way ANOVA(Analysis Of VAriance2 way ANOVA(Analysis Of VAriance
2 way ANOVA(Analysis Of VAriance
 
Z-Test with Examples
Z-Test with ExamplesZ-Test with Examples
Z-Test with Examples
 
Data and data collection procedures pdf
Data and data collection procedures pdfData and data collection procedures pdf
Data and data collection procedures pdf
 

Similar to MKRH - Correlation and regression

EXERCISE 23 PEARSONS PRODUCT-MOMENT CORRELATION COEFFICIENT .docx
EXERCISE 23 PEARSONS PRODUCT-MOMENT CORRELATION COEFFICIENT .docxEXERCISE 23 PEARSONS PRODUCT-MOMENT CORRELATION COEFFICIENT .docx
EXERCISE 23 PEARSONS PRODUCT-MOMENT CORRELATION COEFFICIENT .docxgitagrimston
 
Correlation and Regression.pdf
Correlation and Regression.pdfCorrelation and Regression.pdf
Correlation and Regression.pdfAadarshSah1
 
Data analysis test for association BY Prof Sachin Udepurkar
Data analysis   test for association BY Prof Sachin UdepurkarData analysis   test for association BY Prof Sachin Udepurkar
Data analysis test for association BY Prof Sachin Udepurkarsachinudepurkar
 
A Correlation Between Emotion-Focused Coping With Test...
A Correlation Between Emotion-Focused Coping With Test...A Correlation Between Emotion-Focused Coping With Test...
A Correlation Between Emotion-Focused Coping With Test...Stephanie King
 
Aantekeningen uit referenties van Biostatistics.docx
Aantekeningen uit referenties van Biostatistics.docxAantekeningen uit referenties van Biostatistics.docx
Aantekeningen uit referenties van Biostatistics.docxdugkosasan
 
Statistics- chapter4.pdf
Statistics- chapter4.pdfStatistics- chapter4.pdf
Statistics- chapter4.pdfPaulosMekuria
 
BUS 308 – Week 4 Lecture 2 Interpreting Relationships .docx
BUS 308 – Week 4 Lecture 2 Interpreting Relationships .docxBUS 308 – Week 4 Lecture 2 Interpreting Relationships .docx
BUS 308 – Week 4 Lecture 2 Interpreting Relationships .docxcurwenmichaela
 
BUS 308 – Week 4 Lecture 2 Interpreting Relationships .docx
BUS 308 – Week 4 Lecture 2 Interpreting Relationships .docxBUS 308 – Week 4 Lecture 2 Interpreting Relationships .docx
BUS 308 – Week 4 Lecture 2 Interpreting Relationships .docxjasoninnes20
 
Simple regressionand correlation (2).pdf
Simple regressionand correlation (2).pdfSimple regressionand correlation (2).pdf
Simple regressionand correlation (2).pdfyadavrahulrahul799
 
Assessment 2 ContextIn many data analyses, it is desirable.docx
Assessment 2 ContextIn many data analyses, it is desirable.docxAssessment 2 ContextIn many data analyses, it is desirable.docx
Assessment 2 ContextIn many data analyses, it is desirable.docxfestockton
 
Assessment 2 ContextIn many data analyses, it is desirable.docx
Assessment 2 ContextIn many data analyses, it is desirable.docxAssessment 2 ContextIn many data analyses, it is desirable.docx
Assessment 2 ContextIn many data analyses, it is desirable.docxgalerussel59292
 
Correlational research
Correlational researchCorrelational research
Correlational researchAiden Yeh
 
Ebd1 lecture 8 2010
Ebd1  lecture 8 2010Ebd1  lecture 8 2010
Ebd1 lecture 8 2010Reko Kemo
 
Exercise 14Understanding Simple Linear RegressionStatistical Tec.docx
Exercise 14Understanding Simple Linear RegressionStatistical Tec.docxExercise 14Understanding Simple Linear RegressionStatistical Tec.docx
Exercise 14Understanding Simple Linear RegressionStatistical Tec.docxAlleneMcclendon878
 

Similar to MKRH - Correlation and regression (20)

EXERCISE 23 PEARSONS PRODUCT-MOMENT CORRELATION COEFFICIENT .docx
EXERCISE 23 PEARSONS PRODUCT-MOMENT CORRELATION COEFFICIENT .docxEXERCISE 23 PEARSONS PRODUCT-MOMENT CORRELATION COEFFICIENT .docx
EXERCISE 23 PEARSONS PRODUCT-MOMENT CORRELATION COEFFICIENT .docx
 
Correlation and Regression.pdf
Correlation and Regression.pdfCorrelation and Regression.pdf
Correlation and Regression.pdf
 
Data analysis test for association BY Prof Sachin Udepurkar
Data analysis   test for association BY Prof Sachin UdepurkarData analysis   test for association BY Prof Sachin Udepurkar
Data analysis test for association BY Prof Sachin Udepurkar
 
A Correlation Between Emotion-Focused Coping With Test...
A Correlation Between Emotion-Focused Coping With Test...A Correlation Between Emotion-Focused Coping With Test...
A Correlation Between Emotion-Focused Coping With Test...
 
Simple correlation
Simple correlationSimple correlation
Simple correlation
 
Data processing
Data processingData processing
Data processing
 
Aantekeningen uit referenties van Biostatistics.docx
Aantekeningen uit referenties van Biostatistics.docxAantekeningen uit referenties van Biostatistics.docx
Aantekeningen uit referenties van Biostatistics.docx
 
Central tedancy & correlation project - 1
Central tedancy & correlation project - 1Central tedancy & correlation project - 1
Central tedancy & correlation project - 1
 
4. correlations
4. correlations4. correlations
4. correlations
 
Measurement theory
Measurement theoryMeasurement theory
Measurement theory
 
Statistics- chapter4.pdf
Statistics- chapter4.pdfStatistics- chapter4.pdf
Statistics- chapter4.pdf
 
BUS 308 – Week 4 Lecture 2 Interpreting Relationships .docx
BUS 308 – Week 4 Lecture 2 Interpreting Relationships .docxBUS 308 – Week 4 Lecture 2 Interpreting Relationships .docx
BUS 308 – Week 4 Lecture 2 Interpreting Relationships .docx
 
BUS 308 – Week 4 Lecture 2 Interpreting Relationships .docx
BUS 308 – Week 4 Lecture 2 Interpreting Relationships .docxBUS 308 – Week 4 Lecture 2 Interpreting Relationships .docx
BUS 308 – Week 4 Lecture 2 Interpreting Relationships .docx
 
Simple regressionand correlation (2).pdf
Simple regressionand correlation (2).pdfSimple regressionand correlation (2).pdf
Simple regressionand correlation (2).pdf
 
statistics in nursing
 statistics in nursing statistics in nursing
statistics in nursing
 
Assessment 2 ContextIn many data analyses, it is desirable.docx
Assessment 2 ContextIn many data analyses, it is desirable.docxAssessment 2 ContextIn many data analyses, it is desirable.docx
Assessment 2 ContextIn many data analyses, it is desirable.docx
 
Assessment 2 ContextIn many data analyses, it is desirable.docx
Assessment 2 ContextIn many data analyses, it is desirable.docxAssessment 2 ContextIn many data analyses, it is desirable.docx
Assessment 2 ContextIn many data analyses, it is desirable.docx
 
Correlational research
Correlational researchCorrelational research
Correlational research
 
Ebd1 lecture 8 2010
Ebd1  lecture 8 2010Ebd1  lecture 8 2010
Ebd1 lecture 8 2010
 
Exercise 14Understanding Simple Linear RegressionStatistical Tec.docx
Exercise 14Understanding Simple Linear RegressionStatistical Tec.docxExercise 14Understanding Simple Linear RegressionStatistical Tec.docx
Exercise 14Understanding Simple Linear RegressionStatistical Tec.docx
 

Recently uploaded

How consumers use technology and the impacts on their lives
How consumers use technology and the impacts on their livesHow consumers use technology and the impacts on their lives
How consumers use technology and the impacts on their livesMathuraa
 
Busty Desi⚡Call Girls in Sector 49 Noida Escorts >༒8448380779 Escort Service
Busty Desi⚡Call Girls in Sector 49 Noida Escorts >༒8448380779 Escort ServiceBusty Desi⚡Call Girls in Sector 49 Noida Escorts >༒8448380779 Escort Service
Busty Desi⚡Call Girls in Sector 49 Noida Escorts >༒8448380779 Escort ServiceDelhi Call girls
 
Discover Ardency Elite: Elevate Your Lifestyle
Discover Ardency Elite: Elevate Your LifestyleDiscover Ardency Elite: Elevate Your Lifestyle
Discover Ardency Elite: Elevate Your LifestyleMy Heart Throw Pillow
 
10 Email Marketing Best Practices to Increase Engagements, CTR, And ROI
10 Email Marketing Best Practices to Increase Engagements, CTR, And ROI10 Email Marketing Best Practices to Increase Engagements, CTR, And ROI
10 Email Marketing Best Practices to Increase Engagements, CTR, And ROIShamsudeen Adeshokan
 
Press Release Distribution Evolving with Digital Trends.pdf
Press Release Distribution Evolving with Digital Trends.pdfPress Release Distribution Evolving with Digital Trends.pdf
Press Release Distribution Evolving with Digital Trends.pdfPR Wires
 
Social Media Marketing Portfolio - Maharsh Benday
Social Media Marketing Portfolio - Maharsh BendaySocial Media Marketing Portfolio - Maharsh Benday
Social Media Marketing Portfolio - Maharsh BendayMaharshBenday
 
VIP Call Girls Dongri WhatsApp +91-9833363713, Full Night Service
VIP Call Girls Dongri WhatsApp +91-9833363713, Full Night ServiceVIP Call Girls Dongri WhatsApp +91-9833363713, Full Night Service
VIP Call Girls Dongri WhatsApp +91-9833363713, Full Night Servicemeghakumariji156
 
[Expert Panel] New Google Shopping Ads Strategies Uncovered
[Expert Panel] New Google Shopping Ads Strategies Uncovered[Expert Panel] New Google Shopping Ads Strategies Uncovered
[Expert Panel] New Google Shopping Ads Strategies UncoveredSearch Engine Journal
 
The+State+of+Careers+In+Retention+Marketing-2.pdf
The+State+of+Careers+In+Retention+Marketing-2.pdfThe+State+of+Careers+In+Retention+Marketing-2.pdf
The+State+of+Careers+In+Retention+Marketing-2.pdfSocial Samosa
 
Unlocking the Mystery of the Voynich Manuscript
Unlocking the Mystery of the Voynich ManuscriptUnlocking the Mystery of the Voynich Manuscript
Unlocking the Mystery of the Voynich Manuscriptelizabethella096
 
The Science of Landing Page Messaging.pdf
The Science of Landing Page Messaging.pdfThe Science of Landing Page Messaging.pdf
The Science of Landing Page Messaging.pdfVWO
 
Rise and fall of Kulula.com, an airline won consumers by different marketing ...
Rise and fall of Kulula.com, an airline won consumers by different marketing ...Rise and fall of Kulula.com, an airline won consumers by different marketing ...
Rise and fall of Kulula.com, an airline won consumers by different marketing ...ssusereaa7d9
 
Major SEO Trends in 2024 - Banyanbrain Digital
Major SEO Trends in 2024 - Banyanbrain DigitalMajor SEO Trends in 2024 - Banyanbrain Digital
Major SEO Trends in 2024 - Banyanbrain DigitalBanyanbrain
 
Social media, ppt. Features, characteristics
Social media, ppt. Features, characteristicsSocial media, ppt. Features, characteristics
Social media, ppt. Features, characteristicswasim792942
 
Martal Group - B2B Lead Gen Agency - Onboarding Overview
Martal Group - B2B Lead Gen Agency - Onboarding OverviewMartal Group - B2B Lead Gen Agency - Onboarding Overview
Martal Group - B2B Lead Gen Agency - Onboarding OverviewMartal Group
 
2024 Social Trends Report V4 from Later.com
2024 Social Trends Report V4 from Later.com2024 Social Trends Report V4 from Later.com
2024 Social Trends Report V4 from Later.comnmislamchannal
 
Unveiling the Legacy of the Rosetta stone A Key to Ancient Knowledge.pptx
Unveiling the Legacy of the Rosetta stone A Key to Ancient Knowledge.pptxUnveiling the Legacy of the Rosetta stone A Key to Ancient Knowledge.pptx
Unveiling the Legacy of the Rosetta stone A Key to Ancient Knowledge.pptxelizabethella096
 
Busty Desi⚡Call Girls in Sector 135 Noida Escorts >༒8448380779 Escort Service
Busty Desi⚡Call Girls in Sector 135 Noida Escorts >༒8448380779 Escort ServiceBusty Desi⚡Call Girls in Sector 135 Noida Escorts >༒8448380779 Escort Service
Busty Desi⚡Call Girls in Sector 135 Noida Escorts >༒8448380779 Escort ServiceDelhi Call girls
 
W.H.Bender Quote 61 -Influential restaurant and food service industry network...
W.H.Bender Quote 61 -Influential restaurant and food service industry network...W.H.Bender Quote 61 -Influential restaurant and food service industry network...
W.H.Bender Quote 61 -Influential restaurant and food service industry network...William (Bill) H. Bender, FCSI
 
TAM_AdEx-Cross_Media_Report-Banking_Finance_Investment_(BFSI)_2023.pdf
TAM_AdEx-Cross_Media_Report-Banking_Finance_Investment_(BFSI)_2023.pdfTAM_AdEx-Cross_Media_Report-Banking_Finance_Investment_(BFSI)_2023.pdf
TAM_AdEx-Cross_Media_Report-Banking_Finance_Investment_(BFSI)_2023.pdfSocial Samosa
 

Recently uploaded (20)

How consumers use technology and the impacts on their lives
How consumers use technology and the impacts on their livesHow consumers use technology and the impacts on their lives
How consumers use technology and the impacts on their lives
 
Busty Desi⚡Call Girls in Sector 49 Noida Escorts >༒8448380779 Escort Service
Busty Desi⚡Call Girls in Sector 49 Noida Escorts >༒8448380779 Escort ServiceBusty Desi⚡Call Girls in Sector 49 Noida Escorts >༒8448380779 Escort Service
Busty Desi⚡Call Girls in Sector 49 Noida Escorts >༒8448380779 Escort Service
 
Discover Ardency Elite: Elevate Your Lifestyle
Discover Ardency Elite: Elevate Your LifestyleDiscover Ardency Elite: Elevate Your Lifestyle
Discover Ardency Elite: Elevate Your Lifestyle
 
10 Email Marketing Best Practices to Increase Engagements, CTR, And ROI
10 Email Marketing Best Practices to Increase Engagements, CTR, And ROI10 Email Marketing Best Practices to Increase Engagements, CTR, And ROI
10 Email Marketing Best Practices to Increase Engagements, CTR, And ROI
 
Press Release Distribution Evolving with Digital Trends.pdf
Press Release Distribution Evolving with Digital Trends.pdfPress Release Distribution Evolving with Digital Trends.pdf
Press Release Distribution Evolving with Digital Trends.pdf
 
Social Media Marketing Portfolio - Maharsh Benday
Social Media Marketing Portfolio - Maharsh BendaySocial Media Marketing Portfolio - Maharsh Benday
Social Media Marketing Portfolio - Maharsh Benday
 
VIP Call Girls Dongri WhatsApp +91-9833363713, Full Night Service
VIP Call Girls Dongri WhatsApp +91-9833363713, Full Night ServiceVIP Call Girls Dongri WhatsApp +91-9833363713, Full Night Service
VIP Call Girls Dongri WhatsApp +91-9833363713, Full Night Service
 
[Expert Panel] New Google Shopping Ads Strategies Uncovered
[Expert Panel] New Google Shopping Ads Strategies Uncovered[Expert Panel] New Google Shopping Ads Strategies Uncovered
[Expert Panel] New Google Shopping Ads Strategies Uncovered
 
The+State+of+Careers+In+Retention+Marketing-2.pdf
The+State+of+Careers+In+Retention+Marketing-2.pdfThe+State+of+Careers+In+Retention+Marketing-2.pdf
The+State+of+Careers+In+Retention+Marketing-2.pdf
 
Unlocking the Mystery of the Voynich Manuscript
Unlocking the Mystery of the Voynich ManuscriptUnlocking the Mystery of the Voynich Manuscript
Unlocking the Mystery of the Voynich Manuscript
 
The Science of Landing Page Messaging.pdf
The Science of Landing Page Messaging.pdfThe Science of Landing Page Messaging.pdf
The Science of Landing Page Messaging.pdf
 
Rise and fall of Kulula.com, an airline won consumers by different marketing ...
Rise and fall of Kulula.com, an airline won consumers by different marketing ...Rise and fall of Kulula.com, an airline won consumers by different marketing ...
Rise and fall of Kulula.com, an airline won consumers by different marketing ...
 
Major SEO Trends in 2024 - Banyanbrain Digital
Major SEO Trends in 2024 - Banyanbrain DigitalMajor SEO Trends in 2024 - Banyanbrain Digital
Major SEO Trends in 2024 - Banyanbrain Digital
 
Social media, ppt. Features, characteristics
Social media, ppt. Features, characteristicsSocial media, ppt. Features, characteristics
Social media, ppt. Features, characteristics
 
Martal Group - B2B Lead Gen Agency - Onboarding Overview
Martal Group - B2B Lead Gen Agency - Onboarding OverviewMartal Group - B2B Lead Gen Agency - Onboarding Overview
Martal Group - B2B Lead Gen Agency - Onboarding Overview
 
2024 Social Trends Report V4 from Later.com
2024 Social Trends Report V4 from Later.com2024 Social Trends Report V4 from Later.com
2024 Social Trends Report V4 from Later.com
 
Unveiling the Legacy of the Rosetta stone A Key to Ancient Knowledge.pptx
Unveiling the Legacy of the Rosetta stone A Key to Ancient Knowledge.pptxUnveiling the Legacy of the Rosetta stone A Key to Ancient Knowledge.pptx
Unveiling the Legacy of the Rosetta stone A Key to Ancient Knowledge.pptx
 
Busty Desi⚡Call Girls in Sector 135 Noida Escorts >༒8448380779 Escort Service
Busty Desi⚡Call Girls in Sector 135 Noida Escorts >༒8448380779 Escort ServiceBusty Desi⚡Call Girls in Sector 135 Noida Escorts >༒8448380779 Escort Service
Busty Desi⚡Call Girls in Sector 135 Noida Escorts >༒8448380779 Escort Service
 
W.H.Bender Quote 61 -Influential restaurant and food service industry network...
W.H.Bender Quote 61 -Influential restaurant and food service industry network...W.H.Bender Quote 61 -Influential restaurant and food service industry network...
W.H.Bender Quote 61 -Influential restaurant and food service industry network...
 
TAM_AdEx-Cross_Media_Report-Banking_Finance_Investment_(BFSI)_2023.pdf
TAM_AdEx-Cross_Media_Report-Banking_Finance_Investment_(BFSI)_2023.pdfTAM_AdEx-Cross_Media_Report-Banking_Finance_Investment_(BFSI)_2023.pdf
TAM_AdEx-Cross_Media_Report-Banking_Finance_Investment_(BFSI)_2023.pdf
 

MKRH - Correlation and regression

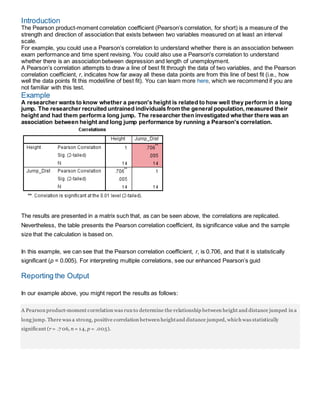
  • 1. Introduction The Pearson product-moment correlation coefficient (Pearson’s correlation, for short) is a measure of the strength and direction of association that exists between two variables measured on at least an interval scale. For example, you could use a Pearson’s correlation to understand whether there is an association between exam performance and time spent revising. You could also use a Pearson's correlation to understand whether there is an association between depression and length of unemployment. A Pearson’s correlation attempts to draw a line of best fit through the data of two variables, and the Pearson correlation coefficient, r, indicates how far away all these data points are from this line of best fit (i.e., how well the data points fit this model/line of best fit). You can learn more here, which we recommend if you are not familiar with this test. Example A researcher wants to know whether a person's height is related to how well they perform in a long jump. The researcher recruited untrained individuals from the general population, measured their height and had them performa long jump. The researcher then investigated whether there was an association between height and long jump performance by running a Pearson's correlation. The results are presented in a matrix such that, as can be seen above, the correlations are replicated. Nevertheless, the table presents the Pearson correlation coefficient, its significance value and the sample size that the calculation is based on. In this example, we can see that the Pearson correlation coefficient, r, is 0.706, and that it is statistically significant (p = 0.005). For interpreting multiple correlations, see our enhanced Pearson’s guid Reporting the Output In our example above, you might report the results as follows: A Pearson product-moment correlation was run to determine the relationship between height and distance jumped in a long jump. There was a strong, positive correlation between heightand distance jumped, which was statistically significant (r = .7 06, n = 14, p = .005).
  • 2. Introduction Partial correlation is a measure of the strength and direction of a linear relationship between two continuous variables whilst controlling for the effect of one or more other continuous variables (also known as 'covariates' or 'control' variables). Although partial correlation does not make the distinction between independent and dependent variables, the two variables are often considered in such a manner (i.e., you have one continuous dependent variable and one continuous independent variable, as well as one or more continuous control variables). Example & Data Setup in SPSS Statistics A researcher wants to know whether there is a statistically significant linear relationship between VO2max (a marker of aerobic fitness) and a person's weight. Furthermore, the researcher wants to know whether this relationship remains after accounting for a person's age (i.e., if the relationship is influenced by a person's age). Therefore, the researcher uses partial correlation to determine whether there is a linear relationship between VO2max and weight, whilst controlling for age (i.e., the continuous dependent variable is "VO2max", measured in ml/min/kg, the continuous independent variable is "weight", measured in kg, and the control variable – that is, the additional continuous independent variable the researcher is adjusting for – is "age", measured in years). You will be presented with the Descriptive Statistics and Correlations tables in the IBM SPSS Statistics Viewer window. We suggest starting with the Descriptive Statistics table to get a 'feel' for your data, as shown below: Published with written permission from SPSS Statistics,IBM Corporation. The descriptive statistics show that we had no missing data since the recorded sample size, N = 100, is the same as the number of participants that took part in the study. We can also see that the mean value of the dependent variable, VO2max, was 43.63 ml/min/kg (with a standard deviation of 8.57 ml/min/kg), whilst the mean weight of participants was 79.7 kg (with a standard deviation of 15.1 kg), and finally, the mean age of participants was 31.1 years (with a standard deviation of 9.1 years). This suggests that the sample of participants was slightly on the younger side rather than representing
  • 3. the population as a whole, which is useful to know when discussing the generalizability of the findings in your report. Next, we suggest looking at the Correlations table, as shown below: Published with written permission from SPSS Statistics,IBM Corporation. The Correlations table is split into two main parts: (a) the Pearson product-moment correlation coefficients for all your variables – that is, your dependent variable, independent variable, and one or more control variables – as highlighted by the blue rectangle; and (b) the results from the partial correlation where the Pearson product-moment correlation coefficient between the dependent and independent variable has been adjusted to take into account the control variable(s), as highlighted by the red rectangle. The results of the partial correlation highlighted by the red rectangle show that there was a moderate, negative partial correlation between the dependent variable, "VO2max", and independent variable, "weight", whilst controlling for "age", which was statistically significant (r(97) = -.314, n = 100, p = .002). However, when we refer to the Pearson's product-moment correlation – also known as the zero-order correlation – between "VO2max" and "weight", without controlling for "age", as highlighted by the blue rectangle, we can see that there was also a statistically significant, moderate, negative correlation between "VO2max" and "weight" (r(98) = -.307, n = 100, p = .002). This suggests that "age" had very little influence in controlling for the relationship between "VO2max" and "weight"
  • 4. Introduction The Spearman rank-order correlation coefficient (Spearman’s correlation, for short) is a nonparametric measure of the strength and direction of association that exists between two variables measured on at least an ordinal scale. It is denoted by the symbol rs (or the Greek letter ρ, pronounced rho). The test is used for either ordinal variables or for continuous data that has failed the assumptions necessary for conducting the Pearson's product-moment correlation. For example, you could use a Spearman’s correlation to understand whether there is an association between exam performance and time spent revising; whether there is an association between depression and length of unemployment; and so forth. Example A teacher is interested in whether those who do better at English also do better in maths. To test whether this is the case, the teacher records the scores of her 10 students in their end-of-year examinations for both English and maths. Therefore, one variable records the English scores and the second variable records the maths scores for the 10 pupils. The results are presented in a matrix such that, as can be seen above, the correlations are replicated. Nevertheless, the table presents Spearman's correlation, its significance value and the sample size that the calculation was based on. In this example, we can see that Spearman's correlation coefficient, rs, is 0.669, and that this is statistically significant (p = .035). Reporting the Output A Spearman's rank-order correlation was run to determine the relationship between 10 students' English and maths exam marks. There was a strong, positive correlation between English and maths marks, which was statistically significant (rs(8) = .669, p = .035).
  • 5. Introduction Kendall's tau-b (τb) correlation coefficient (Kendall's tau-b, for short) is a nonparametric measure of the strength and direction of association that exists between two variables measured on at least an ordinal scale. It is considered a nonparametric alternative to the Pearson’s product-moment correlation when your data has failed one or more of the assumptions of this test. It is also considered an alternative to the nonparametric Spearman rank-order correlation coefficient (especially when you have a small sample size with many tied ranks). If you consider one of your variables as an independent variable and the other as a dependent variable, you might consider running a Somers' dtest instead. you could use Kendall's tau-b to understand whether there is an association between customer satisfaction and delivery time (i.e., where delivery time had four categories – next day, 2 working days, 3-5 working days, and more than 5 working days – and customer satisfaction was measured in terms of the level of agreement customers had with the following statement, "I am satisfied with the time it took for my parcel to be delivered", where the level of agreement had five categories: strongly agree, agree, neither agree nor disagree, disagree and strongly disagree). Example & Data Setup in SPSS Statistics Taxes have the ability to elicit strong responses in many people, with some thinking they are too high, whilst others think they should be higher. A researcher conducted a simple study where they presented participants with the statement: "Tax is too high in this country", and asked them how much they agreed with this statement. They had four options how to respond: "Strongly Disagree", "Disagree", "Agree" or "Strongly Agree". These ordered responses were the categories of the dependent variable, tax_too_high . The researcher also asked participants to state whether they had a "low", "middle" or "high" income, where each of these categories had specified income ranges (e.g., a low income was any income under £18,000 per annum). The income level of participants was recorded in the variable, income . A Kendall's tau-b correlation was run to determine the relationship between income level and views towards income taxes amongst 24 participants. There was a strong, positive correlation between income level and the view that taxes were too high, which was statistically significant (τb = .535, p = .003).
  • 6. Introduction Linear regression is the next step up after correlation. It is used when we want to predict the value of a variable based on the value of another variable. The variable we want to predict is called the dependent variable (or sometimes, the outcome variable). The variable we are using to predict the other variable's value is called the independent variable (or sometimes, the predictor variable). For example, you could use linear regression to understand whether exam performance can be predicted based on revision time; whether cigarette consumption can be predicted based on smoking duration; and so forth. If you have two or more independent variables, rather than just one, you need to use multiple regression. Example A salesperson for a large car brand wants to determine whether there is a relationship between an individual's income and the price they pay for a car. As such, the individual's "income" is the independent variable and the "price" they pay for a car is the dependent variable. The salesperson wants to use this information to determine which cars to offer potential customers in new areas where average income is known. The first table of interest is the Model Summary table, as shown below: Published with written permission from SPSS Statistics,IBM Corporation. This table provides the R and R2 values. The R value represents the simple correlation and is 0.873 (the "R" Column), which indicates a high degree of correlation. The R2 value (the "R Square" column) indicates how much of the total variation in the dependent variable, Price , can be explained by the independent variable, Income . In this case, 76.2% can be explained, which is very large. The next table is the ANOVA table, which reports how well the regression equation fits the data (i.e., predicts the dependent variable) and is shown below:
  • 7. Published with written permission from SPSS Statistics,IBM Corporation. This table indicates that the regression model predicts the dependent variable significantly well. How do we know this? Look at the "Regression" row and go to the "Sig." column. This indicates the statistical significance of the regression model that was run. Here, p < 0.0005, which is less than 0.05, and indicates that, overall, the regression model statistically significantly predicts the outcome variable (i.e., it is a good fit for the data). The Coefficients table provides us with the necessary information to predict price from income, as well as determine whether income contributes statistically significantly to the model (by looking at the "Sig." column). Furthermore, we can use the values in the "B" column under the "Unstandardized Coefficients"column, as shown below: Published with written permission from SPSS Statistics,IBM Corporation. to present the regression equation as: Price = 8287 + 0.564(Income)
  • 8. Introduction Multiple regression is an extension of simple linear regression. It is used when we want to predict the value of a variable based on the value of two or more other variables. The variable we want to predict is called the dependent variable (or sometimes, the outcome, target or criterion variable). The variables we are using to predict the value of the dependent variable are called the independent variables (or sometimes, the predictor, explanatory or regressor variables). For example, you could use multiple regression to understand whether exam performance can be predicted based on revision time, test anxiety, lecture attendance and gender. Alternately, you could use multiple regression to understand whether daily cigarette consumption can be predicted based on smoking duration, age when started smoking, smoker type, income and gender. Example A health researcher wants to be able to predict "VO2max", an indicator of fitness and health. Normally, to perform this procedure requires expensive laboratory equipment and necessitates that an individual exercise to their maximum (i.e., until they can longer continue exercising due to physical exhaustion). This can put off those individuals who are not very active/fit and those individuals who might be at higher risk of ill health (e.g., older unfit subjects). For these reasons, it has been desirable to find a way of predicting an individual's VO2max based on attributes that can be measured more easily and cheaply. To this end, a researcher recruited 100 participants to perform a maximum VO2max test, but also recorded their "age", "weight", "heart rate" and "gender". Heart rate is the average of the last 5 minutes of a 20 minute, much easier, lower workload cycling test. The researcher's goal is to be able to predict VO2max based on these four attributes: age, weight, heart rate and gender. Determining how well the model fits The first table of interest is the Model Summary table. This table provides the R, R2 , adjusted R2 , and the standard error of the estimate, which can be used to determine how well a regression model fits the data: Published with written permission from SPSS Statistics,IBM Corporation.
  • 9. The "R" column represents the value of R, the multiple correlation coefficient. R can be considered to be one measure of the quality of the prediction of the dependent variable; in this case, VO2max. A value of 0.760, in this example, indicates a good level of prediction. The "R Square" column represents the R2 value (also called the coefficient of determination), which is the proportion of variance in the dependent variable that can be explained by the independent variables (technically, it is the proportion of variation accounted for by the regression model above and beyond the mean model). You can see from our value of 0.577 that our independent variables explain 57.7% of the variability of our dependent variable, VO2max. However, you also need to be able to interpret "Adjusted R Square" (adj. R2 ) to accurately report your data. We explain the reasons for this, as well as the output, in our enhanced multiple regression guide. Statistical significance The F-ratio in the ANOVA table (see below) tests whether the overall regression model is a good fit for the data. The table shows that the independent variables statistically significantly predict the dependent variable, F(4, 95) = 32.393, p < .0005 (i.e., the regression model is a good fit of the data). Estimated model coefficients The general form of the equation to predict VO2max from age , weight , heart_rate , gender , is:predicted VO2max = 87.83 – (0.165 x age ) – (0.385 x weight ) – (0.118 x heart_rate ) + (13.208 x gender ) This is obtained from the Coefficients table, as shown below:
  • 10. .Unstandardized coefficients indicate how much the dependent variable varies with an independent variable when all other independent variables are held constant. Consider the effect of age in this example. The unstandardized coefficient, B1, for age is equal to -0.165 (see Coefficients table). This means that for each one year increase in age, there is a decrease in VO2max of 0.165 ml/min/kg. Statistical significance of the independent variables You can test for the statistical significance of each of the independent variables. This tests whether the unstandardized (or standardized) coefficients are equal to 0 (zero) in the population. If p < .05, you can conclude that the coefficients are statistically significantly different to 0 (zero). The t-value and corresponding p-value are located in the "t" and "Sig." columns, respectively, as highlighted below: Published with written permission from SPSS Statistics,IBM Corporation. You can see from the "Sig." column that all independent variable coefficients are statistically significantly different from 0 (zero). Although the intercept, B0, is tested for statistical significance, this is rarely an important or interesting finding. Putting it all together You could write up the results as follows:  General A multiple regression was run to predict VO2 max from gender, age, weight and heart rate. These variables statistically significantly predicted VO2 max, F(4, 95) = 32.393, p < .0005, R2 = .577. All four variables added statistically significantly to the prediction, p < .05.