High-Speed Neural Network Controller for Autonomous Robot Navigation using FPGA
System Document (Revised)
1. SYSTEM DOCUMENT 1
SYSTEM DOCUMENT
Project: DPM Design Project 2015
Task: Construct an autonomous robot capable of identifying its position and navigating to specific points
when placed within a 12’ x 12’ enclosure containing several obstacles and shoot Ping-Pong balls at
specified targets.
Document Version Number: 7.
Date: April 12th 2015.
Authors: Bahar Demirli,Hernan Gatta.
1 TABLE OF CONTENTS
2 System Model..................................................................................................................2
3 Hardware Available and Capabilities.................................................................................3
3.1 Lego Mindstorms Kits .................................................................................................3
3.2 Processor...................................................................................................................3
3.3 I/O.............................................................................................................................3
3.4 Power........................................................................................................................3
4 Software Available and Capabilities..................................................................................3
4.1 Software Available......................................................................................................3
4.2 Software Development Kits.........................................................................................3
4.3 Available Code............................................................................................................4
5 Compatibility...................................................................................................................4
6 Reusability.......................................................................................................................4
7 Structures........................................................................................................................4
7.1 Software Structures....................................................................................................4
7.2 Mechanical and Electrical Structures............................................................................4
8 Methodologies.................................................................................................................5
8.1 Software Methodologies.............................................................................................5
8.1.1 Coordinate System...............................................................................................5
8.1.2 Ultrasonic Localization..........................................................................................5
8.1.3 Navigation...........................................................................................................9
8.1.4 Gridline Detection..............................................................................................10
9 Tools..............................................................................................................................13
9.1 Software Tools .........................................................................................................13
9.2 Hardware Tools........................................................................................................13
10 Glossary of Terms.........................................................................................................14
2. SYSTEM DOCUMENT 2
2 SYSTEM MODEL
Robot
Navigation
Localization
Ultrasonic
Light
Odometry Odometry Correction
Path Finding
Obstacle Map
Precomputed Paths
Targeting
Aiming
Shooting
Cradle
Gun
Servo Control
Motors
Actuators
Sensor Input Filters
Mean
Average
Differential
3. SYSTEM DOCUMENT 3
3 HARDWARE AVAILABLE AND CAPABILITIES
3.1 LEGO MINDSTORMS KITS
Three Lego Mindstorms kits areavailable.Each kits includes thefollowingparts:
1 NXT brick;
1 Touch sensor;
1 Ultrasonic sensor;
2 Light sensors (detects red, green, blue, yellow,black and white/light levels);
2 Servo motors;
Structural and connecting parts of various shapesand sizes.
3.2 PROCESSOR
Each NXT brick ships with the following processor specifications:
Atmel AT91SAM7S256 CPU:
o 32-bitARM7TDMI-core processor;
o 256KBof FLASH;
o 64KB of RAM.
8-bitAtmel AVR ATmega48 microcontroller:
o 4KB of FLASH;
o 512B of RAM.
3.3 I/O
Each NXT brick ships with the followingI/O specifications:
4 sensor ports and 3 motor ports over RJ12 connections;
Bluetooth Class II V2.0;
1 100x60 monochrome console;
1 Speaker (samplingbetween 2-16kHz);
1 USB port.
3.4 POWER
Each NXT brick ships with the followingpower specifications:
6 AA batteries @ 1.5V.
4 SOFTWARE AVAILABLE AND CAPABILITIES
4.1 SOFTWAREAVAILABLE
Lego Digital Designer (LDD): Robot Modelling;
Lego Mindstorms Software: LabVIEW modeler and utilities;
Eclipse+ leJOS plugin:Java IDE and uploader.
4.2 SOFTWAREDEVELOPMENTKITS
leJOS NXT: Java-based runtimeand libraries
o Java-based;
o Powerful API;
o Possibly slower,bulkier codeas Java is a high-level system;
o Lego-supported.
NXT-G: LabVIEW-based runtime
o Ease of use;
4. SYSTEM DOCUMENT 4
o Difficultto implement complex programs;
o Lego-supported.
ROBOTC: C-based languageand libraries
o C-based;
o Possibly faster,lighter binaries;
o 3rd party;
o Not free.
MicrosoftRobotics Studio:
o .NET-based (C#, VB.NET, etc.)
o Possibly faster than Java,do not know if code is compiled to IL or binary;
o 3rd party;
o Free.
4.3 AVAILABLECODE
Code is available from the R&D labs carried out by the members of the team prior to assembling the final
group; three such software sets are available for use. This existing software will, naturally, require
modifications to fitthe final robotdesign.
5 COMPATIBILITY
There are no plans to integrate 3rd party blocks into the robot and Lego’s own libraries are assumed to be
internally compatible.
6 REUSABILITY
The following list describes the fundamental elements from previous labs that have reusable material at
our disposal:
Odometry and odometry correction (software) were developed in labs 2 and 3;
Navigation (software), developed in lab 3;
Localization (software),developed in lab 4;
Launchingmechanism(hardware) derived in lab 5;
Fallingand RisingEdge detection techniques for obstacledetection, lab 1.
7 STRUCTURES
7.1 SOFTWARESTRUCTURES
The software controllers for the various functional blocks should be separate and communicate only
through defined interfaces. This will allow multiple subsystems to be built, modified and tested
independently.
7.2 MECHANICALANDELECTRICAL STRUCTURES
The followingliststhestructures used for the final mechanical design:
1 ultrasonicsensor located atthe front-center of the robot (for localization);
3 light sensors located directly behind each wheel and on the center of the robot for improved
odometry correction and localization;
A launchingmechanism(with the use of a motor), constructed with Lego pieces;
One NXT brick (3 motor ports and 4 sensor ports required);
Rubber elastic bands wrapped around the launcher.
5. SYSTEM DOCUMENT 5
8 METHODOLOGIES
8.1 SOFTWAREMETHODOLOGIES
8.1.1 Coordinate System
The software adopts the coordinate system of the odometer developed in lab 1. This coordinate system is
defined as follows:
1. The Y-axis crosses therobot back to front;
2. The X-axis crosses therobot from port to starboard;
3. The positiveY-axis points in the direction of 0°;
4. Heading increases clockwise.
The rationale behind this choice is that every other software component developed in further labs
assumes this coordinatesystem.
8.1.1.1 Noteson the built-in odometer
The leJOS API ships with an odometer whose functionality is equivalent to that developed in lab 1.
However, this odometer works in a coordinate system with two wrap-around points, as opposed to one.
Namely, the (180°, 359°) range in the lab’s odometer maps to (180°, 1°) and the (0°, 179°) range maps to
(0°, -179°). An attempt was made to integrate this odometer into the controlling software in order to use
other components provided by the leJOS API. However, mapping already existing localization components
to this new coordinate system proved quite difficult, given ambiguities in the sign of the angles. While
adopting the built-in odometer would have enabled seamless usage of other provided classes, it was
decided to abandon that effort due to these mappingproblems.
8.1.2 Ultrasonic Localization
During the development of the control software, two ultrasonic sensor localization routines were
designed, implemented and tested. While only one of these is in use, both of them will be described and
discussed.
8.1.2.1 Overview
As per the project guidelines, the robot will be placed anywhere within a two-square by two-square area,
in an arbitrary heading. Two issues arise with this setting. First, if the robot is not placed on the imaginary
diagonal that joins the vertices of the starting area, beginning at the corner of the terrain, the distance
from the back and left wall to the robot will not be equal. For instance, were the robot to be pl aced in the
middle of tile (1, 2), the distance to the left wall will be half than that to the back wall. Therefore, preset
distance thresholds to latch angles as proposed in lab 4 are bound to fail. Second, at the farthest distance
from the corner of the terrain, i.e. tile (2, 2), distances to obstacles outside of the starting area are
comparable to distances to the back and left wall. Some mechanism must therefore be put in place to
avoid interpretingthe presence of obstacles beyond the startingarea as walls.
8.1.2.2 First Method
The first method considered for ultrasonic localization consists of rotating the robot on itself for a
complete turn while collecting distance samples. These samples are then analyzed to find certain features
of the resulting distance distribution whose associated information yields, after processing, both the
position and headingof the robot.
6. SYSTEM DOCUMENT 6
Shape of the Distance Distribution
Given the geometry of the starting area in which the robot is placed, the full clockwise turn distribution
always has a shapesimilar to the following (a valueof -1 indicates an incomplete collection buffer):
Figure 1: Single Ultrasonic Sensor Samples.
(Median Filter, 5 Sample Window Size, 50Hz Polling Rate, Started facing north, Collected over USB RConsole)
This distribution is primarily characterized by two sets of minima left and right of a small peak in the
valley. The central minima on either side of the peak correspond to the lowest distances to the back and
left walls, respectively. With regards to localization, collecting heading information along with every
sample in this distribution,it is possible to compare these distance-heading pairs against expected values.
That is, the lowest distances to both walls are expected to be at well-defined headings with respect to the
robot’s coordinate system. Computing the difference between the recorded and expected values, it is
straightforward to estimate the true heading of the robot. Furthermore, the distance information can be
used to estimate the (X, Y) position of the latter as well.
Distribution Shape Changes
It is important to note that, depending on the starting position and heading of the robot in the starting
area,the distribution will changeshape:
1. Different startingheadings will shiftthe distribution to either sidealongthe X-axis:
a. If the robot starts facinga wall,the valley will besplitinto two discontinuous portions.
2. If the distances to the left and back wall arenot equal:
a. The samples in the valley to the left and right of the peak will shift in either direction
alongthe Y-axis;
b. One set of samples to either the left or right of the peak will expand along the X-axis,
sincea longer arc is covered for the same change in heading;
c. The other set of samples will becompress alongthe X-axis,for the converse reason.
In other words, if the robot is not placed along the 45° diagonal of tile (1, 1) from the corner, the
distribution isasymmetric in both axes.
-1
49
99
149
199
249 360
13
28
43
57
72
87
102
117
132
147
162
177
192
206
221
236
251
266
281
295
310
325
340
355
10
25
40
55
70
85
99
114
SensorValue(cm)
Heading (degrees)
Raw Distance Filtered Distance
7. SYSTEM DOCUMENT 7
Algorithm
The procedure for ultrasonic localization will be as follows (the values chosen below were decided on by
analyzingtestdata; see companion Excel spreadsheets):
1. Rotate clockwiseuntil the open field is in viewof the ultrasonic sensor;
2. Reset the odometer (i.e. set (X, Y, Heading) equal to (0, 0, 0°));
3. Perform one full rotation clockwiseat30deg/s:
a. Poll distancesamples every 50ms:
i. Use a median filter on the rawdata;
ii. The window is 5 samples in width:
1. This corresponds to 250ms of data.
b. Associateto every distancepolled the current heading as reported by the odometer;
c. The resulting sample distribution consists of a collection of distance-heading pairs, in
the order in which they were collected.
4. Clip the resulting distribution by distance, thereby including only those pairs whose distance
valueis within 1cm and 60cm inclusively;
5. Classify thesamples by distancedifferentially:
a. Assemble contiguous samples whose distance values are within a 7cm band of one
another into clusters inclusively;
b. Each cluster must contain atleast 25 samples.
6. The result of this operation, provided the normal form of the distance distribution given the
geometry of the problem, can either be:
a. A singlecluster:
i. The bump in distancevalues atthe corner is less than the clusteringthreshold;
ii. The cluster thus covers both the back and left walls.
b. Two clusters:
i. Each cluster corresponds to the back and left walls,respectively.
7. If no cluster is found or more than two are detected, ultrasoniclocalization fails;
8. If only a singlecluster is detected:
a. Find the local maximum within a central band of width equal to the third of the number
of samples in the cluster;
b. Splitthe cluster into two clusters at said local maximum;
c. Proceed as in the next point.
9. If two clusters aredetected:
a. Find the minimum in each cluster which is closestto the center of said cluster;
b. The distance-heading pair of the first cluster corresponds to the smallest distance to the
back wall;
c. The distance-heading pair of the second cluster corresponds to the smallest distance to
the left wall;
10. The headings at which the minimum distances to the back and left wall are known, as per the
definition of the coordinatesystem. Hence:
a. Compute the signed difference between the expected heading for the back wall and the
recorded heading;
b. Idem for the left wall;
c. Compute the average of the differences;
d. Add this average to the reported odometer heading;
e. Adjust the new headingto be within the 0° to 360°range;
8. SYSTEM DOCUMENT 8
f. This final corrected headingis the true heading of the robot.
11. Use the minimum distances collected and the measured (X, Y) offsets from the center of the
ultrasonic sensor to the center of the robot to set the (X, Y) position of the latter in the obvious
way;
12. Move the robot to (0, 0, 45°).
Note: To compute the headings and distances for the back and left wall, average over three samples
around the minima.
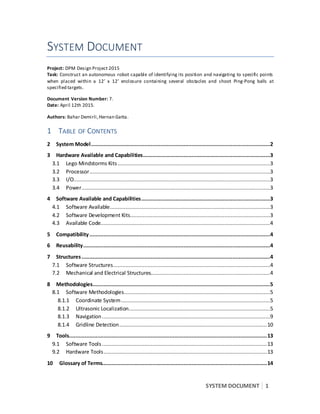
Figure 2: Sample Clustering (not the same distribution as above.)
(Lower Clip Bound = 1, Upper Clip Bound = 60, Differential Classifier Threshold = 7, Minimum Cluster Size = 25)
8.1.2.3 Second Method
The second method considered for ultrasonic localization is a simplified version of the first method.
Instead of attempting to split the distance reading distribution into two contiguous clusters, this second
method only looks for the cluster with the deepest minimum. Provided the geometry of the problem,
findingthis pointis guaranteed, whereas findinga proper cluster splitis not.
Algorithm
Notation: 𝐷𝑖𝑠𝑡𝑎𝑛𝑐𝑒 𝑜𝑓 𝑆𝑎𝑚𝑝𝑙𝑒 𝑊 = 𝐷( 𝑊); 𝐻𝑒𝑎𝑑𝑖𝑛𝑔 𝑜𝑓 𝑠𝑎𝑚𝑝𝑙𝑒 𝑊 = 𝐻( 𝑊).
1. Rotate clockwiseuntil the open field is in viewof the ultrasonic sensor;
2. Reset the odometer (i.e. set (X, Y, Heading) equal to (0, 0, 0°));
3. Perform one full rotation clockwiseat30deg/s:
a. Poll distancesamples every 50ms:
i. Use a median filter on the rawdata;
ii. The window is 3 samples in width:
1. This corresponds to 150ms of data.
b. Associateto every distancepolled the current heading as reported by the odometer;
c. The resulting sample distribution consists of a collection of distance-heading pairs, in
the order in which they were collected.
4. Find the pair with the minimum distance;
35
37
39
41
43
45
47
49
51
53
55
106
111
116
121
126
130
135
140
145
149
154
159
164
168
173
178
183
189
194
202
206
211
216
221
225
230
235
239
244
249
254
259
263
268
273
278
282
287
SensorValue(cm)
Heading (degrees)
Filtered Distances Left Cluster Right Cluster
9. SYSTEM DOCUMENT 9
5. Associate all adjacent distance samples around the minimum sample whose difference from the
latter is atmost one;
6. Find the samplein the middleof this set:
a. This sample’s headingcorresponds to the wall which is closestto the robot;
b. Let this samplebe 𝑊1 .
7. Rotate to 𝐻( 𝑊1
);
8. Rotate 90° clockwise;
9. If there is no wall,rotate 180° clockwise;
10. The robot is now facingthe other wall:
a. Collecta distance-headingpair;
b. Let this samplebe 𝑊2 .
11. If 𝐻( 𝑊1
) > 𝐻( 𝑊2
):
a. Sample 𝑊1 corresponds to the left wall 𝑊𝑙 ;
b. Sample 𝑊2 corresponds to the rightwall 𝑊𝑟 .
12. Otherwise:
a. Sample 𝑊1 corresponds to the rightwall 𝑊𝑟 ;
b. Sample 𝑊2 corresponds to the left wall 𝑊𝑙 .
13. Correct the (X, Y) position:
a. The corrected X position is: 𝐷( 𝑊𝑙
) − 𝑆𝑞𝑢𝑎𝑟𝑒 𝑊𝑖𝑑𝑡ℎ + 𝑈𝑙𝑡𝑟𝑎𝑠𝑜𝑛𝑖𝑐 𝑆𝑒𝑛𝑠𝑜𝑟 𝑂𝑓𝑓𝑠𝑒𝑡 ;
b. The corrected Y position is: 𝐷( 𝑊𝑟
) − 𝑆𝑞𝑢𝑎𝑟𝑒 𝑊𝑖𝑑𝑡ℎ + 𝑈𝑙𝑡𝑟𝑎𝑠𝑜𝑛𝑖𝑐 𝑆𝑒𝑛𝑠𝑜𝑟 𝑂𝑓𝑓𝑠𝑒𝑡 .
14. Correct the heading:
a. Compute the difference ∆1= 270° − 𝐻( 𝑊𝑙
);
b. Compute the difference ∆2= 180° − 𝐻( 𝑊𝑟
);
c. Compute the average of the differences: ∆̅= (∆1 + ∆2
) 2⁄ ;
d. This valuecorresponds to the error in the odometer;
e. Compute the corrected heading value: 𝐻 𝑛𝑒𝑤 = 𝑅𝑒𝑝𝑜𝑟𝑡𝑒𝑑 𝐻𝑒𝑎𝑑𝑖𝑛𝑔 + ∆̅;
f. If the valueis larger than 360°, subtract360°from it;
g. If the valueis negative, add 360° to it;
h. This final valueis thetrue current heading.
15. Move the robot to (0, 0, 45°).
8.1.2.4 Comparison
The second method clearly implements a much simpler version of the first in terms of calculations.
Namely, computation is traded for movement where instead of finding the minima directly from the
distance reading distribution, only one minimum is found way computationally and the second is located
by manipulating the robot. While this requires more time and energy, it is less prone to the changes to the
distribution outlined previously. In addition, the software is significantly less complex. Therefore, it is the
second method that is used in the controllingsoftware.
8.1.3 Navigation
As with ultrasonic localization,two different approaches will bepresented.
8.1.3.1 First Method
As per the project description, a map will be provided ahead of time. Using this information, a path
consisting of multiple waypoints can be incorporated into the source code for each different map before
10. SYSTEM DOCUMENT 10
starting. Once it is known which map will be used, this information will be provided to the robot before
the startof the run. The latter, will,in turn,followthe preset path.
8.1.3.2 Second Method
The second method consists of providing the known obstacles map to the robot in a defined format and
computing paths on the fly. As per the requirements and project description, a path from the starting
point to the shooting area is guaranteed to exist and all the necessary information to compute it is to be
provided to the robot ahead of time. As such,the followingmethodology can be adopted for navigation:
Upload the known maps to the robot ahead of time;
Inform the robot via its buttons which map to use before its run;
Transformthe map into a suitableinternal formatfor pathfinding;
Compute a path from the startingpointto the center of the shootingarea usingA*;
Travel through the waypoints in the path in cardinal directions,rotatingin placeto turn.
Map Format
A map consists of the followinginformation:
A binary matrix whoseentries correspond to subdivisionsin the grid of the floor:
o A zero entry corresponds to an empty subdivision,and a one otherwise.
The number of horizontal and vertical subdivisions;
The physical width and height of each subdivision.
Path Computation
The leJOS API provides an implementation of the A* algorithm. This implementation utilizes a graph-
based representation of the terrain’s topography. While a binary matrix is easiest to encode, it is
necessary to transformthe latter into the former. To such end, the followingalgorithmsuffices:
Create a node for each zero entry in the matrix and store them by their index into said matrix;
Connect adjacentnodes if their correspondingmatrix entries arezero;
Do not connect diagonally adjacentnodes sincetravel is in cardinal directions only.
Once the graph has been created, it is fed to an instance of the class that implements the A* algorithm.
The latter then returns an ordered collection of nodes that can be used for navigation.
Notes
For this navigation approach to function, it is necessary that the odometer not yield errors in position
greater than half of the grid subdivision’s dimensions minus the width of the robot. Otherwise, without
obstacle detection, the robot may eventually run into an obstacle. Furthermore, such errors in the
odometer will undermine the positioningof the robot for shooting.
8.1.3.3 Comparison
While the second method offers more flexibility, the first one is much simpler to implement. For the same
reasons as ultrasoniclocalization, thefirstmethod is currently used.
8.1.4 Gridline Detection
Three light sensors are mounted on the robot in order to detect gridlines printed on the terrain’s floor.
Detection of these gridlines is crucial for the robot to be able to perform light localization and to correct
cumulative deviations in the odometer’s values. This section presents the overall shape of the light sensor
value distribution at gridline crossings, issues involved in their detection and methods of recognizing their
presence that take these factors into consideration.
Sampling and Polling Rates
The internal sampling rate of light sensors appears to be 1kHz. At a forward speed of 8cm/s and a polling
rate of 200Hz in software, given that the gridlines are black and approximately 45mm in width, it is
possible to obtain up to 10 samples per gridline. Data collected during tests (shown below) indicate that
11. SYSTEM DOCUMENT 11
10 samples are amply sufficient to detect a line. However, it should be noted that it is up to the firmware
to schedule the polling threads on time, which in practice means that the true polling rate will never
exactly be 200Hz.
Shape of the Light Value Distribution
Figure 3: Light Sensor Samples.
(Unfiltered, Full Fluorescent Lab Lighting, Red Floodlight, 200Hz Polling Rate, 2 Gridline Crossings, Collected over
USB RConsole)
The distributions shown in Figure 3 clearly display a number of interesting phenomena that must be
factored in when attempting to detect gridlines.
Firstly, it is evident that the average value for each sensor is different, regardless of the fact that these
samples were all collected simultaneously and under the same environmental conditions. Therefore, each
sensor introduces its own constant bias in the readings. Furthermore, it is important to note that the dips
representing the same gridline are not of the same magnitude across sensors. This can be explained in
two different and not necessarily mutually exclusive ways. On the one hand, the gridlines on the floor
have been washed away over time. Thus, not every section of every gridline has the same strength of
black; on certain parts of the flooring, some lines have been almost completely worn off. On the other
hand, different sensors may have different sensitivities to lack of light. This can be attributed to a
multitude of factors such as scratches and erosion of the light intakes due to contact with the floor, dust
inside the sensors, etc. The fundamental take-away is that the same gridline may cause dips of varying
magnitudes across the sensors. Thirdly, it is expected that varying ambient lighting may cause vertical
shifts of the distribution. That is, the constant value bias may increase or decrease by increasing and
decreasing the amount of external light shining on the terrain. It is known that the competition will take
place on an area exposed to direct sunlight, which itself changes due to weather. In addition, it may be
noted from the distributions above that some points appear partway between the average distribution
value and the bottom of the dips. Since gridlines are not smeared, it is sensible to presume that a n
averaging mechanism may be built into the sensors. Moreover, it is obvious that a change in vertical
elevation of the sensors with respect to the ground will change the average distribution value, given there
will be less light falling on the detectors. Lastly, and perhaps most importantly, gridline values are
significantly offset from the average. In other words, noise is statistically insignificant with respect to the
values atgridlinecrossings.
90
190
290
390
490
590
1
5
9
13
17
21
25
29
33
37
41
45
49
53
57
61
65
69
73
77
81
85
89
93
97
101
105
109
113
117
121
125
129
133
RawValue
Sample Number
Left Sensor Center Sensor Right Sensor
12. SYSTEM DOCUMENT 12
The followinglistsummarizes theseconclusions:
1. Sensors introducetheir own, constantvertical bias;
2. Sensors detect the same gridlinewith different dip magnitudes;
3. Ambient lightintroduces an external, potentially varyingvertical bias;
4. The fall fromthe average distribution valueand the bottom of each dip may be gradual;
5. Changes in vertical sensor elevation shift the average distribution value;
6. Noise is negligiblewith respect to gridlinedips.
Differential Filtering
In order to counteract vertical biases in the light sensor value distributions, the best choice is a differential
filter. For the controlling software, a first-order differential filter appears to successfully detect most
gridlines.The filter can be defined as follows:
∆[ 𝑛] = 𝑥[ 𝑛] − 𝛼 𝑥[ 𝑛 − 1]
where 𝑛 ∈ ℕ is the sample number, 𝑥[ 𝑛] is the raw value of the 𝑛-th light sensor sample, ∆[ 𝑛] is the
differentially filtered valuefor sample 𝑛 and 𝛼 = 1 in this case.The resultingdistribution isshown below:
Figure 4: First-Order Numerical Derivative of Raw Light Sensor Values (from the distribution above.)
It is clear from the distributions in Figure 4 that a differential filter effectively does away with constant
biases, as is to be expected. Additionally, their shape further corroborates the overall insignificance of
noise (though not entirely as seen at the very beginning of the graph.) Therefore, the average offset
factors introduced by points 1, 3, 5 and 6 above are effectively eliminated.
However, points 2 and 4 are indicative of a remaining piece of the puzzle. That is, given the dis tributions
shown here, a value must be found such that a meaning can be ascribed to the spikes. First, it is not
functionally necessary to distinguish between floor-to-line and line-to-floor crossings (i.e. average-to-peak
and peak-to-average, respectively.) Therefore, the only magnitude in question is the absolute value of the
numerical derivative1. Second, point 4 implies that an overall minimum for gridline detection ought to be
1 A more sophisticated line detection technique could make use of this information to eliminate potential false
positives. That is, two negative peaks in succession, say, could be considered as a false positive. However, other
-200
-150
-100
-50
0
50
100
150
200
1
5
9
13
17
21
25
29
33
37
41
45
49
53
57
61
65
69
73
77
81
85
89
93
97
101
105
109
113
117
121
125
129
133
First-OrderRawValueDerivative
Sample Number
Left Sensor Center Sensor Right Sensor
13. SYSTEM DOCUMENT 13
found. That is, given a differential distribution, any value above such a mi nimum could be considered to
be a sample above a gridline. Lastly, point 2 suggests that such gridline thresholds are unique to each
sensor, as it is clear from the figure above. As such, testing has been performed to determine these
thresholds;see companion tests for reference.
Implementation
Considering the points brought forward by the preceding discussion, gridline detection in the controlling
software is performed in the following way. First, three independent threads are launched that poll each
light sensor respectively every 5ms. These threads push the raw light values into a circular buffer. Then,
on every possible occasion, the buffers are pulled, locked and the differential filter described above is
applied to each one. Each filter instance is given a reference threshold, as found during testing, which it
uses to determine which samples correspond to gridlines. The filters then return a list of indexes into the
buffer, pointingto those samples.Whathappens next depends on what the information is used for.
Notes: The size of the circular buffers and the time between successive checks depend on the use case.
Also, because the buffers are locked for processing, the polling threads are stalled in the meantime. Since
buffer sizes are relatively small and computing numerical derivatives is an 𝒪( 𝑛) operation, this does not
appear to be a problem. Another way to accomplish processing with a possibly shorter locking time is to
copy itfirst;the leJOS API provides a fast, firmware-level method to do this.
8.1.5 Odometer Correction
The model used in the odometer to calculate the position of the robot is based on perfect physical
mechanisms. However, no part of the robot behaves ideally. Therefore, the values provided by the
odometer accrue errors as the robot moves. It is thus necessary to implement a correction system that to
cancel these errors before they grow too largefor the odometer to be of use.
To this end,
9 TOOLS
9.1 SOFTWARETOOLS
Eclipseand lejOS for development;
LDD: for robot modelingand building;
git: for code control and GitHub for storage;
MicrosoftPowerPoint: for weekly meetings with the client;
DropBox: for filesharingamongteam members and the client.
9.2 HARDWARETOOLS
Motors: electrically powered mechanisms that rotate at a desired speed by a chosen angle. In
our design, two motors will be attached to wheels and will be used to make the robot move and
one will be used for the launching mechanism. The motors are fairly accurate and are essential
for to the robot design.
Light Sensor: a mechanical device that is sensitive to light by detection of light frequencies. Its
purpose is to correct the robots odometer and orientation (for localization) by detecting grid
lines. Three light sensors will be used in our design, one directly behind each wheel in order to
ensure a more accurate correction in the robots orientation and odometer and one in the back
problems could potentially be introduced by this idea, especially when working with limiting forward speeds and
therefore few samples per line.
14. SYSTEM DOCUMENT 14
center for localization. Issues arise with the sensors when detecting the gridlines under various
ambient lightingconditions.This can bedealt with usingdifferential filters.
Ultrasonic Sensor: sends out ultrasonic signals and detects the return of these signals when they
bounce off an object. The sensor measures the time it took for the signal to return and thus
produces a reading. It frequently produces both false negatives and false positives and is thus
very inconsistent. In addition, its detection range is limited and cannot detect objects that are
closer than 5cm. One ultrasonic sensor will be used in the front of the robot. It will be used for
localization.
Touch Sensor: detects and object if it touches it. This sensor is available for use, however its use
is not necessary to complete the task and will therefore not be used in our design.
10 GLOSSARY OF TERMS
LabVIEW: Visual programminglanguagefrom National Instruments;
leJOS: Firmware for Lego Mindstormbricks;
LDD: Lego Digital Designer;
False-Negatives: Failureof the ultrasonicsensor to detect objects;
False-Positives: Detection of the ultrasonic sensor of non-existentobjects;
Flash: Persistentstorage;
Eclipse: Modular integrated development environment.