ZION Equity Research Report
•
1 like•230 views

Equity Research Report for Student Investment Management Fund

Recommended
Recommended
More Related Content
What's hot
What's hot (20)
Similar to ZION Equity Research Report
Similar to ZION Equity Research Report (20)
More from Yexin (Olivia) Wan
Recently uploaded
Recently uploaded (20)
ZION Equity Research Report
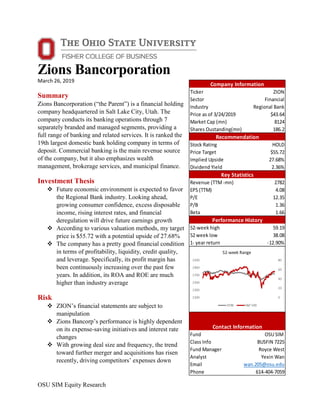
- 1. OSU SIM Equity Research Zions Bancorporation March 26, 2019 Summary Zions Bancorporation (“the Parent”) is a financial holding company headquartered in Salt Lake City, Utah. The company conducts its banking operations through 7 separately branded and managed segments, providing a full range of banking and related services. It is ranked the 19th largest domestic bank holding company in terms of deposit. Commercial banking is the main revenue source of the company, but it also emphasizes wealth management, brokerage services, and municipal finance. Investment Thesis Future economic environment is expected to favor the Regional Bank industry. Looking ahead, growing consumer confidence, excess disposable income, rising interest rates, and financial deregulation will drive future earnings growth According to various valuation methods, my target price is $55.72 with a potential upside of 27.68% The company has a pretty good financial condition in terms of profitability, liquidity, credit quality, and leverage. Specifically, its profit margin has been continuously increasing over the past few years. In addition, its ROA and ROE are much higher than industry average Risk ZION’s financial statements are subject to manipulation Zions Bancorp’s performance is highly dependent on its expense-saving initiatives and interest rate changes With growing deal size and frequency, the trend toward further merger and acquisitions has risen recently, driving competitors’ expenses down Ticker ZION Sector Financial Industry Regional Bank Price as of 3/24/2019 $43.64 Market Cap (mn) 8124 Shares Oustanding(mn) 186.2 Stock Rating HOLD Price Target $55.72 Implied Upside 27.68% Dividend Yield 2.36% Revenue (TTM-mn) 2782 EPS (TTM) 4.08 P/E 12.35 P/B 1.36 Beta 1.66 52-week high 59.19 52 week low 38.08 1- year return -12.90% Fund OSU SIM Class Info BUSFIN 7225 Fund Manager Royce West Analyst Yexin Wan Email wan.205@osu.edu Phone 614-404-7059 Company Information Recommendation Key Statistics Performance History Contact Information
- 2. Zions Bancorporation March 26, 2019 OSU SIM Equity Research 1 COMPANY OVERVIEW............................................................................................................ 2 Business Segments...................................................................................................................... 2 Competitive Advantages ............................................................................................................. 3 Recent Stock News...................................................................................................................... 4 INVESTMENT THESIS .............................................................................................................. 4 Economics Outlook..................................................................................................................... 4 Industry Analysis......................................................................................................................... 5 Fundamental Drivers................................................................................................................... 5 Pro-Forma Analysis..................................................................................................................... 6 Financial Analysis....................................................................................................................... 7 VALUATION AND PRICE TARGET..................................................................................... 12 Relative Valuation..................................................................................................................... 12 DCFE Model ............................................................................................................................. 13 Dividend Discount Model......................................................................................................... 15 Price Target ............................................................................................................................... 17 RISK AND CONCERN.............................................................................................................. 18 Accounting Quality................................................................................................................... 18 Interest Rate............................................................................................................................... 19 CONCLUSION ........................................................................................................................... 19 REFERENCES............................................................................................................................ 20
- 3. Zions Bancorporation March 26, 2019 OSU SIM Equity Research 2 COMPANY OVERVIEW Zions Bancorporation (“the Parent”) is a financial holding company headquartered in Salt Lake City, Utah. With 433 branches in total at the end of year 2017, the parent operates and owns a commercial bank primarily in Arizona, California, Colorado, Idaho, Nevada, New Mexico, Oregon, Texas, Utah, Washington, and Wyoming. The company conducts its banking operations through 7 separately branded and managed segments, providing a full range of banking and related services. It is included in S&P 500 and NASDAQ Financial 100 indices and ranked the 19th largest domestic bank holding company in terms of deposit. Commercial banking is the main revenue source of the company, but it also emphasizes wealth management, brokerage services, and municipal finance. Business Segments Geographic Presence Figure 1: 2017 Segment Information Source: Zions Bancorp 10-K, Zions Bancorp Company Website Revenue Breakdown Of Zions Bancorporation’s $2736 million revenue in 2017, 80% comes from interest income and 20% comes from non-interest income. Zions Bancorporation’s interest income is highly affected by short-term interest rate and can be broken down into 3 categories: Interest and fees on loans accounts for 84% of interest income. It is expected to grow due to increase in consumer and commercial loans. Interest on securities accounts for 14.87% of interest income. This is the interest typically paid by some fixed-interest securities. A fixed-interest security1 is pretty similar to bond. In exchange for fixed interest payments, Zions loans money to companies. The company also returns the face value of the security when it matures. Interest on money market investments accounts for only accounts for 0.87% of interest income. Money market investment2 is a kind of mutual fund that only invest in extremely liquid and high-credit-rating cash equivalent securities. Zions invests in money market fund to provide themselves with liquidity. This is a common strategy when dealing with excess cash on hand. Figure 2: 2017 Interest Income Breakdown Source: Zions Bancorp 10-K Zions Bank Amegy CB&T NBAZ NSB Vectra TCBW Headquarter Utah Texas California Arizona Nevada Colorado Washington Key Financial Information Total average loans 12,481.00 11,021.00 9,539.00 4,267.00 2,357.00 2,644.00 926.00 % of Total 29% 25% 22% 10% 5% 6% 2% Total average deposits 15,986.00 11,096.00 11,030.00 4,762.00 4,254.00 2,756.00 1,107.00 % of Total 31% 22% 22% 9% 8% 5% 2% Income before income taxes 346.00 240.00 257.00 106.00 46.00 49.00 29.00 % of Total 32% 22% 24% 10% 4% 5% 3% 2017 Segment Information (Dollar amounts in millions) (in millions) Amount Percentage Interest and fees on loans 1847.00 84.26% Interest on money market investments 19.00 0.87% Interest on securities 326.00 14.87% Total interest income 2192.00 100.00%
- 4. Zions Bancorporation March 26, 2019 OSU SIM Equity Research 3 There are 2 main parts within Zions Bancorporation’s non-interest income. Service charges and fees on deposit accounts accounted for 31% while other service charges, commissions and fees accounted for 40%. In addition to the company’s performance in fiscal year 2017, total non-interest income for the latest quarter rose by $1 million, or 1% because of a $3 million increase in other service charges, commissions and fees. Other service charges, commissions and fees increased due to customer interest rate swap management fees and higher loan commitment fees. 3 Figure 3: 2017 Non-Interest Income Breakdown Source: Zions Bancorp 10-K Competitive Advantages Efficiency Initiatives Zions Bancorporation takes the initiative to make the company more efficient. In 2017, they successfully lower their efficiency ratio to 62.3% from 65.8%, maintain adjusted noninterest expense growth rate at 2-3%, boost return on tangible common equity to 9%, reach cumulative gross pre-tax saving of 120 million. Community Bank Model Zions Bancorporation differentiated itself by being commercial focused skewing towards mid and small sized business. They emphasizes that doing business on a local basis continues to be their area of focus. Great Reputation As researched by the Greenwich Associates annual survey, Zions Bancorp is consistently ranked among the best banks to work with by its clients in the country. Only 3 other U.S. banks have been awarded as many Greenwich Excellence Awards as Zions Bancorp. “Best bank within the Geography” has been awarded consistently to Zions Bancorp over the past few years, given by local newspapers, business journals, and similar publications in other states. (in millions) Amount Percentage Service charges and fees on deposit accounts 171.00 31% Other service charges, commissions and fees 217.00 40% Wealth management and trust income 42.00 8% Loan sales and servicing income 25.00 5% Capital markets and foreign exchange 30.00 6% Dividends and other investment income 40.00 7% Securities gains (losses), net 14.00 3% Other 5.00 1% Total noninterest income 544.00 100%
- 5. Zions Bancorporation March 26, 2019 OSU SIM Equity Research 4 Recent Stock News Dodd-Frank Rollback Fed tweaks to capital requirements will lead to a 2.5% decrease in required liquid assets for the 16 Fed-supervised banks and a 0.6% decrease in capital. The Fed is in the process implementing Dodd-Frank reform bill signed into law earlier this year. Firms with $250-$700 billion in assets may be able to add back roughly 50 bps of risk-adjusted capital by quit including unrealized gains and losses in comprehensive income. 4 BB&T and SunTrust Merger The BB&T and SunTrust merger is expected to generate 1.6 billion of expense synergies by 2022. SunTrust and BB&T have overlapping branch footprints in Southeast and Mid-Atlantic. The combined entity will be able to realize cost saving since about a quarter of their branches are within two miles of each other. This would boost profitability above industry leaders like U.S. Bancorp by pushing the combined entity’s cost ratio to the lowest of peers. 5 INVESTMENT THESIS Economics Outlook Looking ahead, growing consumer confidence, excess disposable income, rising interest rates, and financial deregulation will drive future earnings growth. There are negative views on global economy. IMF lowers 2019 global growth forecast, which is in particular pulled down by China’s growth slowdown and poor economic performance of Europe.6 Nevertheless, the Regional Bank industry is highly correlated with local economic conditions within the United States while the domestic economy is expected to grow steadily. Part of the Fed’s current monetary policy objective is to offer full-time employment opportunities with marginal increase in unemployment rate due to workers returning to the labor force. Workers returning to the workforce will lead to escalating competition, driving wages up. As a consequence, per capita disposable income is expected to increase. Consumer’s confidence in their long-term financial stability increases along with rising disposable income level. Having excess disposable income enables consumers to have faith in making periodic interest payment. Businesses are also going to benefit from this trend. Growing household debt and consumer confidence make consumers look for wider variety of products and services, which will lead businesses to regional banks for financing new projects.7 Marginal reduction in bank regulation favoring small banks is most likely to happen in the near future, which will make credit access much easier for individual and business. Key parts like capital requirements, the ‘Durdin Amendment’ that decreases consumer debit card transaction fees, and consumer lending compliance burdens are likely to be reviewed. Restructuring key financial regulatory provision aims at reducing small banks burden, so as to keep strict regulatory oversight over systemically crucial institutions while at the same time loosen the lending standards.8
- 6. Zions Bancorporation March 26, 2019 OSU SIM Equity Research 5 Industry Analysis The Regional Bank industry is considered to be in the mature phase of its industry life cycle.9 Indicators like consumer complete acceptance, profitability recovery, consolidation, and slow growth in industry participation signal that the Regional Bank industry is in the mature state of its industry life cycle. Over the past five years, Regional Banks have benefited from macroeconomic growth due to increasing consumer confidence. Consumers raised their debt levels as they became more confident in their own long-term financial stability. As a result, economic activity increased, which allowed the Federal Reserve to higher the Federal Fund Rate eight times from its recessionary lows. As the FFR has increased, so has the interest rates in general. Regional Bank then lent out money to consumers at higher interest rates, thereby increasing overall industry revenue at an annualized rate of 7.4%. In the next five years, the Regional Banks industry is expected to benefit from the same economic factors that previously led to growth. The Federal Fund Rate is expected to increase over the five years to 2023, which will lead interest rates on mortgages and other debt products offered by regional banks increase. Therefore, industry revenue is expected to rise at an annualized rate of 2.9% over the next 5 years. Industry value added (IVA), measuring the contribution to the economy as a whole, is expected to increase at an annualized rate of 4.8%.10 With growing deal size and frequency, the trend toward further merger and acquisitions has risen recently, driving expenses down.11 Regulatory costs pressure banks to merge. Additionally, as banks are given more flexibility to arrange capital, M&A activity may be an alluring option in addition to shareholder returns. Fundamental Drivers Interest Rate Following the policy trend of quantitative tightening, the Fed raised the interest rate on Dec. 19. Expecting one more hikes in 2019, the financial services industry is anticipating a great future looking forward. Prime Rate. The prime rate, the interest rate charged by banks to their most credit worthy and largest corporate customers, is expected to increase along with the federal funds rate. This will have a positive impact on Regional Bank net interest margin and spread. 30-Year Conventional Mortgage Rate. Mortgages is one of the core products that Regional Bank industry offers. The Regional Bank industry will generate more interest income by extending customers mortgages with higher interest rates. The 30-year conventional mortgage rate is expected to increase. Aggregate Household Debt The total amount of debt that consumers hold in the United States is aggregate household debt, which includes various forms. Student loans, mortgages, credit card debt are typical form of
- 7. Zions Bancorporation March 26, 2019 OSU SIM Equity Research 6 aggregate household debt. Consumers tend to increase the amount of debt financing as they become more confident in their own finances and the economy. In 2019, aggregate household debt is expected to increase, driven by increasing consumer confidence. As I mentioned earlier in the economic analysis section, growing household debt and consumer confidence make consumers look for wider variety of products and services, leading businesses to regional banks for financing new projects. As the result, corporate debt level will also increase. Interest-Earning Asset Another critical driver is growth rates of interest earning asset, particularly loan growth. Since 2010, loan has been growing steadily, especially commercial and industrial (C&I) lending. Even though C&I lending is growing slower due to aging economy recovery and decreasing energy- related lending, overall loan growth is still positive. Credit Quality Nonperforming loans and allowances for loan losses peak around 2010. In the absence of strong asset growth and rising loan yields, loan credit quality improvements have been a primary driver of NII growth over the past 6 years. Deposit costs are also a critical driver of net interest spread and therefore NII. The Federal Reserve has been steadily raising Federal Fund Rate, causing interest rate on deposit increase as well.12 As banks compete for deposit and the Fed continues to raise rates, I expect this up-going trend to continue. Pro-Forma Analysis Net Interest Income Net interest income (NII) is the revenue generated from bank’s assets minus its expenses incurred from liability. NII is driven by credit quality of those assets, growth rates of interest earning assets, and net interest spread. Slightly higher than 4.2% in 2016, interest-earning asset grew 4.5% in 2017. Net interest margin (NIM) is the NII divided by average interest-earning asset. I expect that NII will continue to grow. Based on management guidance, I expect low-to- mid single digit interest-earning asset growth and loan growth. I also expect a gradually improving net interest margin. Noninterest Income Noninterest income consists of mergers and acquisitions (M&As), deposit service charges, credit/debit cards, loan fees, mortgage banking, etc. In 2016, total noninterest income increased by 2% from $168 million to $171 million. In 2017, this line item stays at the same level compared to year 2016.13 Following similar pattern, 4th quarter of 2018’s total noninterest income increased by 1% compared to the 4th quarter of 2017. 14 In general, I expect capital market income, mainly driven by M&A activities, to higher noninterest income. In terms of projection, I use the following approaches: Year-over-year growth. I project wealth management and trust income, capital markets and foreign exchange, dividends and other investment income, and other noninterest income based on its YoY growth rate. Specifically, I straight-line (0% growth rate) capital markets and foreign exchange and dividends and other investment income
- 8. Zions Bancorporation March 26, 2019 OSU SIM Equity Research 7 because it is extremely difficult to predict in nature. For the other two line items, I used the latest historical growth rate, 1%. As % of deposit. I project service charges and fees on deposit and other service charges, commissions and fees as a percentage of deposit. As % of gross loan. I project loan sales and servicing income as a percentage of gross loan. As % of net interest income. I project securities gains (losses), net as a percentage of net interest income. Provision for Loan Losses I project this line item to move in line with net interest income. The expense set aside as an allowance for loan payments and uncollected loans is called loan loss provision. It is used to cover several factors related to potential loan losses like customer defaults, bad loans and renegotiated terms that incur lower payments.15 Management evaluates provisions based on future charge-offs expectations and existing reserve amount. The expected company’s specific loan portfolio performance drives off these estimates within the context of past experience as well as larger macroeconomic factors. Compared with prior period, asset quality has been continuously improving for the entire loan portfolio partially due to improvement in the gas- related and oil industry. Improved credit quality results in a decline in provision for credit losses, a quantitative portion of the allowance for loan losses. Therefore, I expect a gradually decreasing provision for loan losses starting as 5% of net interest income. Income Tax Rate The Tax Reform Act of 2017 permanently reduces the US corporate income tax rate from a maximum of 35% to a flat 21%. Since the act went into effects on January 1st , 2018, I used 21% as the estimated tax rate for our model. Financial Analysis Key Financial Ratios Figure 4: Financial Ratios Yield on interest-earning assets (YEA). YEA is interest income on interest-earning assets divided by average interest-earning assets. YEA in Q4 2018 increased 48 bps, compared to 3.69% in Q4 2017. The company’s YEA is substantially lower than industry Latest Industry Average 2008 2009 2010 2011 2012 2013 2014 2015 2016 2017 2018 Ratios Yield on interest- earning assets (YEA) 4.06% 4.23% 6.29% 5.21% 4.96% 4.68% 4.20% 3.84% 3.59% 3.40% 3.52% 3.66% 4.01% Cost of funding on interest-earning assets (COF) 0.54% 0.62% 2.1% 1.3% 1.3% 1.0% 0.7% 0.5% 0.4% 0.2% 0.2% 0.2% 0.4% Net Interest Spread 0.04 0.04 3.68 3.52 3.08 3.21 3.16 3.02 2.99 2.99 3.23 3.27 3.28 Net Interest Margin 3.67% 3.68% 4.18% 3.94% 3.70% 3.77% 3.57% 3.36% 3.26% 3.19% 3.37% 3.45% 3.61% ROA 1.31% 0.80% -0.50% -2.30% -0.58% 0.62% 0.64% 0.47% 0.70% 0.53% 0.76% 0.91% 1.31% ROE 11.67% 8.30% -4.58% -19.96% -4.80% 4.73% 5.34% 4.21% 5.76% 4.15% 6.19% 7.73% 11.59% Efficiency Ratio 58.52% 60.79% - - - - - - - 70.40% 65.80% 62.30% 59.60%
- 9. Zions Bancorporation March 26, 2019 OSU SIM Equity Research 8 average. This may indicates that the bank’s current portfolio has some problem loans or the bank has been too conservative in lending. Cost of funding (COF). COF, the cost of getting deposits and other borrowed money, is the ratio of the expense on the funds a bank uses in support of earning assets and the average corresponding fund level. Zions Bancorp’s COF is substantially lower than industry average, which means the companying is generating less cost from borrowed money compared to its industry peers. Net interest margin. The net interest margin (NIM) is dividing net interest income by average interest-earning assets. Zions Bancorp’s NIM is the same as industry average. Return on assets (ROA) and Return on equity (ROE). Zions Bancorp’s ROA and ROE are much higher than industry average, which means the company’s management is utilizing its asset and net asset to generate earnings much more efficiently than its peers. Efficiency ratio. Compared to industry average, Zions Bancorp’s efficiency ratio is much lower. This indicates that the company is doing a great job managing expense- generating line items. DuPont Analysis Figure 5: DuPont Analysis Source: Bloomberg FA Function Figure 5 illustrates the 5-factor DuPont analysis on Zions Bancorp’s 2018 financial data. It is worth mentioning that in the context of analyzing banks, revenue should be the sum of net interest income and non-interest income while operating income is revenue minus non-interest expense. Financial leverage. Prior to 2015, the company’s financial leverage was decreasing. After 2015, it has been steadily increasing. This means the company is borrowing more money compared to the size of equity after 2015. Asset turnover. The company’s asset turnover has been pretty stable, remaining at 0.04 level over the past 5 years. This indicates that the company has been carefully managing the ratio between revenue and asset.
- 10. Zions Bancorporation March 26, 2019 OSU SIM Equity Research 9 Profit margin. Overall, the company’s profit margin has been consistently increasing over the past 5 years, moving from 20% to 40%. I believe that this is the most important factor driving up the company’s ROE these year. One of the most important reasons for this drastically increasing profit margin is the improvement in efficiency ratio. Interest burden. Operating income equals pre-tax income because operating income is revenue minus non-interest expense and revenue is the sum of net interest income and non-interest income, both of which have deducted interest expense. Since operating income equals pre-tax income, it should not have any interest burden. Tax burden. Tax burden has declined since the change in corporate tax rate from 35% to 21%. Figure 6: Pro-Forma Income Statement Source: 10-K, analyst’s estimate Pro-Forma Financial Statements for Zions Bancorporation (In millions, except per share amounts) Income Statement 2014 2015 2016 2017 2018 2019E 2020E 2021E Total interest income 1853.00 1833.00 1954.00 2192.00 2482.00 2948.18 3440.19 4014.31 Total interest expense 173.00 118.00 87.00 127.00 251.00 590.88 854.37 1166.61 Net interest income 1680.00 1715.00 1867.00 2065.00 2231.00 2357.30 2585.83 2847.71 Provision for loan losses (98.08) 40.00 93.00 24.00 (39.00) 117.87 129.29 142.39 Net interest income after provision for loan losses 1778.09 1675.00 1774.00 2041.00 2270.00 2239.44 2456.54 2705.32 Noninterest income: Service charges and fees on deposit accounts 168.29 168.00 171.00 171.00 167.00 176.59 183.04 189.73 Other service charges, commissions and fees 193.98 187.00 208.00 217.00 228.00 227.86 236.18 244.81 Wealth management and trust income 30.57 31.00 37.00 42.00 51.00 58.10 68.01 79.22 Loan sales and servicing income 29.15 31.00 35.00 25.00 24.00 48.42 50.19 52.02 Capital markets and foreign exchange 22.58 26.00 22.00 30.00 31.00 31.00 31.00 31.00 Dividends and other investment income 43.66 30.00 24.00 40.00 43.00 43.00 43.00 43.00 Securities gains (losses), net 13.47 (127.00) 7.00 14.00 2.00 2.36 2.59 2.85 Other 6.92 11.00 12.00 5.00 6.00 6.45 6.10 5.54 Total noninterest income 508.63 357.00 516.00 544.00 552.00 593.78 620.10 648.17 Noninterest expense: Salaries and employee benefits 956.41 973.00 983.00 1011.00 1069.00 1107.93 1215.34 1338.42 Occupancy, net 115.70 120.00 125.00 129.00 131.00 117.87 129.29 142.39 Furniture, equipment and software, net 115.31 123.00 125.00 130.00 126.00 127.29 139.63 153.78 Other real estate expense, net (1.25) (1.00) (2.00) (1.00) 1.00 (1.15) (1.13) (1.16) Credit-related expense 28.13 29.00 26.00 29.00 25.00 23.57 25.86 28.48 Provision for unfunded lending commitments (8.63) (6.00) (10.00) (7.00) (1.00) 0.00 0.00 0.00 Professional and legal services 66.01 50.00 55.00 54.00 53.00 49.50 54.30 59.80 Advertising 25.10 25.00 22.00 22.00 26.00 23.57 25.86 28.48 FDIC premiums 32.17 34.00 40.00 53.00 51.00 49.50 54.30 59.80 Amortization of core deposit and other intangibles 10.92 9.00 8.00 6.00 0.00 0.00 0.00 0.00 Other 325.41 225.00 213.00 223.00 198.00 200.37 219.80 242.06 Total noninterest expense 1665.29 1581.00 1585.00 1649.00 1679.00 1698.47 1863.25 2052.04 Income before income taxes 621.42 451.00 705.00 936.00 1143.00 1134.75 1213.39 1301.45 Income taxes 222.96 142.00 236.00 344.00 259.00 238.30 254.81 273.30 Net income 398.46 309.00 469.00 592.00 884.00 896.45 958.57 1028.14 Consensus - GAAP 834.53 844.40 865.00 Preferred stock dividends (71.89) (62.00) (48.00) (40.00) (34.00) (51.18) (47.04) (44.04) Preferred stock redemption 0.00 0.00 (10.00) (2.00) 0.00 0.00 0.00 0.00 Net earnings applicable to common shareholders 326.57 247.00 411.00 550.00 850.00 845.27 911.54 984.10 Weighted average common shares outstanding during the year: Basic shares 192.21 203.27 203.86 200.78 193.59 193.59 193.59 193.59 Diluted shares 192.79 203.70 204.27 209.65 206.50 206.50 206.50 206.50 Net earnings per common share: Basic 1.68 1.20 2.00 2.71 4.36 4.37 4.71 5.08 Diluted 1.68 1.20 1.99 2.60 4.08 4.09 4.41 4.77 Consensus - GAAP 4.43 4.79 5.46
- 11. Zions Bancorporation March 26, 2019 OSU SIM Equity Research 10 Figure 7: Pro-Forma Income Statement Drivers Source: 10-K, analyst’s estimate Revenue Drivers Net Interest Income (NII) Interest earning asset yield (IEA yield) 3.59% 3.40% 3.52% 3.66% 4.15% 4.71% 5.34% 6.05% Interest bearing liability cost (IBL cost) 0.71% 0.50% 0.46% 0.50% 1.00% 1.56% 2.19% 2.90% Net interest spread (IEA yield - IBL cost) 2.88% 2.90% 3.06% 3.16% 3.15% 3.15% 3.15% 3.15% Average interest earning asset 52007.00 54374.00 56170.00 60874.00 60874.00 62639.35 64455.89 66325.11 YoY Growth 5% 3% 8% 0% 2.90% 2.90% 2.90% Average interest bearing liability 28736.50 29331.60 30547.70 30152.00 36890.00 37959.81 39060.64 40193.40 YoY Growth 2% 4% -1% 22% 2.90% 2.90% 2.90% Net interest income (NII) calculation Total interest income 1853.00 1833.00 1954.00 2192.00 2482.00 2948.18 3440.19 4014.31 Total interest expense 173.00 118.00 87.00 127.00 251.00 590.88 854.37 1166.61 Net Interest Income (NII) 1680.00 1715.00 1867.00 2065.00 2231.00 2357.30 2585.83 2847.71 Net Interest Margin (NIM) 3.23% 3.15% 3.32% 3.39% 3.66% 3.76% 4.01% 4.29% Provision for loan losses (98.08) 40.00 93.00 24.00 (39.00) 117.87 129.29 142.39 as % of NII -5.8% 2.3% 5.0% 1.2% -1.7% 5.0% 5.0% 5.0% Noninterest Income YoY Growth Wealth management and trust income 1.4% 19.4% 13.5% 21.4% 13.9% 17.1% 16.5% Capital markets and foreign exchange 15.1% -15.4% 36.4% 3.3% 0.0% 0.0% 0.0% Dividends and other investment income -31.3% -20.0% 66.7% 7.5% 0.0% 0.0% 0.0% Other 59.1% 9.1% -58.3% 20.0% 7.5% -5.4% -9.1% Service charges and fees on deposit 168.29 168.00 171.00 171.00 167.00 176.59 183.04 189.73 deposit 47848 50374 53236 52621 54101 56965 59046 61202 as a % of deposits 0.4% 0.3% 0.3% 0.3% 0.3% 0.3% 0.3% 0.3% Other service charges, commissions and fees 193.98 187.00 208.00 217.00 228.00 227.86 236.18 244.81 as a % of deposits 0.4% 0.4% 0.4% 0.4% 0.4% 0.4% 0.4% 0.4% Loan sales and servicing income 29.15 31.00 35.00 25.00 24.00 48.42 50.19 52.02 gross loan 40063.66 40649.54 42649.00 44780.00 46714.00 48420.25 50188.82 52021.99 as a % of gross loan 0.1% 0.1% 0.1% 0.1% 0.1% 0.1% 0.1% 0.1% Securities gains (losses), net 13.47 -127.00 7.00 14.00 2.00 2.36 2.59 2.85 as a % of NII 0.8% -7.4% 0.4% 0.7% 0.1% 0.1% 0.1% 0.1% Non-Interest Expense as % of Net Interest Income Salaries and employee benefits 56.9% 56.7% 52.7% 49.0% 47.9% 47.0% 47.0% 47.0% Occupancy, net 6.9% 7.0% 6.7% 6.2% 5.9% 5.0% 5.0% 5.0% Furniture, equipment and software, net 6.9% 7.2% 6.7% 6.3% 5.6% 5.4% 5.4% 5.4% Other real estate expense, net -0.1% -0.1% -0.1% 0.0% 0.0% 0.0% 0.0% 0.0% Credit-related expense 1.7% 1.7% 1.4% 1.4% 1.1% 1.0% 1.0% 1.0% Provision for unfunded lending commitments -0.5% -0.3% -0.5% -0.3% 0.0% 0.0% 0.0% 0.0% Professional and legal services 3.9% 2.9% 2.9% 2.6% 2.4% 2.1% 2.1% 2.1% Advertising 1.5% 1.5% 1.2% 1.1% 1.2% 1.0% 1.0% 1.0% FDIC premiums 1.9% 2.0% 2.1% 2.6% 2.3% 2.1% 2.1% 2.1% Amortization of core deposit and other intangibles 0.7% 0.5% 0.4% 0.3% 0.0% 0.0% 0.0% 0.0% Other 19.4% 13.1% 11.4% 10.8% 8.9% 8.5% 8.5% 8.5% Effective Tax Rate 35.9% 31.5% 33.5% 36.8% 22.7% 21.0% 21.0% 21.0%
- 12. Zions Bancorporation March 26, 2019 OSU SIM Equity Research 11 Figure 8: Pro-Forma Balance Sheet Source: 10-K, analyst’s estimate BALANCE SHEET (In millions, except per share amounts) ASSETS 2013 2014 2015 2016 2017 2018 2019E 2020E 2021E Cash and due from banks 1175 842 798 737 548 614 570 590 612 Money market investments: Interest-bearing deposits 8175.048 7178.097 6108.124 1411 782 619 10619 10619 10619 Federal funds sold and security resell agreements 282.248 1386.291 619.758 568 514 1461 10081 8531 6948 Investment securities: Held-to-maturity, at amortized cost (approximate fair value $762 and $850) 589 647 546 868 770 774 813 853 896 Available-for-sale, at fair value 3702 3844 7643 13372 15161 14737 15474 16248 17060 Trading account, at fair value 35 71 48 115 148 106 111 117 123 Total investment securities 4325 4562 8237 14355 16079 15617 16398 17218 18079 Loans held for sale 171 133 150 172 44 93 148 154 159 Loans and leases, net of unearned income and fees 39043 40064 40650 42649 44780 46714 48420 50189 52022 Less allowance for loan losses 746 605 606 567 518 495 484 502 520 Loans, net of allowance 38297 39459 40043 42082 44262 46219 47936 49687 51502 Other noninterest-bearing investments 856 866 848 884 1029 1046 1461 1478 1496 Premises, equipment and software, net 726 830 905 1020 1094 1124 1555 1573 1593 Goodwill and intangible 1051 1040 1030 1022 1016 1015 4061 4061 4061 Other real estate owned 46 19 7 4 4 4 18 18 18 Other assets 926 895 922 984 916 934 1414 1430 1448 Total assets 56031 57209 59670 63239 66288 68746 94261 95360 96535 LIABILITIES AND SHAREHOLDERS’ EQUITY Deposits 46362 47848 50374 53236 52621 54101 56965 59046 61202 Federal funds and other short-term borrowings 340 244 347 827 4976 5653 3653 2653 1653 Long-term debt 2274 1092 817 535 383 724 484 502 520 Reserve for unfunded lending commitments 90 81 75 65 58 57 224 224 224 Other liabilities 501 574 549 942 571 633 2539 2539 2539 Total liabilities 49567 49839 52162 55605 58609 61168 63865 64964 66139 Shareholders’ equity: Preferred stock, without par value 1004 1004 828 710 566 566 2264 2264 2264 Common stock, without par value 4179 4724 4767 4725 4445 3806 16435 16435 16435 Retained earnings 1474 1770 1967 2321 2807 3456 12890 12890 12890 Accumulated other comprehensive income (loss) (192) (128) (55) (122) (139) (250) (1193) (1193) (1193) Total shareholders’ equity 6465 7370 7508 7634 7679 7578 30396 30396 30396 Total liabilities and shareholders’ equity 56031 57209 59670 63239 66288 68746 94261 95360 96535 balance check 0 0 0 0 0 0 0 0 0 Main Drivers Cash and equivalents 1175 842 798 737 548 614 570 590 612 as % of deposits 3% 2% 2% 1% 1% 1% 1% 1% 1% Investment Securities 4325 4562 8237 14355 16079 15617 16398 17218 18079 % growth 5.5% 80.6% 74.3% 12.0% -2.9% 5.0% 5.0% 5.0% Gross loan 39043 40064 40650 42649 44780 46714 48420 50189 52022 % growth 2.6% 1.5% 4.9% 5.0% 4.3% 3.7% 3.7% 3.7% Loans held for sale 171 133 150 172 44 93 148 154 159 as % of gross loans 0.44% 0.33% 0.37% 0.40% 0.10% 0.20% 0.31% 0.31% 0.31% Allowance for loan losses 746 605 606 567 518 495 484 502 520 as % of gross loans 1.9% 1.5% 1.5% 1.3% 1.2% 1.1% 1% 1% 1% Deposits 46362 47848 50374 53236 52621 54101 56965 59046 61202 Ratio of gross loans / deposits 0.84 0.84 0.81 0.80 0.85 0.86 0.85 0.85 0.85 Long-term debt 2274 1092 817 535 383 724 484 502 520 as % of gross loans 5.8% 2.7% 2.0% 1.3% 0.9% 1.5% 1% 1% 1% % as Total Asset/Liability Other noninterest-bearing investments 1.53% 1.51% 1.42% 1.40% 1.55% 1.52% 1.55% 1.55% 1.55% Premises, equipment and software, net 1.30% 1.45% 1.52% 1.61% 1.65% 1.64% 1.65% 1.65% 1.65% Other assets 1.87% 1.82% 1.73% 1.62% 1.53% 1.48% 1.50% 1.50% 1.50% Pro-Forma Financial Statements for ZION
- 13. Zions Bancorporation March 26, 2019 OSU SIM Equity Research 12 VALUATION AND PRICE TARGET Relative Valuation Five peer companies were selected based on market capitalization, geographic presence, and business segment. They are Glacier Bancorp Inc. (GBCI), First Interstate BancSystem Inc. (FIBK), East West Bancorp (EWBC), TCF Financial Corp (TCF), and Western Alliance Bancorp (WAL). Figure 9: Relative Valuation Figure 10: Relative Valuation Sensitivity Analysis Name Ticker Market Cap (million) Dividend Yield P/E P/S P/B P/CF Glacier Bancorp Inc GBCI 3537.2 3.27% 18.80x 5.96x 2.33x 13.12x First Interstate BancSystem Inc FIBK 2382.6 3.09% 13.36x 3.46x 1.41x 8.92x East West Bancorp EWBC 7398.7 1.96% 11.03x 3.97x 1.57x 8.60x TCF Financial Corp TCF 3670.9 2.89% 12.80x 2.30x 1.55x 5.45x Western Alliance Bancorp WAL 4675.5 0.24% 10.78x 4.33x 1.79x 8.11x Average 4332.98 0.02 13.35x 4.00x 1.73x 8.84x Zions Bancorp ZION 9057.00 2.73 11.71x 3.08x 1.29x 8.30x (Source: Bloomberg) Absolute Valuation Current Multiple Target Multiple Target / Current Current Fundamentals Target Price Implied Upside from Current Share Price P/E 11.71x 13.35x 114% $4.08 $54.48 13% P/S 3.08x 4.00x 130% $14.36 $57.49 19% P/B 1.29x 1.73x 134% $37.39 $64.70 34% P/CF 8.30x 8.84x 107% $4.62 $40.84 -15% (Source: Bloomberg) $54.48 $3.93 $3.98 $4.03 $4.08 $4.13 $4.18 $4.23 12.15x $47.77 $48.37 $48.98 $49.59 $50.20 $50.80 $51.41 12.55x $49.34 $49.97 $50.59 $51.22 $51.85 $52.48 $53.10 12.95x $50.91 $51.56 $52.21 $52.85 $53.50 $54.15 $54.80 13.35x $52.48 $53.15 $53.82 $54.48 $55.15 $55.82 $56.49 13.75x $54.05 $54.74 $55.43 $56.12 $56.80 $57.49 $58.18 14.15x $55.63 $56.33 $57.04 $57.75 $58.46 $59.16 $59.87 14.55x $57.20 $57.93 $58.65 $59.38 $60.11 $60.84 $61.56 P/E Implied Share Price Sensitivity Analysis EPS $0.13 $3.93 $3.98 $4.03 $4.08 $4.13 $4.18 $4.23 12.15x -1% 0% 2% 3% 4% 5% 7% 12.55x 2% 4% 5% 6% 8% 9% 10% 12.95x 6% 7% 8% 10% 11% 12% 14% 13.35x 9% 10% 12% 13% 14% 16% 17% 13.75x 12% 14% 15% 16% 18% 19% 21% 14.15x 15% 17% 18% 20% 21% 23% 24% 14.55x 19% 20% 22% 23% 25% 26% 28% EPS P/E Implied Upside Sensitivity Analysis $57.49 $14.06 $14.16 $14.26 $14.36 $14.46 $14.56 $14.66 3.70x $52.08 $52.45 $52.82 $53.19 $53.56 $53.93 $54.30 3.80x $53.48 $53.86 $54.24 $54.62 $55.00 $55.38 $55.76 3.90x $54.89 $55.28 $55.67 $56.06 $56.45 $56.84 $57.23 4.00x $56.29 $56.69 $57.09 $57.49 $57.90 $58.30 $58.70 4.10x $57.70 $58.11 $58.52 $58.93 $59.34 $59.75 $60.16 4.20x $59.11 $59.53 $59.95 $60.37 $60.79 $61.21 $61.63 4.30x $60.51 $60.94 $61.37 $61.80 $62.23 $62.66 $63.09 P/S Implied Share Price Sensitivity Analysis Revenue $0.19 $14.06 $14.16 $14.26 $14.36 $14.46 $14.56 $14.66 3.70x 8% 9% 10% 10% 11% 12% 13% 3.80x 11% 12% 13% 13% 14% 15% 16% 3.90x 14% 15% 16% 16% 17% 18% 19% 4.00x 17% 18% 19% 19% 20% 21% 22% 4.10x 20% 21% 21% 22% 23% 24% 25% 4.20x 23% 24% 24% 25% 26% 27% 28% 4.30x 26% 27% 27% 28% 29% 30% 31% Revenue P/S Implied Upside Sensitivity Analysis
- 14. Zions Bancorporation March 26, 2019 OSU SIM Equity Research 13 Source: analyst’s estimate Limitation The strength of relative valuation is that it reflects current market values and recent transaction prices for comparable assets. However, no two banks are identical, you are always comparing apples with oranges. In addition, this valuation has a logical loophole and highly depends on which multiple or time frame is used. Therefore, I decided to assign less weight to this model. DCFE Model Doing an unlevered free cash flow model, commonly known as Discounted Cash Flow to the Firm method, is inappropriate for banks. Therefore, I use levered free cash model, commonly known as Discounted Cash Flow to Equity method, as one way to evaluate Zions Bancorp’s intrinsic value. Net Interest Margin As I have mentioned in the Pro-Forma Analysis section earlier, I expect the company’s net interest margin slightly increase before 2021 and stay constant at 4% level after that. Interest-Earning Asset I expect interest-earning asset to grow in line with industry revenue growth, which is 2.9%. Discount Rate I used the cost of equity derived from CAPM. Risk free rate is proxied by the current yield on a 10 year US treasury bond. For market risk premium, I compare the historical spreads between S&P 500 returns and the yield on 10-year Treasury bond. 𝑐𝑐𝑐𝑐𝑐𝑐𝑐𝑐 𝑜𝑜𝑜𝑜 𝑒𝑒𝑒𝑒𝑒𝑒𝑒𝑒𝑒𝑒𝑒𝑒 = 𝑟𝑟𝑟𝑟𝑟𝑟𝑟𝑟 𝑓𝑓𝑓𝑓𝑓𝑓𝑓𝑓 𝑟𝑟𝑟𝑟𝑟𝑟𝑟𝑟 + 𝑏𝑏𝑏𝑏𝑏𝑏𝑏𝑏 × 𝑚𝑚𝑚𝑚𝑚𝑚𝑚𝑚𝑚𝑚𝑚𝑚 𝑟𝑟𝑟𝑟𝑟𝑟𝑟𝑟 𝑝𝑝𝑝𝑝𝑝𝑝𝑝𝑝𝑝𝑝𝑝𝑝𝑝𝑝 = 2.7% + 1.66 × 4.82 = 10.7% $64.70 $37.09 $37.19 $37.29 $37.39 $37.49 $37.59 $37.69 1.43x $53.06 $53.20 $53.34 $53.49 $53.63 $53.77 $53.91 1.53x $56.77 $56.92 $57.07 $57.22 $57.38 $57.53 $57.68 1.63x $60.47 $60.64 $60.80 $60.96 $61.13 $61.29 $61.45 1.73x $64.18 $64.36 $64.53 $64.70 $64.88 $65.05 $65.22 1.83x $67.89 $68.08 $68.26 $68.44 $68.62 $68.81 $68.99 1.93x $71.60 $71.79 $71.99 $72.18 $72.37 $72.57 $72.76 2.03x $75.31 $75.51 $75.72 $75.92 $76.12 $76.33 $76.53 Implied Share Price Sensitivity Analysis Book Value P/B $0.34 $37.09 $37.19 $37.29 $37.39 $37.49 $37.59 $37.69 1.43x 10% 10% 11% 11% 11% 12% 12% 1.53x 18% 18% 18% 19% 19% 19% 20% 1.63x 26% 26% 26% 27% 27% 27% 28% 1.73x 33% 34% 34% 34% 35% 35% 35% 1.83x 41% 41% 42% 42% 42% 43% 43% 1.93x 49% 49% 49% 50% 50% 51% 51% 2.03x 56% 57% 57% 58% 58% 58% 59% P/B Implied Upside Sensitivity Analysis Book Value $40.84 $4.32 $4.42 $4.52 $4.62 $4.72 $4.82 $4.92 8.54x $36.90 $35.19 $34.33 $34.33 $35.19 $36.90 $39.46 8.64x $36.03 $34.36 $33.53 $33.53 $34.36 $36.03 $38.53 8.74x $35.60 $33.95 $33.13 $33.13 $33.95 $35.60 $38.07 8.84x $35.60 $33.95 $33.13 $33.13 $33.95 $35.60 $38.07 8.94x $36.03 $34.36 $33.53 $33.53 $34.36 $36.03 $38.53 9.04x $36.90 $35.19 $34.33 $34.33 $35.19 $36.90 $39.46 9.14x $38.19 $36.42 $35.54 $35.54 $36.42 $38.19 $40.84 Implied Share Price Sensitivity Analysis Cash Flow P/CF -$0.15 $4.32 $4.42 $4.52 $4.62 $4.72 $4.82 $4.92 8.54x -23% -22% -20% -18% -16% -15% -13% 8.64x -23% -21% -19% -17% -15% -14% -12% 8.74x -22% -20% -18% -16% -14% -13% -11% 8.84x -21% -19% -17% -15% -13% -12% -10% 8.94x -20% -18% -16% -14% -12% -11% -9% 9.04x -19% -17% -15% -13% -11% -10% -8% 9.14x -18% -16% -14% -12% -10% -9% -7% Implied Upside Sensitivity Analysis Cash Flow P/CF
- 15. Zions Bancorporation March 26, 2019 OSU SIM Equity Research 14 Terminal Growth Rate The maximum growth rate that a company can maintain without financing growth with additional debt or equity is sustainable growth rate (SGR). Since Zions Bancorp’s SGR is really high, I decided to use it as a guidance when setting scenarios for sensitivity analysis. Instead, I use the expected industry revenue growth rate 2.9% as terminal growth rate. 𝑆𝑆𝑆𝑆𝑆𝑆𝑆𝑆𝑆𝑆𝑆𝑆𝑆𝑆𝑆𝑆𝑆𝑆𝑆𝑆𝑆𝑆 𝑔𝑔𝑔𝑔𝑔𝑔𝑔𝑔𝑔𝑔ℎ 𝑟𝑟𝑟𝑟𝑟𝑟𝑟𝑟 = 𝑅𝑅𝑅𝑅𝑅𝑅𝑅𝑅𝑅𝑅𝑅𝑅 𝑜𝑜𝑜𝑜 𝐸𝐸𝐸𝐸𝐸𝐸𝐸𝐸𝐸𝐸𝐸𝐸 ∗ (1 − 𝐷𝐷𝐷𝐷𝐷𝐷𝐷𝐷𝐷𝐷𝐷𝐷𝐷𝐷𝐷𝐷 𝑃𝑃𝑃𝑃𝑃𝑃𝑃𝑃𝑃𝑃𝑃𝑃 𝑅𝑅𝑅𝑅𝑅𝑅𝑅𝑅𝑅𝑅) = 11.59% × (1 − 25.49%) = 8.64% Limitation Free Cash Flow to Equity method is preferable when the bank does not issue dividends. However, in this instance, Zions Bancorp does pay out dividend on a regular basis. In addition, this model is highly dependent on operating, cost of equity and terminal value assumptions.
- 16. Zions Bancorporation March 26, 2019 OSU SIM Equity Research 15 Figure 11: DCFE Model Dividend Discount Model When banks distribute large portions of their cash flows in dividends, DDM is generally preferred to DCFE because working capital and capital expenditures can be volatile and difficult to estimate. Discounted Cash Flow to Equity Model for Zions Bancorporation (In millions, except per share amounts) Analyst: Yexin Wan 10.70% 3/3/2019 2.9% Year 2019E 2020E 2021E 2022E 2023E 2024E 2025E 2026E 2027E 2028E Net Interest Income 2357.30 2585.83 2847.71 2729.94 2809.11 2890.57 2974.40 3060.66 3149.42 3240.75 Net Interest Margin(NIM) 3.76% 4.01% 4.29% 4.00% 4.00% 4.00% 4.00% 4.00% 4.00% 4.00% Interest-Earning Assets 62639.35 64455.89 66325.11 68248.54 70227.74 72264.35 74360.01 76516.45 78735.43 81018.76 YoY Growth 2.9% 2.9% 2.9% 2.9% 2.9% 2.9% 2.9% 2.9% 2.9% Provision for loan losses 117.87 126.71 136.69 128.31 129.22 130.08 130.87 131.61 132.28 132.87 as % of Net Interest Income 5.0% 4.9% 4.8% 4.7% 4.6% 4.5% 4.4% 4.3% 4.2% 4.1% Net interest income after provision for loan losses 2239.44 2459.12 2711.02 2601.63 2679.89 2760.50 2843.53 2929.05 3017.14 3107.88 Non-Interest Income 586.80 604.14 622.13 628.35 634.64 640.98 647.39 653.87 660.41 667.01 YoY% 3.0% 3.0% 1.0% 1.0% 1.0% 1.0% 1.0% 1.0% 1.0% Non-Interest Expense 1698.47 1863.25 2052.04 1965.56 2022.56 2081.21 2141.57 2203.67 2267.58 2333.34 % of Net Interest Income 72% 72% 72% 72% 72% 72% 72% 72% 72% 72% Income before income taxes 1127.77 1200.01 1281.11 1264.43 1291.97 1320.27 1349.35 1379.24 1409.97 1441.55 Income taxes 236.83 252.00 269.03 265.53 271.31 277.26 283.36 289.64 296.09 302.73 Effective Income Tax Rate 21% 21% 21% 21% 21% 21% 21% 21% 21% 21% Net Income 890.94 948.01 1012.08 998.90 1020.66 1043.01 1065.99 1089.60 1113.88 1138.82 Free Cash Flow 891 948 1,012 999 1,021 1,043 1,066 1,090 1,114 1,139 % Growth 6.4% 6.8% -1.3% 2.2% 2.2% 2.2% 2.2% 2.2% 2.2% NPV of Cash Flows 6035.05 53% Terminal Value 15023.73 NPV of terminal value 5436.28 47% Projected Equity Value 11471.33 100% Free Cash Yield 7.58% Free Cash Flow Yield 10.55% Terminal P/E 13.19 Current P/E 9.48 8.91 8.35 Projected P/E 12.88 12.10 11.33 Shares Outstanding 193.589 Current Price 43.64 Implied equity value/share 59.26 Upside/(Downside) to DCF 36% Debt 6434 Cash 19140.471 Cash/share 98.87 DCFE SENSITIVITY Share price sensitivity to discount rate (vertical) and terminal growth rate (horizontal) Terminal Growth Rate $59.26 (0.1%) 1.4% 2.9% 3.9% 4.9% 5.9% 11.7% $46.32 $49.00 $52.60 $55.76 $59.86 $65.37 11.2% $48.49 $51.55 $55.73 $59.46 $64.38 $71.16 10.7% $50.86 $54.38 $59.26 $63.70 $69.67 $78.14 10.2% $53.47 $57.54 $63.27 $68.60 $75.95 $86.72 9.7% $56.35 $61.07 $67.86 $74.35 $83.53 $97.55 Terminal Discount Rate = Terminal FCF Growth = Discount Rate
- 17. Zions Bancorporation March 26, 2019 OSU SIM Equity Research 16 Figure 12: DDM Model Dividend Discount Model for Zions Bancorporation (In millions, except per share amounts) Analyst: Yexin Wan DDM General Assumptions DDM model type 3 stage Valuation date 2/11/2019 Cost of equity 10.7% DDM - Maturity Phase Assumptions ROE 11.7% RWA growth 3.5% Capital ratio (Tier 1 capital / RWA) 10.0% DDM Buildup 2014 2015 2016 2017 2018 2019E 2020E 2021E 2022E 2023E 2024E Net income to common 327 247 411 550 850 708 826 902 1015 1108 1178 % growth -24% 66% 34% 55% -17% 17% 9% 13% 9% 6% Dividends 31 45 57 88 201 201 201 201 910 1216 1499 % growth 45% 28% 55% 128% 0% 0% 0% 352% 34% 23% % payout 9% 18% 14% 16% 24% 28% 24% 22% 90% 110% 127% Total stockholder's equity - BOP 7679 8328 8835 9459 10159 10265 10157 Plus: Net income to common 850 708 826 902 1015 1108 1178 Less: Dividends 201 201 201 201 910 1216 1499 Total stockholders' equity - EOP 7679 8328 8835 9459 10159 10265 10157 9836 Less: Goodwill (1016) (1015) (4061) (4061) (4061) (4061) (4061) (4061) Plus: Junior subordinated debentures issued to capital trusts 265 265 265 265 265 265 265 265 Plus: Other (123) (1333) 0 0 0 0 0 0 Tier 1 Capital - EOP 6805 6245 5039 5663 6363 6469 6361 6040 ROE (Net income to common / Shareholders' equity) 10.6% 8.3% 9.0% 9.2% 10.0% 10.8% 11.60% RWA - EOP 56240 49173 39674 44590 50105 54821 58360 60403 % growth -13% -19% 12% 12% 9.4% 6.5% 3.50% Capital ratio (Tier 1 capital / RWA) 12.10% 12.70% 12.70% 12.70% 12.70% 11.80% 10.90% 10.00% Minimum capital ratio 11.8% 10.9% 10% DDM PV Calc - Development and Maturity Phases Dividends 708 826 902 1015 1108 1178 PV of dividends 3961 DDM Terminal Value Calcs SHARES OUTSTANDING Long term dividends growth rate -3.16% Basic shares outstanding 193.589 Terminal year dividends (t+1) 1452 Current share price $51.17 Cost of equity 10.7% Terminal value (TV) 10474.96 Options PV of TV - Perpetuity approach 5692.025 #exercisable exercise price #in the $ Tranche 1 0.198 $17.39 0.198 Exit multiple (P/BV) 1.37x Tranche 2 0.277 $22.33 0.277 Terminal value (TV) 13475.66 Tranche 3 1.094 $28.30 1.094 PV of TV - Exit multiple approach 7322.585 Tranche 4 0.032 $30.10 0.032 Tranche 5 0.047 $47.10 0.047 "Intrinsic" Exit P/BV: 1.07x Total options 1.648 1.648 VALUATION Treasury stock method Option proceeds $44 Perpetuity approach Repurchased shares 0.855 Equity value of ZION 9,653 Dilutive impact of stock options 0.793 Implied P/BV 1.2x Implied P/TBV 1.5x ZION diluted shares outstanding: 194.382 ZION value / share $49.66 Exit multiple approach Equity value of ZION 11,284 P/BV 1.4x P/TBV 1.8x ZION value / share $58.05 historicals development phase maturity phase
- 18. Zions Bancorporation March 26, 2019 OSU SIM Equity Research 17 Limitation DDM method is highly dependent on terminal value assumptions and ROE. The analysis becomes complicated when taking share repurchases, business cycle and capital requirement issues. Price Target Figure 13: Valuation Summary DDM SENSITIVITY Share price sensitivity to cost of equity (vertical) and ROE (horizontal) ROE $49.92 9.7% 10.7% 11.7% 12.7% 13.7% 14.7% 11.7% $41.12 $43.45 $45.79 $48.13 $50.46 $52.80 11.2% $42.82 $45.28 $47.74 $50.20 $52.66 $55.13 10.7% $44.65 $47.25 $49.84 $52.44 $55.04 $57.63 10.2% $46.63 $49.37 $52.11 $54.85 $57.59 $60.34 9.7% $48.77 $51.67 $54.57 $57.47 $60.37 $63.27 Share price sensitivity to cost of equity (vertical) and perpetuity growth rate (horizontal) Perpetuity growth rate $49.92 -7.2% -6.2% -5.2% -4.2% -3.2% -2.2% 11.7% $39.52 $40.85 $42.33 $44.00 $45.89 $48.06 11.2% $40.92 $42.35 $43.96 $45.78 $47.85 $50.23 10.7% $42.41 $43.96 $45.71 $47.69 $49.96 $52.58 10.2% $43.99 $45.67 $47.57 $49.74 $52.23 $55.12 9.7% $45.67 $47.50 $49.58 $51.95 $54.69 $57.89 Share price sensitivity to cost of equity (vertical) and exit multiple (horizontal) Exit multiple $58.11 1.17x 1.27x 1.37x 1.47x 1.57x 1.67x 11.7% $50.29 $52.90 $55.50 $58.11 $60.71 $63.32 11.2% $51.43 $54.11 $56.79 $59.46 $62.14 $64.82 10.7% $52.61 $55.36 $58.11 $60.86 $63.61 $66.36 10.2% $53.83 $56.65 $59.48 $62.30 $65.13 $67.95 9.7% $55.08 $57.98 $60.88 $63.79 $66.69 $69.59 Cost of equity Cost of equity Cost of equity
- 19. Zions Bancorporation March 26, 2019 OSU SIM Equity Research 18 RISK AND CONCERN Accounting Quality Divergence from Benford’s Law In the fraud detection domain, Benford’s law, also known as first-digit law, states that the expected distribution of the first digit of financial statement tends to adhere to the same probability distribution.16 We can determine if a company is a manipulator or not by comparing the actual distribution and the expected distribution from Benford’s law. If there is a significant divergence between these two distributions, this company is likely to have manipulated their financial statements. We evaluate the divergence from Benford’s Law using Mean Absolute Deviation (MAD). Figure 14: Divergence from Benford’s Law Graph Source: company 10-K Valuation Matrics Weight Price Target DDM - Perpetuity approach 15% $49.84 DDM - Exit multiple approach 15% $58.09 DCFE 30% $59.26 P/E 10% $54.48 P/B 10% $57.49 P/S 10% $64.70 P/CF 10% $40.84 Final Price Target 100% $55.72
- 20. Zions Bancorporation March 26, 2019 OSU SIM Equity Research 19 Figure 15: Divergence from Benford’s Law Table The test value is calculated as 1.36 �𝑡𝑡𝑡𝑡𝑡𝑡𝑡𝑡𝑡𝑡 𝑛𝑛𝑛𝑛𝑛𝑛𝑛𝑛𝑛𝑛𝑛𝑛 𝑜𝑜𝑜𝑜 𝑓𝑓𝑓𝑓𝑓𝑓𝑓𝑓𝑓𝑓 𝑑𝑑𝑑𝑑 𝑑𝑑𝑑𝑑𝑑𝑑𝑑𝑑 𝑢𝑢𝑢𝑢𝑢𝑢𝑢𝑢 , when we are testing whether this financial statement is in conformity to Benford’s distribution based on the KS statistic at a 5% significance level. Since the calculated KS statistic of 0.1398 is larger than the test value, we can reject the null hypothesis that the empirical distribution follows Benford’s theoretical distribution. Therefore, I am 95% confident that ZION’s financial statements are subject to manipulation. Interest Rate Macroeconomic backdrop is the primary risk to Zions Bancorp. Zions Bancorp’s profitability is highly dependent on the impact of credit and debit cycles, interest rate cycle. A reversal in the current interest rate trend or corporate tax reform would be a large risk to Zions Bancorp.17 This is likely to lead to drastic decline in return on tangible equity. However, all of these aforementioned scenarios are not under management’s control. CONCLUSION I recommend HOLD because of the following reasons: Future economic environment is expected to favor the Regional Bank industry. Looking ahead, growing consumer confidence, excess disposable income, rising interest rates, and financial deregulation will drive future earnings growth Target price is $55.72 with a potential upside of 27.68% The company has a pretty good financial condition in terms of profitability, liquidity, credit quality, and leverage. Specifically, its profit margin has been continuously increasing over the past few years. In addition, its ROA and ROE are much higher than industry average ZION’s financial statements are subject to manipulation Zions Bancorp’s performance is highly dependent on its expense-saving initiatives and interest rate changes With growing deal size and frequency, the trend toward further merger and acquisitions has risen recently, driving competitors’ expenses down. This could potentially pose a significant threat on Zions Bancorp. n 1 2 3 4 5 6 7 8 9 Count 70 54 21 16 15 9 4 5 7 Actual Distribution 0.3483 0.2687 0.1045 0.0796 0.0746 0.0448 0.0199 0.0249 0.0348 Expected Distribution 0.3010 0.1761 0.1249 0.0969 0.0792 0.0669 0.0580 0.0512 0.0458 0.0472 0.1398 0.1193 0.1020 0.0975 0.0753 0.0372 0.0109 0.0000 KS Statistic 0.1398 test value 0.0950 � 𝐴𝐷𝐷𝑓𝑓 − � 𝐸𝐸𝐷𝐷𝑓𝑓 𝑛𝑛 𝑓𝑓=1 𝑛𝑛 𝑓𝑓=1
- 21. Zions Bancorporation March 26, 2019 OSU SIM Equity Research 20 REFERENCES 1 https://www.investopedia.com/terms/f/fixed-interest-security.asp 2 https://www.investopedia.com/terms/m/money-marketfund.asp 3 Zions Bancorporation 2018 fourth quarter earnings report 4 Bloomberg BI function 5 Bloomberg BI function 6 Zumbrun, J. (2019). IMF Lowers 2019 Global Growth Forecast. Retrieved from https://www.wsj.com/articles/imf- lowers-2019-global-growth-forecast-11548075601 7 IBISWord Regional Bank Industry Report 8 Bloomberg BI function 9 IBISWord Regional Bank Industry Report 10 IBISWord Regional Bank Industry Report 11 CFRA Industry Survey, Sep 19, 2018, Retrieved from NetAdvantage 12 CFRA Industry Survey, Sep 19, 2018, Retrieved from NetAdvantage 13 Zions Bancorp latest 10-K (2017) 14 Zions Bancorporation 2018 fourth quarter earnings report 15 https://www.investopedia.com/terms/l/loanlossprovision.asp 16 Amiram, Dan and Bozanic, Zahn and Rouen, Ethan, Financial Statement Errors: Evidence from the Distributional Properties of Financial Statement Numbers (August 2, 2015). Review of Accounting Studies, December 2015, Volume 20, Issue 4, pp 1540-1593. Available at SSRN: https://ssrn.com/abstract=2374093 or http://dx.doi.org/10.2139/ssrn.2374093 17 Zions Bancorp latest 10-K (2017)