
Recommended
Recommended
More Related Content
What's hot
What's hot (20)
Similar to endocrinology
Similar to endocrinology (20)
Recently uploaded
Recently uploaded (20)
endocrinology
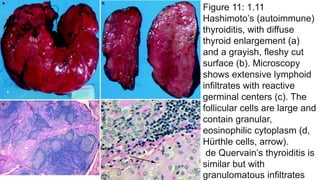
- 1. Figure 11: 1.11 Hashimoto’s (autoimmune) thyroiditis, with diffuse thyroid enlargement (a) and a grayish, fleshy cut surface (b). Microscopy shows extensive lymphoid infiltrates with reactive germinal centers (c). The follicular cells are large and contain granular, eosinophilic cytoplasm (d, Hürthle cells, arrow). de Quervain’s thyroiditis is similar but with granulomatous infiltrates
- 2. Figure 13: 1.13 Follicular adenoma of the thyroid. Note the sharp demarcation (encapsulation) and colloid shine of this macrofollicular adenoma (a). Microscopy (b, c) shows a follicular adenoma of the thyroid with a well-developed, fibrous capsule
- 3. Figure 14: 1.14 (a) This well-circumscribed lesion mimics adenoma, but a suspicious satellite nodule (arrow) suggests malignancy. (b) Another view shows a formalin- fixed (brownish) thyroid with poorly demarcated, diffuse, and nodular cancerous infiltration (white parts). (c) Microscopy confirms the diagnosis of papillary carcinoma
- 4. Figure 15: 1.15 Carcinomas of the thyroid have various histologic appearances, including papillary carcinoma with characteristic ground glass nuclei (“Orphan Annie eye”) (a), follicular variant of a papillary carcinoma (b), and psammoma bodies of papillary carcinoma (c)
- 5. Figure 16: 1.16 Papillary carcinoma of the thyroid. An ultrasound image (a) shows a heterogeneous mass with calcium. Doppler ultrasonography (b) shows hypervascularity
- 6. Figure 17: 1.17 Follicular carcinoma of the thyroid. (a, b) Note the irregular growth of well-differentiated follicles, with signs of capsular and vascular invasion
- 7. Figure 18: 1.18 Anaplastic thyroid carcinoma, showing dense population of undifferentiated, pleomorphic cells with multiple mitotic figures (arrows)
- 8. Figure 19: 1.19 Medullary (C-cell) carcinoma of the thyroid. (a) A gross specimen shows poorly delimited, slightly yellowish infiltration of the gland (arrow). (b) Microscopy shows small-cell infiltrates with amyloid deposits (arrow) in interstitial tissue. (c) Amyloid shows characteristic birefringence on polarization of Congo red-stained sections. (d) Immunohistochemistry shows positive staining for calcitonin
- 9. Figure 20: 1.20 Primary malignant non- Hodgkin’s lymphoma of the thyroid. Note the diffuse, whitish enlargement of the gland (a) caused by pronounced interstitial infiltration by atypical lymphoid cell populations (b)
- 10. Figure 21: 1.21 Parathyroid glands. The gross picture (a), showing the location, is a view from the posterior with the esophagus removed. The parathyroid glands are shown on the posterior surface of the thyroid gland (arrows). The normal location may vary, however, occasionally reaching down into the thymus. Microscopy shows a normal parathyroid gland with abundant fat tissue (b) and a hyperplastic gland with extensive replacement of fat tissue by parathyroid endocrine cells (c)
- 11. Figure 22: 1.22 Parathyroid adenoma and carcinoma frequently are distinguishable only by microscopy. Gross appearance (a) showing several nodular, tumorous infiltrates of enlarged parathyroid gland (original magnification ×3). Microscopy shows parathyroid adenoma (b) and carcinoma with signs of tumorous invasion of the capsule and adjacent tissues and cellular polymorphism (c)
- 12. Figure 23: 1.23 Hyperparathyroidism—whether primary (parathyroid adenoma, carcinoma, or primary hyperplasia) or secondary (due to renal disease)—causes increased bone resorption (such as the lacunar osteoclastic resorption shown in this image), causing dissecting fibro- osteoclasia and finally osteitis fibrosa cystica (von Recklinghausen’s disease). Hypercalcemia also leads to calcification of soft tissues and mucosal surfaces, and to nephrolithiasis (See also Chaps. 6 and 9 for renal and bone diseases)
- 13. Figure 24: 1.24 Technetium (99mTc) sestamibi parathyroid scan (after 15 min and 2 h) showing a left inferior parathyroid adenoma (Figure provided by Bechara Y. Ghorayeb, M.D., Houston, Texas [www. ghorayeb. com])
- 14. Figure 25: 1.25 (a) A technetium (99mTc) sestamibi scan at 15 min (immediate) and after a 3-h delay, showing a large adenoma. (b, c), surgical pictures of the same adenoma (Figure provided by Bechara Y. Ghorayeb, M.D., Houston, Texas [www. ghorayeb. com])
- 15. Figure 26: 1.26 Islet cell tumors of the pancreas (a, b). These tumors form nodular masses, which often appear solid and are yellow-tan to white
- 16. Figure 27: 1.27 Microscopy of a pancreatic adenoma producing gastrin (gastrinoma) on hematoxylin-eosin stain (a) and with immunohistochemistry for gastrin (b brown cells)
- 17. Figure 27: 1.27 Microscopy of a pancreatic adenoma producing gastrin (gastrinoma) on hematoxylin-eosin stain (a) and with immunohistochemistry for gastrin (b brown cells)
- 18. Figure 31: 1.31 (a, b) Axial and coronal CT scans of the pancreas head show prominent nodular alterations indicative of neuroendocrine tumor
- 19. Figure 32: 1.32 Adrenal hemorrhagic necrosis in meningococcal septicemia, causing hemorrhagic shock and the death of the patient (Waterhouse–Friderichsen syndrome; see also Chap. 1). Note the extensive necrosis and hemorrhage of the adrenal cortex (a) and diffuse petechial and confluent hemorrhages of the skin (b). The internal organs show similar hemorrhages
- 20. Figure 33: 1.33 Adrenal cortical hypoplasia. (a) The gross appearance is of a small, brownish, thin, and soft gland (about 1.8 cm in length). (b), Microscopy shows hypoplastic adrenal cortex (C) with poorly - organized layers (arrows). (c), By comparison, normal cortex has clearly identifiable zones (G glomerulosa, F fasciculate, R reticularis, M adrenal medulla)
- 21. Figure 2: 1.2 Atrophy of the pituitary gland (“empty sella syndrome”). Note the cavitation of the sella turcica (arrows) associated with shrinkage of the pituitary gland
- 22. Figure 30: 1.30 This axial CT scan, performed with contrast, shows a pancreas nodule (presumed to be an islet cell tumor) in a patient with von Hippel–Lindau syndrome
- 23. Figure 38: 1.38 Left adrenal primary adrenocortical carcinoma. This postcontrast CT scan shows a large (4.4 cm), irregularly enhancing left adrenal mass. The differential diagnosis must include metastasis
- 24. Figure 39: 1.39 Pheochromocytoma. (a) This axial CT scan with contrast shows a left adrenal pheochromocytoma immediately medial and superior to the left kidney. (b), A coronal CT with contrast in the same patient
- 25. Figure 40: 1.40 Pinealoma (pineal germinoma), shown in midsagittal (a) and axial (b) postcontrast T1-weighted MR images (arrows)
- 26. Figure 34: 1.34 (a) Diffuse adrenal cortical hyperplasia. Note the yellowish thickening of poorly demarcated adrenal cortex (arrows), as shown in this cross section of the gland. (b) Adrenal cortical adenoma. Note the well- demarcated yellow nodule (arrows) (F periadrenal fat tissue, AG adrenal gland). (c) Typical microscopy of the adenoma, with fairly uniform, pale polygonal cells with small dark nuclei and no mitoses. Adrenal cortical adenomas and carcinomas may be associated with primary hyperaldosteronism (Conn’s syndrome), Cushing’s syndrome, feminization, or virilization, or may be nonfunctional
- 27. Figure 35: 1.35 Adrenal cortical carcinomas. (a–c), Note the irregular structure with yellowish, partly necrotic, and hemorrhagic tissues with pseudocystic degeneration. (d) Microscopy shows irregular growth of more polymorphic, partially poorly differentiated cells, including giant cells
- 28. Figure 36: 1.36 Adrenal medullary pheochromocytoma: gross appearance on the surface (a) and cut surface (b), with soft yellowish red “medullary” tissue, focal hemorrhage, and pseudocystic degeneration. Microscopy (c) shows a population of polymorphic “epithelioid” cells with giant cells
- 29. Figure 37: 1.37 Adrenal medullary neuroblastoma. (a) Gross appearance shows a whitish, nodular infiltrate of the gland with focal degeneration and hemorrhage. (b) Microscopy shows a typical small cellular (“lymphoid”) infiltration with characteristic neurofibrillary rosettes
- 30. Figure 41: 1.41 (a) Gross sagittal section from a brain with a pineal tumor. (b) Microscopy shows the biphasic pattern of the pinealoma, with areas composed of large primitive spheroidal cells and stromal areas with a prominent lymphocytic component. (c) Microscopy of a pineocytoma, a tumor of pineal parenchymal cells with pineocytomatous rosettes (large fibrillar zones)
- 31. Figure 1: 1.1 Normal pituitary gland: location at the base of the skull in the sella turcica (a, arrow) with cross section (b). Enlarged picture of a removed gland (c) showing the adenohypophysis (A, pink part) and the neurohypophysis (N, white part)
- 32. Figure 4: 1.4 This formalin-fixed specimen (reconstituted in alcohol) shows a large pituitary adenoma (a) expanding to the optic nerve and the intracerebral part of the internal carotid artery (arrows). Microscopy shows a typical chromophobe adenoma composed of small cells (b). Chromophobe adenomas generally contain small numbers of secretory granules (sparsely granulated) but may produce a number of different hormones. A adenoma
- 33. Figure 3: 1.3 (a) MRI in sagittal view shows distinct pituitary enlargement representing an adenoma (arrow). (b), A CT scan of the cranium shows a tumorous mass on the right between the optic chiasm and the base of the third ventricle (arrow)
- 34. Figure 6: 1.6 Pituitary macroadenoma. This coronal magnetic resonance (MR) image (T1-weighted, postcontrast) reveals a large, homogenously enhancing mass that extends above the diaphragma sellae, abuts and deviates the optic chiasm, and invades the right cavernous sinus
- 35. Figure 7: 1.7 Prolactinoma. This coronal MR image (T1- weighted, postcontrast) shows the classic findings of a hypoenhancing mass in the pituitary, deviation of the infundibulum from the mass, and upward convexity of the pituitary border
- 36. Figure 5: 1.5 Other types of adenoma are composed of basophilic cells producing corticotropin (clinical, Cushing’s disease or Nelson’s syndrome). Adenomas composed of acidophilic cells are typically associated with the production of growth hormone (somatotropin) or prolactin. About 25 % of pituitary adenomas are nonfunctional, without endocrine activity. Newer classifications use endocrine activities rather than cellular-staining qualities; shown here, for example, is an FSH-producing adenoma, with immunohistochemistry showing brown, FSH-positive cells. This figure shows an immunohistochemical stain for somatotropin
- 37. Figure 8: 1.8 Thyroid hyperplasia (nodular goiter), showing gross enlargement with nodular and cystic (degenerative) structures (a removed gland, b gland in situ seen from behind, with larynx and trachea in the center). Microscopy (c) of a hyperplastic (adenomatous) nodule in a patient with a nodular goiter, demonstrating that the nodule is partially encapsulated and is composed of large, colloid-filled follicles
- 38. Figure 9: 1.9 Thyroid gland from a patient with Graves’ disease (hyperthyroidism, also referred to as Basedow’s disease). The cut surface shows diffuse hyperplasia and has a fleshy appearance (a). Microscopically (b), follicles are lined by hyperplastic follicular cells with focal papillary structure and areas of colloid resorption vacuoles
- 39. Figure 10: 1.10 Right thyroid goiter. (a, b) Axial and coronal postcontrast CT scans, show a large right low- density cyst consistent with a colloid cyst of goiter