SlideShare a Scribd company logo
1 of 8
Download to read offline
How Surface Potential Determines the Kinetics of the First Hole
Transfer of Photocatalytic Water Oxidation
Matthias M. Waegele,†
Xihan Chen,†
David M. Herlihy,†
and Tanja Cuk*,†,‡
†
Department of Chemistry, University of California, Berkeley, Berkeley, California 94720, United States
‡
Chemical Sciences Division, Lawrence Berkeley National Laboratory, Berkeley, California 94720, United States
*S Supporting Information
ABSTRACT: Interfacial hole transfer between n-SrTiO3 and
OH−
was investigated by surface sensitive transient optical
spectroscopy of an in situ photoelectrochemical cell during water
oxidation. The kinetics reveal a single rate constant with an
exponential dependence on the surface hole potential, spanning
time scales from 3 ns to 8 ps over a ≈1 V increase. A voltage- and
laser illumination-induced process moves the valence band edge
at the n-type semiconductor/water interface to continuously
change the surface hole potential. This single step of the water
oxidation reaction is assigned to the first hole transfer h+
+ OH−
→ OH•
. The kinetics quantify how much a change in the free energy difference driving this first hole transfer reduces the
activation barrier. They are also used to extrapolate the kinetic rate due to the activation barrier when that free energy difference
is zero, or the Nernstian potential. This is the first time transient spectroscopy has enabled the separation of the first hole transfer
from the full four hole transfer cycle and a direct determination of these two quantities. The Nernstian potential for OH−
/OH•
is
also suggested, in rough agreement with gas-phase studies. The observation of a distinct, much longer time scale upon
picosecond hole transfer to OH−
suggests that a dominant, more stable intermediate of the water oxidation reaction, possibly a
surface bound oxo, may result.
■ INTRODUCTION
Water oxidation at solid metal oxide photocatalysts of earth
abundant metals is a highly selective heterogeneous chemical
reaction for O2 evolution whose mechanism is of intense
current interest.1−16
The motivation to understand this catalytic
process step-by-step is based on the fact that it is an
indispensable part of any renewable fuel forming reaction,
and solid oxides are particularly active catalyst materials.
Insights gained from uncovering elementary charge-transfer
processes and how they couple to chemical transformation at
the catalyst/water interface are key for the design of more
efficient catalysts. As suggested by calibrated photochemical
studies, the full cycle involves four hole transfers from the
catalyst to water.4,17,18
Under basic conditions, hydroxyl groups
are more easily oxidized, such that
+ → ++ −
4h 4OH O 2H O2 2 (1)
The challenge is to follow the kinetics of each hole transfer
and the formation and lifetime of the intermediate species of
the catalytic cycle that result. In turn, this will identify the hole
transfer(s) that limit the reaction rate and the more facile hole
transfer(s) that dynamically alter the catalytic surface for the
rate limiting step(s). In photochemical or electrochemical
studies, the dependence of steady-state product evolution on
the free energy difference driving the hole transfer is used to
extract activation barriers.6,15
While providing insight into the
mechanism, these steady-state studies are highly model
dependent for multistep reactions.19,20
Only the transient
response of the photodriven water oxidation reaction can
directly step through a catalytic cycle. In particular, ultrafast
spectroscopy, by following the reaction from time zero can
most readily differentiate the kinetics of the disparate physical
processes involved. The initial step in the cycle is the first hole
transfer and is suggested to involve the following reaction in
basic conditions:
+ →+ − •
h OH OH (2)
where OH•
is a hydroxyl radical that may either be bound to a
metal ion at the surface or be free in solution. A more stable
metal oxo intermediate is likely to be formed from this unstable
radical, as suggested by steady-state electrochemical stud-
ies3,6,15,21,22
and the recent millisecond time scale infrared
studies that saw the oxo intermediate directly.8,16
Ultrafast transient optical spectroscopy of the photodriven
water oxidation reaction at the n-type semiconductor/water
interface in principle could follow the kinetics of this first hole
transfer. Here, the photogenerated holes are efficiently
separated within the semiconductor and sent to the aqueous
interface at femtosecond time scales, defining the starting point
of the cycle. However, so far, the kinetics that apply to the first
hole transfer have not been differentiated from subsequent
Received: April 10, 2014
Published: July 16, 2014
Article
pubs.acs.org/JACS
© 2014 American Chemical Society 10632 dx.doi.org/10.1021/ja503603k | J. Am. Chem. Soc. 2014, 136, 10632−10639
kinetic steps. Transient optical spectroscopy has assigned a
range of interfacial hole transfer time constants from 500 ps1,2
to hundreds of ms4,7
at the n-TiO2 and n-Fe3O4 aqueous
interfaces. Many of these studies were conducted under
conditions where the quantum efficiency of O2 evolution is
low (0.1% to 5%),4,10
such that the true interfacial kinetics is
difficult to separate from electron−hole recombination kinetics
within the semiconductor. Further, these studies were
conducted at a single surface hole potential, determined by
the valence band edge at the aqueous interface.23−27
Therefore,
the kinetics could not be followed as a function of the free
energy difference between the reactants and products. This
prevents attributing the kinetics to a single step of the reaction
and understanding its activation barrier through a tunable free
energy.
Herein we report on transient optical spectroscopy of n-
SrTiO3 in an in situ electrochemical cell under conditions of
high quantum efficiency (>75%) and surface sensitivity (≈25
nm) that reveals the kinetics of interfacial hole transfer as a
function of the surface hole potential. n-SrTiO3 is a
representative transition metal oxide-based photoanode and is
ideally suited for time-resolved pump−probe spectroscopy due
to its high-quantum efficiency for O2 evolution with 300 nm
excitation. Continuous tuning of the surface hole potential on
the electrochemical cell is achieved by a voltage- and laser-
induced process26,28
that moves the position of the valence
band edge at the aqueous interface with the applied potential
on the electrochemical cell.
The kinetics reveal a single rate constant with an exponential
dependence on the surface hole potential, spanning time scales
from 3 ns to 8 ps over a ≈1 V increase. This indicates that we
are mapping an activation barrier for a single step of the water
oxidation reaction, differentiating the first hole transfer from
the rest. The activation barrier for this first hole transfer,
suggested to be the OH−
/OH•
reaction, is quantified by a hole
transfer coefficient, α, that determines how efficiently increasing
the free energy difference reduces the activation barrier and by
a rate constant, k0, that relates to its magnitude when the free
energy difference is zero, or the Nernstian potential. Further,
the data also suggest a Nernstian potential for the OH−
/OH•
reaction in solution that is in rough agreement with gas-phase
studies in a hydrated environment, supporting the assignment
of reaction 2 to the initial step of the water oxidation reaction
and to the kinetics being probed here. Following the first hole
transfer, the kinetics reveal a much longer time scale, possibly
related to the formation of a metal oxo intermediate and further
showing that multiple steps of the cycle can be differentiated.
■ EXPERIMENTAL PROCEDURES
The 0.7% and 0.08% Nb-doped SrTiO3 by weight (henceforth referred
to as 0.7% and 0.1%, respectively) single crystals with crystallographic
orientation (100) were obtained from MTI Corp. (Richmond, CA).
The crystals were 0.5 mm thick with polished front sides (Ra < 5 Å)
and unpolished back sides. All spectroscopic measurements were
performed on the polished front sides.
The optical constants of Nb-doped SrTiO3 were derived from
spectroscopic ellipsometry measurements recorded on a Horiba Jobin-
Yvon UVISEL Ellipsometer (Horiba, Edison, NJ). The spectra were
taken in reflection mode in air at a 70° angle of incidence.
All spectroelectrochemical measurements were performed in a
Teflon electrochemical cell with CaF2 optical windows (3 mm thick).
The electrolyte was a ≈0.1 M aqueous solution of sodium hydroxide
for all experiments, unless otherwise noted. To avoid formation of
laser-induced air bubbles during pump−probe experiments, electrolyte
solutions were briefly degassed under vacuum before commencing
experimental measurements. The amount of laser light was insufficient
to generate a macroscopically observable O2 bubble. Bubble formation
was solely due to above-band gap excitation of SrTiO3, which heated
the solution in the vicinity of the semiconductor/electrolyte interface,
thereby liberating dissolved gases. The electrolyte was in contact with
the atmosphere during measurements. The potential of the n-SrTiO3
working electrode with respect to an Ag/AgCl reference electrode
(MF-2052; Basi, West Lafayette, IN) was controlled by a CHI1140B
Potentiostat (CH Instruments, Austin, TX). A Pt wire served as the
counter electrode. Ohmic contact between the unpolished n-SrTiO3
back side and copper wire was established using silver paste (Electron
Microscopy Sciences, Hatfield, PA). For the transient reflectance
experiments, an insulating lacquer covered all surfaces except the
polished front side of the crystal. The exposed front surface areas of
the 0.1% and 0.7% Nb-doped samples were ≈25 and ≈50 mm2
,
respectively. For differential capacitance measurements, the exposed
front side area was matched to the Gaussian laser spot size of ≈1 mm2
(fwhm).
Differential capacitance measurements were carried out using ac
voltammetry. The dc potential was swept from positive to negative
applied potentials. The ac amplitude and frequency were 0.025 V and
100 Hz, respectively.
For the transient reflectance experiments, the pump and probe
beams were derived from a regeneratively amplified Ti:sapphire laser
system (Coherent Legend; Coherent, Inc., Santa Clara, CA) producing
output pulses with a center wavelength of 800 nm and ≈150 fs
temporal width at a 1 kHz repetition rate. Part of the amplifier output
was directed into an optical parametric amplifier (OPerA-SOLO; Light
Conversion, Vilnius, Lithuania) for generation of laser pump pulses at
300 nm. The s-polarized 800 nm probe beam was directed onto the
sample at a 45° incident angle. The pump beam, perpendicularly
polarized to the probe beam, was incident normal to the sample
surface. After the sample, the reflected probe beam was focused into an
optical fiber, which was coupled to a CCD array spectrometer (CAM-
VIS-3; Ultrafast Systems, LLC, Sarasota, FL). In all experiments, the
pump beam was modulated by a mechanical chopper (3501; Newport,
Inc., Irvine, CA) at a frequency of 500 Hz. The detector output was
interfaced with a personal computer, which provided automated
control over an optical pump−probe delay stage (MTM250CC1;
Newport, Inc., Irvine, CA). Typical pump-induced reflectance changes
(ΔR/R) were on the order of 0.8 mOD. The typical incident pump
fluence was about 0.045 mJ cm−2
, corresponding to carrier densities on
the order of 1019
cm−3
. The excitation beam spot size was ≈500 μm
(fwhm).
Under conditions of 150 fs pulsed laser excitation and current flow,
the sample damages. The damage was investigated by scanning
electron microscopy (Figure S1, Supporting Information). While
otherwise displaying the flat surface of the single crystal sample, the
images show pits in the sample on the order of 5−10 μm in diameter
covering about 15% of the surface. These randomly located pits
indicate ablation of the material. The most commonly reported cause
of such laser-induced material ablation is Coulomb explosion.29,30
In
this process, enough charge is deposited in the material such that
bonds are broken. In our experimental conditions, each laser pulse
produces ≈1019
holes/cm3
in the depletion layer that could cause
bond breaking if the same area is traversed by subsequent pulses and
the water oxidation reaction has not yet depleted the stored charge. To
minimize this damage, the transient experiments were performed on a
moving sample at each time point at open circuit conditions, where no
damage took place, and closed circuit conditions of current flow,
where damage did take place.
The overall voltammogram did not appreciably change during the
course of the experiment, indicating that the catalyst was chemically
stable and further signifying that the damage was caused by a physical
process in which microscopic pieces of materials are explosively
removed, and not due to a progressive chemical reaction consuming
the electrode material. Indeed, previous experiments on n-SrTiO3 with
high current densities performed over many hours do not exhibit
chemical photocorrosion in basic conditions.31,32
Journal of the American Chemical Society Article
dx.doi.org/10.1021/ja503603k | J. Am. Chem. Soc. 2014, 136, 10632−1063910633
■ RESULTS
Steady-State Current: O2 Evolution. n-SrTiO3 is a model
system for studying the kinetics of O2 evolution by transient
optical spectroscopy. It exhibits a near ideal photoinduced
current for an n-type semiconductor and a very high quantum
efficiency for the reaction. Since the kinetic measurements
herein focus on 0.1% Nb-doped SrTiO3, we primarily report on
that sample and use 0.7% Nb-doped SrTiO3 to verify the trends
in the data.
Figure 1a shows the results of steady-state current measure-
ments with n-SrTiO3 as the photoanode in an electrochemical
cell in the dark and with 500 Hz, 150 fs laser excitation at 300
nm. The current versus voltage curve exhibits an ideal diode-
like behavior. For cathodic voltages more negative than −0.8 V
the n-type semiconductor is in a forward bias regime where the
surface electric field that separates the electron−hole pairs
(depletion layer) decreases in width and the current
exponentially decays to zero. Under anodic voltages, the
semiconductor is largely in a reverse-bias regime where the
width of the depletion layer is maximized and the anodic
current is largely potential-independent.
Both the shape of this curve and the quantum efficiency of
the photocurrent (>75%), defined as the ratio of the
photocurrent to the absorbed light flux, are similar to that
obtained with a continuous xenon lamp source (Figure 1b and
Figure S2, Supporting Information). The photocurrent
measurements are conducted in a regime of high pH (11−
14), where the steady-state current is independent of pH and
not considered mass diffusion limited (Figure S3, Supporting
Information).19
The high quantum efficiency is achieved by ensuring that the
excitation absorption depth, d = λ/4πκ, where λ is the
excitation wavelength and κ is the imaginary part of the
refractive index, is smaller than or equal to the width of the
depletion layer. As shown in Figure 1b, where the quantum
efficiency is plotted together with the index of refraction as a
function of wavelength, the quantum efficiency closely follows
κ. Using the Schottky approximation for the n-type semi-
conductor/liquid interface, the depletion width is given
according to27
=
ϵϵ
| |
−
| |
⎛
⎝
⎜
⎞
⎠
⎟W
e N
U
k T
e
2 0
0 d
SC
B
0 (3)
where Nd, ϵ0, ϵ, e0, kB, and T represent the doping density, the
vacuum permittivity, the dielectric constant of the semi-
conductor, the electronic charge, the Boltzmann constant,
and the absolute temperature, respectively. Using a value of
0.85 V for the voltage drop in the semiconductor (USC)
determined by photovoltage measurements described below,
the depletion width is calculated to be ≈25 nm and matches the
absorption depth, d, of 300 nm light.
Helmholtz Voltage: Valence Band Edge Motion. At the
solid/liquid interface of an n-type semiconductor, any voltage
drop across the interface is distributed across both the
semiconductor depletion layer (USC) and the Helmholtz layer
(UH) as shown in Figure 2.23−27
The Helmholtz layer comes
from negative ions in the liquid screening the positive charge in
the semiconductor,23−25
forming a very thin parallel plate
capacitor at the interface. UH is therefore defined to be the
voltage drop between the valence band edge potential at the
interface and the solution potential. In an electrochemical cell,
the voltage drop comes from both the applied voltage (Uappl)
and the flatband voltage determined by equilibration of the
chemical potentials of the semiconductor and the liquid (Ufb),
leading to the following equation:24,25
− = +U U U Uappl fb H SC (4)
How the voltage is distributed across the semiconductor
depletion region and the Helmholtz layer will depend on the
capacitances associated with each (CSC, CH). Whenever UH
changes, the position of the valence band edge moves and
changes the surface hole potential. Here, we find UH for the
Figure 1. (a) Current−voltage curves of n-SrTiO3 with and without laser irradiation. The blue arrows indicate the voltages at which transient kinetics
were measured. The inset shows the quantum efficiency under laser irradiation. (b) Imaginary (κ) and real (n) parts of the complex index of
refraction of n-SrTiO3. The open circles show the quantum efficiency (Q.E.) of the photocurrent at Uappl = 0 V. The output of a monochromatized
xenon lamp was used as an excitation source. The arrows indicate the excitation wavelength (300 nm) and probe wavelength (800 nm) employed in
the time-resolved experiments.
Figure 2. Diagram of the distribution of voltage between the
Helmholtz capacitance (CH) and semiconductor (depletion layer)
capacitance (CSC).
Journal of the American Chemical Society Article
dx.doi.org/10.1021/ja503603k | J. Am. Chem. Soc. 2014, 136, 10632−1063910634
electrochemical conditions that apply to the in situ transient
spectroscopy, namely a variable Uappl and high laser intensity.
At equilibrium, where Uappl = 0 V, and in the dark, UH can be
determined experimentally. As shown in Figure S4, Supporting
Information, Mott−Schottky plots of the capacitance determine
Ufb to be −1.52 V and photovoltage measurements determine
USC to be 0.85 V. Together with eq 4, these measurements
determine UH to be 0.67 V. A detailed description of the
methods used to determine these quantities are provided in the
Supporting Information. Similar assessments have recently
been made for another n-type semiconductor, Fe2O3.33
Intense light excitation alters the distribution of the voltage
drop across CSC and CH. This is shown by the fact that the
capacitance changes dramatically upon light excitation (Figure
S5, Supporting Information). Rather than simply decreasing as
the applied anodic voltage becomes less negative, as it does in
the dark, the capacitance starts increasing beyond an anodic
voltage intermediate between the flatband voltage (−1.52 V)
and the photocurrent onset (−0.85 V, see Figure 1a). A
detailed description of these measurements are provided in the
Supporting Information. As depicted in Figure 3a, there are two
types of surface charge densities (holes/cm2
) that contribute to
the voltage-dependent capacitance in the semiconductor: qSC,
the hole density in the depletion layer dependent on USC, and
qPHOTO, induced by the laser pulse. Under laser excitation, the
voltage drop that is present in the semiconductor under dark
conditions is zeroed out by qPHOTO, i.e., the semiconductor
bands are flattened under illumination. As shown by the fast
saturation of the photovoltage (Figure S4b, Supporting
Information), very small laser fluences completely flatten the
bands. This measurement indicates that only a small fraction of
the photoinduced charge annihilates the voltage drop in the
semiconductor, while most of the holes end up creating a thin,
p-type layer at the interface that increases UH. This carrier
inversion process has been seen previously to move the valence
band edge either as a result of a large number of surface
defects34
or under illumination,28
as observed here.
Given the significant effect of these excess holes at the
interface, UH is a result of both qPHOTO and qSC screened by
negatively charged ions in solution:
= +U q q C( )/H SC PHOTO H (5)
This construction has been applied successfully previ-
ously23,35
for excess surface states and assumes a voltage-
independent capacitance CH. Here, qPHOTO is obtained from the
absorbed laser fluence and qSC is given within the Schottky
approximation by
= ϵϵ | | −
| |
⎛
⎝
⎜
⎞
⎠
⎟q e N U
k T
e
2SC 0 0 d SC
B
0 (6)
UH can be self-consistently calculated from eqs 4, 5, and 6 for
a variable Uappl and qPHOTO to match the conditions of the in
situ transient spectroscopy. CH was determined from the
equilibrium measurements in the dark, when Uappl and qPHOTO
are both zero. A USC = 0.85 V and UH = 0.67 V give a CH of 21
μF/cm2
. A detailed description of the methods used to
determine these quantities is provided in the Supporting
Information.
Figure 3b shows the results of the calculation for the 0.1%
doped sample (2.66 × 10¹⁹
carriers/cm3
) at Uappl = 0 V and a
variable qPHOTO. At low qPHOTO, the distribution across UH and
USC is essentially the same as in the dark at equilibrium.
However, beyond a certain qPHOTO, UH increases substantially
while USC concomitantly lowers. At the absorbed fluence used
in the transient spectroscopy, 0.045 mJ/cm2
, ≈70% of the total
Ufb drops across UH.
Figure 4a shows how the magnitude of UH changes as a
function of Uappl for this laser fluence, at a somewhat higher
laser fluence, and in the dark. While UH increases roughly
linearly with Uappl in the dark as well as under illumination, UH
is substantially higher and increases more strongly with Uappl
under illumination. The two laser fluences show that variations
in qPHOTO in this fluence regime have only a moderate effect on
how UH depends on Uappl.
Figure 4b depicts the motion of the valence band edge with
UH(Uappl). UH(Uappl) will be used to map how changes in the
surface hole potential modulate the kinetics in the transient
spectroscopy experiments. In addition to showing how the
valence band edge moves with Uappl, UH(Uappl) itself can be
interpreted as the reaction free energy of reaction 2, as will be
discussed further below. With the absolute potential of the
valence band edge at equilibrium as a reference,36
UH(Uappl)
determines the free energy difference between interfacial holes
and O2 evolution, or the overpotential η as described in the
Supporting Information. As shown in Figure 4a, the over-
potential ranges from ≈1.3 to 2.1 V for the laser fluences and
applied potentials used in the in situ transient spectroscopy.
This range is accessed by many n-type semiconductors used for
photocatalytic water oxidation, characterized by low lying
valence bands36
with respect to the water oxidation potential,
whether excited by UV or visible light.33
Open Circuit Kinetics of Interfacial Hole Transfer. The
transient optical spectroscopy reported here was made sensitive
to interfacial hole transfer by operating under conditions where
Figure 3. (a) Band diagram showing light-induced carrier inversion at the n-SrTiO3 surface where photogenerated holes change n-SrTiO3 to p-
SrTiO3. (b) Calculated Helmholtz voltage (UH) and semiconductor (depletion layer) voltage (USC) as a function of photogenerated charges at the
interface at Uappl = 0 V for n-SrTiO3.
Journal of the American Chemical Society Article
dx.doi.org/10.1021/ja503603k | J. Am. Chem. Soc. 2014, 136, 10632−1063910635
(1) essentially all excited electron−hole pairs are separated
within the depletion layer and (2) the probe is only sensitive to
carrier dynamics within the depletion layer width. The high
quantum efficiency (>75%) for photocurrent for excitation
wavelengths shorter than 300 nm is indicative of the first
condition. To meet the latter condition, the experiments were
performed in reflectance with a 45° incident angle. In such a
reflectance geometry, the chosen near-infrared probe wave-
length (800 nm), sensitive to free carrier excitation, only
penetrates ≈25 nm from the surface according to37
d = λ/4πn
and the measured index of refraction at 800 nm (Figure 1b).
This penetration depth is equivalent to the depletion width for
reverse bias conditions.
Figure 5a shows that the experimental conditions are in fact
sensitive to interfacial charge transfer in 0.1% Nb-doped SrTiO3
by comparing the transient response in aqueous electrolyte
(NaOH) and in aqueous NaSCN electrolyte at open circuit. In
both cases, we observe negative transient reflectance changes
(ΔR) associated with an increase in the absorption of the
material following photoexcitation of the semiconductor. Such
an increase in absorption at optical frequencies corresponding
to energies significantly lower than the band gap is typically
assigned to the generation of free carriers, as has been done in
SrTiO3 previously.38
Holes are the predominant free carrier
generated within the depletion width by the excitation since the
electrons are injected into the bulk of the semiconductor by the
surface electric field faster than a few picoseconds (Supporting
Information). The decrease in absorbance with time is then
indicative of free holes leaving the semiconductor through the
aqueous interface.
As shown by single exponential fits to the kinetics, the
transient response in the aqueous NaSCN-electrolyte is three
times faster than in the basic aqueous solution. The faster
response in the NaSCN-electrolyte is attributed to the lower
Nernstian potential for hole transfer to SCN−
,39
a well-known
hole scavenger. The significantly faster response in the NaSCN-
electrolyte indicates that the interfacial charge transfer of free
holes is preferentially being probed in our geometry where the
depletion width, the excitation penetration depth, and the
probe penetration depth are all matched to 25 nm. When the
depletion width is smaller and not matched to the incoming
light, as in the case for the 0.7% Nb-doped sample with a
depletion width of 9 nm calculated by eq 3, the transient
response (Figure 5b) does not change based on the solution
potential.
The open circuit kinetics in Figure 5 are measured with no
leads connecting the counter electrode to the anode. However,
this does not imply that a voltage is not applied. From the
photovoltage measurements, the pump excitation drops an
equivalent of −0.85 V across the semiconductor, zeroing out
the equilibrium USC in the dark and flattening the bands. This
suggests another way to measure the open circuit kinetics,
namely by applying −0.85 V when the circuit is closed. As long
as this leads to USC = 0 V, the surface hole potential will be
equivalent and guided by UH. UH(Uappl = −0.85 V) is taken
from the calculated UH under illumination (Figure 4a) and
consistently gives USC = 0 V according to eq 4. This shows that
the true open circuit configuration and the circuit that applies
−0.85 V between reference and working electrodes have
equivalent surface hole potentials. These two circuit config-
Figure 4. (a) Calculated Helmholtz voltage (UH) as a function of
applied potential with and without laser irradiation. The right-hand
axis shows the corresponding overpotential (η) for water oxidation.
(b) Graphical definition of interfacial potentials. ϕʼs represent absolute
potentials with respect to a reference electrode and Uʼs represent
potential differences, or voltage drops. The area shaded in blue
indicates the Helmholtz layer.
Figure 5. Normalized changes in reflectance, attributed to the decay of
photogenerated holes, probed at 800 nm under open circuit
conditions. The red lines represent single exponential fits to the
data. Zero time delay between pump and probe was shifted to ≈1 ps
for display of the data on a logarithmic time scale.
Journal of the American Chemical Society Article
dx.doi.org/10.1021/ja503603k | J. Am. Chem. Soc. 2014, 136, 10632−1063910636
urations yield the same transient response (Figure S6,
Supporting Information), which means that the measured
kinetics are truly dictated by the surface hole potential.
Kinetics of Interfacial Hole Transfer as a Function of
Overpotential. We now turn to investigating these interfacial
hole transfer kinetics as a function of changes in the surface
hole potential due to valence band edge motion. As discussed
in the Introduction, we consider the first hole transfer, namely
the initial step in the cycle of water oxidation:
+ →+ − •
h OH OH (7)
Figure 6 shows the transient response (ΔR) for several
representative applied potentials. Additional traces are provided
in Figures S7 and S8, Supporting Information. The selected
voltages are taken at points where the photocurrent onsets
exponentially in the forward bias regime and where the
photocurrent becomes potential-independent in the reverse
bias regime (Figure 1a). For each voltage, the data could be
nicely fit with a single exponential for negative ΔR, attributed to
the decay of free holes. Such an exponential time dependence
suggests a first order dependence of the above reaction on the
concentration of holes. The time constant changes from 3 ns to
8 ps for applied voltages spanning −0.9 to 0.7 V.
Figure 6f displays how the logarithm of the rate constant
depends on the applied voltage. As shown by the clear linear fit
to log(kf), the rate constant exponentially depends on the
applied potential and demonstrates that we are measuring the
rate of interfacial hole transfer as a function of surface hole
potential, tuned by Uappl. The plot can be written in the form of
an Arrhenius equation describing the activation barrier to this
interfacial hole transfer:19
α= −k k F U U RTexp( ( )/ )f OC appl OC (8)
where R is the gas constant, F is the Faraday constant, and α is
the phenomenological parameter that describes the shape of
the activation barrier. kOC is assigned to the kinetics at open
circuit and UOC is the equivalent applied voltage at open circuit
conditions or −0.85 V as described in the previous section. As a
check to analyzing the data in this way, we use the slope and
the intercept of the plot (Uappl = 0 V) in Figure 6f, along with
the kinetics measured at open circuit, to independently pull out
UOC using the transient kinetics alone. We find that the value
agrees with UOC = −0.85 V. This shows that the measured
kinetics are truly tied to a potential tuned by the electro-
chemical cell in a manner that obeys the Arrhenius law.
Figure 6. (a−e) Normalized transient reflectance changes, attributed to the decay of photogenerated holes, probed at 800 nm at the specified Uappl.
The red lines are single exponential fits to the data. Zero time delay between pump and probe was shifted to ≈1 ps for display of the data on a
logarithmic time scale. (f) Plot of log(kf) vs Uappl. The red line is a linear fit to the data.
Figure 7. (a) Plot of log(kf) vs Helmholtz voltage (UH). UH was calculated using an excitation fluence of 0.045 mJ cm−2
as described in the text. The
red line is a linear fit to the data. The extracted transfer coefficient (α) is 0.24. (b) Diagram showing the free energy profile of the reaction.
Journal of the American Chemical Society Article
dx.doi.org/10.1021/ja503603k | J. Am. Chem. Soc. 2014, 136, 10632−1063910637
While log(kf) is linear with Uappl, the true potential at the
surface changes with UH. To obtain a physically meaningful
measurement of α, we rescaled the voltage axis in Figure 6f with
UH(Uappl) in Figure 4a that determines the surface hole
potential. The error in this rescaling of Uappl to UH(Uappl)
comes primarily from the error in the measurement of absorbed
fluence. The rescaling is therefore done at two absorbed laser
fluences, 0.045 mJ/cm2
and 0.065 mJ/cm2
, where the actual
absorbed laser fluence is estimated to fall between these two
values. Here, the coefficient of the Arrhenius equation is set to
be the equilibrium hole transfer rate at UH = 0 V (k0):
α=k k FU RTexp( / )f 0 H (9)
While k0 is not relevant to the determination of the slope and
therefore α, it is an important parameter describing the
activation barrier and will be discussed further below.
The results are shown in Figure 7a at a laser fluence of 0.045
mJ/cm2
and give an α of 0.24. The results for the laser fluence
of 0.065 mJ/cm2
are shown in Figure S9, Supporting
Information and give an α of 0.19. Given the uncertainty in
the absorbed laser fluence, we report α = 0.20 ± 0.05. This
means that only about 20% of the increase in surface hole
potential is reflected in a decrease of the activation barrier for
the reaction. Such an analysis leads to the asymmetric free
energy diagram for interfacial charge transfer shown in Figure
7b. While α is commonly assumed to be 0.5, Marcus theory
predicts a value different from 0.5, depending on the relative
magnitude of overpotential and solvent reorganizational energy
per molecule of reactant at the solid/electrolyte interface.19
While a more detailed interpretation of α on a molecular level is
left for future theoretical work, the value of α found here shows
the strongly uphill free energy posed by transferring holes from
a delocalized, O 2p valence band in the semiconductor to a
localized OH−
ion at the aqueous interface. We note that the
measured kinetics are obtained in a regime of high over-
potential for the water oxidation reaction, covering ≈1.3 to 2.1
V (Figure 4a). In this regime, the initial hole transfer is not rate-
limiting since changing the surface hole potential does not
increase the photoinduced, steady-state current (Figure 1a).
In using the calculated UH to determine α from the transient
kinetics, only changes in UH coming from the motion of the
valence band edge are important. Therefore, α is independent
of an assignment of the reaction taking place (reaction 7) and
the magnitude of UH. However, such a reaction is suggested by
the fast picosecond time scales for hole transfer and the very
basic conditions. Since the Helmholtz layer derives from OH−
screening the positive charge in the semiconductor, UH is then
interpreted as the free energy difference driving the OH−
/OH•
reaction. Here, the OH−
ions are thought of as being located at
the outer Helmholtz plane, rather than the inner plane
describing directly absorbed species.23
Using a reference for
the valence band edge,36
the data imply an absolute Nernstian
potential for the OH−
/OH•
reaction of +1.21 V vs normal
hydrogen electrode (NHE) at pH = 13. This value can be
compared with that obtained by gas-phase photoemission for
the OH−
/OH•
reaction 1.41 V vs NHE at pH = 1340
as well as
the range of values given by Hoare.41
The similarity in these
two values supports our assignment of reaction 7 to the
measured kinetics. Further, the free energy difference driving
the OH−
/OH•
reaction at equilibrium conditions (Uappl = 0 V)
in the dark was calculated for the TiO2 (110) surface to be 0.57
V.42
This can be compared with UH = 0.67 V found
experimentally here at equivalent conditions (Figure 4a). It is
important to note, however, that the calculation assumes the
OH species to be directly bound to the surface. Indeed, it is
difficult to determine to what extent the inner Helmholtz rather
than the outer Helmholtz layer is the potential difference
responsible for the free energy difference, and we leave that as
an open question.
In interpreting UH as the free energy difference for the OH−
/
OH•
reaction, another parameter can be pulled out from the
kinetic data, namely the kinetics of charge transfer at the
Nernstian potential of the reaction or UH = 0 V. This entails
finding the x-intercept of Figure 7a and gives a value of (6.76 ±
1.50) × 10−7
ps−1
for k0. While α determines the shape of the
activation barrier, k0 relates to its magnitude. This value is
critical to defining the current of a single step in the water
oxidation reaction and would be essential to any model of the
full O2 evolving current. To our knowledge, there are no other
direct measurements of this value in the literature, likely due to
the fact that transient experiments on electrode reactions are
scarce. Note, however, that extrapolating the intercept of the
linear fit to our data assumes that eq 9 applies at low
overpotentials for the water oxidation reaction, not directly
accessible in these experiments.
The high overpotential range of water oxidation leading to
fast, single exponential kinetics at early time scales has allowed
for the observation of clear multicomponent kinetics within a
short time window. The very fast component (below 2 ps) in
the traces at applied potentials higher than 0.2 V (Figure 6) is
tentatively attributed to hot hole transfer. At longer time scales,
as shown in Figure 6 and in Figure S10, Supporting
Information, ΔR changes sign indicating a new physical
component to the kinetic response. This kinetic component
is characterized by much longer time scales and does not show
appreciable decay out to 1.5 ns. The results indicate that we are
clearly resolving at least two kinetic components of the
multifaceted water oxidation reaction. The observation of a
single rate constant exponentially dependent on the surface
hole potential that is followed by a second, much longer time
scale suggests that a dominant new intermediate of the water
oxidation reaction is formed upon picosecond hole transfer to
OH−
within the Helmholtz layer. One possible intermediate is
the surface oxo (O) measured by steady-state infrared and
Raman experiments previously.9,16
Recently two types of oxo
species, measured at millisecond time scales have been
observed on cobalt oxide with transient FTIR spectroscopy.16
Transient optical spectroscopy at ms time scales also indicates
the formation of longer lived intermediates.4,7
Future work will
apply ultrafast infrared spectroscopy to this system to discover
the appearance of the new intermediate that results from the
disappearance of holes measured optically and at picosecond
time scales here.
Here, we observed the kinetics of the first step of the water
oxidation reaction in basic conditions, namely picosecond hole
transfer to form a hydroxyl radical followed by the formation of
a more stable intermediate. For the OH−
/OH•
reaction, we
have quantified for the first time the symmetry of the activation
barrier through α and its magnitude through k0 using an
Arrhenius equation. We consistently derived a Nernstian
potential for the reaction. Such a quantification informs
electronic structure calculations that investigate the activation
barriers and Nernstian potentials of each hole transfer of the
water oxidation cycle.11,13,14,43,44
Journal of the American Chemical Society Article
dx.doi.org/10.1021/ja503603k | J. Am. Chem. Soc. 2014, 136, 10632−1063910638
■ ASSOCIATED CONTENT
*S Supporting Information
SEM images showing laser-induced damage on 0.1% Nb doped
SrTiO3. Cyclic voltammograms of 0.1% Nb-doped SrTiO3 in
NaOH with and without irradiation by a xenon lamp. Steady-
state photocurrent of 0.1% Nb-doped SrTiO3 as a function of
electrolyte pH. Mott−Schottky plots of 0.1% Nb-doped and
0.7% Nb-doped SrTiO3 in the dark. Photovoltage measure-
ments of 0.1% Nb-doped and 0.7% Nb-doped SrTiO3 as a
function of laser fluence. Differential capacitances measure-
ments of 0.1% Nb-doped and 0.7% Nb-doped SrTiO3 in 0.1 M
Na2SO4 with and without laser irradiation. Kinetics traces for
0.1% Nb-doped SrTiO3 under open circuit condition and with
an applied bias of −0.85 V. Additional kinetics traces at various
applied potentials. Plot of log(kf) vs Helmholtz potential drop
(UH) for a higher fluence. Kinetic traces plotted on a linear time
scale. Descriptions of methods used to determine the potential
distribution at the semiconductor/liquid interface, the differ-
ential capacitance measurements under light excitation, and the
determination of overpotentials. Estimation of the drift velocity
of holes in the depletion layer. This material is available free of
charge via the Internet at http://pubs.acs.org.
■ AUTHOR INFORMATION
Corresponding Author
tanjacuk@berkeley.edu
Notes
The authors declare no competing financial interest.
■ ACKNOWLEDGMENTS
This material is based upon work supported by the Air Force
Office of Scientific Research under AFOSR award no. FA9550-
12-1-0337 and by the Department of Energy Office of Basic
Energy Sciences, under the CPIMS program KC030102 (FWP
no. CH12CUK1). Work (ellipsometry measurement) at the
Molecular Foundry was supported by the Office of Science,
Office of Basic Energy Sciences, of the U.S. Department of
Energy under contract no. DE-AC02-05CH11231. We thank
Adam Schwartzberg for helping us with the ellipsometry
measurements. We thank Heinz Frei, Steven Leone, and Gabor
Somorjai for critically reading the manuscript and Dunwei
Wang for helpful comments on our steady-state measurements.
■ REFERENCES
(1) Kasinski, J. J.; Gomez-Jahn, L. A.; Faran, K. J.; Gracewski, S. M.;
Miller, R. J. D. J. Chem. Phys. 1989, 90, 1253−1269.
(2) Lantz, J. M.; Corn, R. M. J. Phys. Chem. 1994, 98, 9387−9390.
(3) Nakamura, R.; Nakato, Y. J. Am. Chem. Soc. 2004, 126, 1290−
1298.
(4) Tang, J.; Durrant, J. R.; Klug, D. R. J. Am. Chem. Soc. 2008, 130,
13885−13891.
(5) McAlpin, J. G.; Surendranath, Y.; Dincă, M.; Stich, T. A.; Stoian,
S. A.; Casey, W. H.; Nocera, D. G.; Britt, R. D. J. Am. Chem. Soc. 2010,
132, 6882−6883.
(6) Surendranath, Y.; Kanan, M. W.; Nocera, D. G. J. Am. Chem. Soc.
2010, 132, 16501−16509.
(7) Cowan, A. J.; Barnett, C. J.; Pendlebury, S. R.; Barroso, M.;
Sivula, K.; Grätzel, M.; Durrant, J. R.; Klug, D. R. J. Am. Chem. Soc.
2011, 133, 10134−10140.
(8) Sivasankar, N.; Weare, W. W.; Frei, H. J. Am. Chem. Soc. 2011,
133, 12976−12979.
(9) Yeo, B. S.; Bell, A. T. J. Am. Chem. Soc. 2011, 133, 5587−5593.
(10) Huang, Z.; Lin, Y.; Xiang, X.; Rodrguez-Córdoba, W.;
McDonald, K. J.; Hagen, K. S.; Choi, K.-S.; Brunschwig, B. S.;
Musaev, D. G.; Hill, C. L.; Wang, D.; Lian, T. Energy Environ. Sci.
2012, 5, 8923−8926.
(11) Su, H.-Y.; Gorlin, Y.; Man, I. C.; Calle-Vallejo, F.; Nørskov, J.
K.; Jaramillo, T. F.; Rossmeisl, J. Phys. Chem. Chem. Phys. 2012, 14,
14010−14022.
(12) Cooper, J. K.; Ling, Y.; Longo, C.; Li, Y.; Zhang, J. Z. J. Phys.
Chem. C 2012, 116, 17360−17368.
(13) Liao, P.; Keith, J. A.; Carter, E. A. J. Am. Chem. Soc. 2012, 134,
13296−13309.
(14) Bajdich, M.; García-Mota, M.; Vojvodic, A.; Nørskov, J. K.; Bell,
A. T. J. Am. Chem. Soc. 2013, 135, 13521−13530.
(15) Bediako, D. K.; Surendranath, Y.; Nocera, D. G. J. Am. Chem.
Soc. 2013, 135, 3662−3674.
(16) Zhang, M.; de Respinis, M.; Frei, H. Nat. Chem. 2014, 6, 362−
367.
(17) Harriman, A.; Pickering, I. J.; Thomas, J. M.; Christensen, P. A.
J. Chem. Soc., Faraday Trans. 1 1988, 84, 2795−2806.
(18) Lin, X.; Hu, X.; Concepcion, J. J.; Chen, Z.; Liu, S.; Meyer, T. J.;
Yang, W. Proc. Natl. Acad. Sci. U.S.A. 2012, 109, 15669−15672.
(19) Bard, A. J.; Faulkner, L. R. Electrochemical Methods:
Fundamentals and Applications, 2nd ed.; Wiley: Hoboken, NJ, 2000.
(20) Newman, J.; Thomas-Alyea, K. E. Electrochemical Systems, 3rd
ed.; Wiley: Hoboken, NJ, 2004.
(21) Jaeger, C. D.; Bard, A. J. J. Phys. Chem. 1979, 83, 3146−3152.
(22) Norton, A. P.; Bernasek, S. L.; Bocarsly, A. B. J. Phys. Chem.
1988, 92, 6009−6016.
(23) Green, M. J. Chem. Phys. 1959, 31, 200−203.
(24) De Gryse, R.; Gomes, W. P.; Cardon, F.; Vennik, J. J.
Electrochem. Soc. 1975, 122, 711−712.
(25) Uosaki, K.; Kita, H. J. Electrochem. Soc. 1983, 130, 895−897.
(26) Cooper, G.; Turner, J. A.; Parkinson, B. A.; Nozik, A. J. J. Appl.
Phys. 1983, 54, 6463−6473.
(27) van de Krol, R.; Grätzel, M. Photoelectrochemical Hydrogen
Production; Springer: New York, NY, 2012; Vol. 102, pp 13−67.
(28) Turner, J. A.; Manassen, J.; Nozik, A. J. Appl. Phys. Lett. 1980,
37, 488−491.
(29) Stoian, R.; Rosenfeld, A.; Ashkenasi, D.; Hertel, I. V.; Bulgakova,
N. M.; Campbell, E. E. B. Phys. Rev. Lett. 2002, 88, 097603.
(30) Roeterdink, W. G.; Juurlink, L. B. F.; Vaughan, O. P. H.; Diez, J.
D.; Bonn, M.; Kleyn, A. W. Appl. Phys. Lett. 2003, 82, 4190.
(31) de Kreuk, C.; de Groot, J.; Mackor, A. Sol. Energy Mater. 1981,
5, 437−444.
(32) Bocarsly, A. B.; Bolts, J. M.; Cummins, P. G.; Wrighton, M. S.
Appl. Phys. Lett. 1977, 31, 568.
(33) Du, C.; Yang, X.; Mayer, M. T.; Hoyt, H.; Xie, J.; McMahon, G.;
Bischoping, G.; Wang, D. Angew. Chem., Int. Ed. 2013, 52, 12692−
12695.
(34) Bard, A. J.; Bocarsly, A. B.; Fan, F. R. F.; Walton, E. G.;
Wrighton, M. S. J. Am. Chem. Soc. 1980, 102, 3671−3677.
(35) Bockris, J. O. M.; Khan, S. U. M. Surface Electrochemistry,;-
Springer: New York, NY, 1993; Chpt. 2, pp 59−202.
(36) Xu, Y.; Schoonen, M. A. A. Am. Mineral. 2000, 85, 543−556.
(37) Fishman, I. M.; Marshall, C. D.; Meth, J. S.; Fayer, M. D. J. Opt.
Soc. Am. B 1991, 8, 1880−1888.
(38) Yamada, Y.; Yasuda, H.; Tayagaki, T.; Kanemitsu, Y. Appl. Phys.
Lett. 2009, 95, 121112.
(39) Wardman, P. J. Phys. Chem. Ref. Data 1989, 18, 1637−1755.
(40) Koppenol, W. H.; Liebman, J. F. J. Phys. Chem. 1984, 88, 99−
101.
(41) Hoare, J. P. Standard Potentials in Acqueous Solution; Bard, A. J.,
Parsons, R., Eds.; IUPAC: New York, NY, 1985; pp 49−63.
(42) Cheng, J.; Sulpizi, M.; VandeVondele, J.; Sprik, M.
ChemCatChem 2012, 4, 636−640.
(43) Liu, F.; Concepcion, J. J.; Jurss, J. W.; Cardolaccia, T.;
Templeton, J. L.; Meyer, T. J. Inorg. Chem. 2008, 47, 1727−1752.
(44) Alibabaei, L.; Brennaman, M. K.; Norris, M. R.; Kalanyan, B.;
Song, W.; Losego, M. D.; Concepcion, J. J.; Binstead, R. A.; Parsons,
G. N.; Meyer, T. J. Proc. Natl. Acad. Sci. U.S.A. 2013, 110, 20008−
20013.
Journal of the American Chemical Society Article
dx.doi.org/10.1021/ja503603k | J. Am. Chem. Soc. 2014, 136, 10632−1063910639

More Related Content

What's hot

The effect of hydraulic structure on aeration performance
 The effect of hydraulic structure on aeration performance  The effect of hydraulic structure on aeration performance
The effect of hydraulic structure on aeration performance Alexander Decker
 
Retention Behavior of Lead Ion in Soil Bentonite Liner
Retention Behavior of Lead Ion in Soil Bentonite LinerRetention Behavior of Lead Ion in Soil Bentonite Liner
Retention Behavior of Lead Ion in Soil Bentonite LinerIJERA Editor
 
Slug Test Procedures
Slug Test ProceduresSlug Test Procedures
Slug Test Procedurestpttk
 
Reduction of cu o and cu2o with h2 h embedding and kinetics effects in the ...
Reduction of cu o and cu2o with h2   h embedding and kinetics effects in the ...Reduction of cu o and cu2o with h2   h embedding and kinetics effects in the ...
Reduction of cu o and cu2o with h2 h embedding and kinetics effects in the ...Luciana Pirone
 
Factors affecting Gold Recovery from Secondary Ore_Tatenda
Factors affecting Gold Recovery from Secondary Ore_TatendaFactors affecting Gold Recovery from Secondary Ore_Tatenda
Factors affecting Gold Recovery from Secondary Ore_TatendaTatenda Chingosho
 
Poster_Electrocoagulation Final Version
Poster_Electrocoagulation Final VersionPoster_Electrocoagulation Final Version
Poster_Electrocoagulation Final VersionJabari Lee, E.I.T
 
Integrated Electrodialysis Membrane Stability Results for Cost-Effective CBM ...
Integrated Electrodialysis Membrane Stability Results for Cost-Effective CBM ...Integrated Electrodialysis Membrane Stability Results for Cost-Effective CBM ...
Integrated Electrodialysis Membrane Stability Results for Cost-Effective CBM ...Paula Moon, Ph.D.
 
Mass transfer coefficient evaluation for lab scale fermenter using sodium sul...
Mass transfer coefficient evaluation for lab scale fermenter using sodium sul...Mass transfer coefficient evaluation for lab scale fermenter using sodium sul...
Mass transfer coefficient evaluation for lab scale fermenter using sodium sul...Alexander Decker
 

What's hot (19)

David diaspora
David diasporaDavid diaspora
David diaspora
 
The effect of hydraulic structure on aeration performance
 The effect of hydraulic structure on aeration performance  The effect of hydraulic structure on aeration performance
The effect of hydraulic structure on aeration performance
 
Retention Behavior of Lead Ion in Soil Bentonite Liner
Retention Behavior of Lead Ion in Soil Bentonite LinerRetention Behavior of Lead Ion in Soil Bentonite Liner
Retention Behavior of Lead Ion in Soil Bentonite Liner
 
Novak2012
Novak2012Novak2012
Novak2012
 
A novel approach for Zeolite-based Materials for Gas Sensors
A novel approach for Zeolite-based Materials for Gas Sensors A novel approach for Zeolite-based Materials for Gas Sensors
A novel approach for Zeolite-based Materials for Gas Sensors
 
Catalysts 08-00063
Catalysts 08-00063Catalysts 08-00063
Catalysts 08-00063
 
2015-Moosa-CNTs
2015-Moosa-CNTs2015-Moosa-CNTs
2015-Moosa-CNTs
 
Slug Test Procedures
Slug Test ProceduresSlug Test Procedures
Slug Test Procedures
 
3.pdf
3.pdf3.pdf
3.pdf
 
Temperature effect on phase transition radiation of water
Temperature effect on phase transition radiation of waterTemperature effect on phase transition radiation of water
Temperature effect on phase transition radiation of water
 
Reduction of cu o and cu2o with h2 h embedding and kinetics effects in the ...
Reduction of cu o and cu2o with h2   h embedding and kinetics effects in the ...Reduction of cu o and cu2o with h2   h embedding and kinetics effects in the ...
Reduction of cu o and cu2o with h2 h embedding and kinetics effects in the ...
 
Factors affecting Gold Recovery from Secondary Ore_Tatenda
Factors affecting Gold Recovery from Secondary Ore_TatendaFactors affecting Gold Recovery from Secondary Ore_Tatenda
Factors affecting Gold Recovery from Secondary Ore_Tatenda
 
Poster_Electrocoagulation Final Version
Poster_Electrocoagulation Final VersionPoster_Electrocoagulation Final Version
Poster_Electrocoagulation Final Version
 
ICEPR167
ICEPR167ICEPR167
ICEPR167
 
APGC-MS, ASAP-MS, and MAI-MS: Expanding the Horizons of API-MS
APGC-MS, ASAP-MS, and MAI-MS: Expanding the Horizons of API-MSAPGC-MS, ASAP-MS, and MAI-MS: Expanding the Horizons of API-MS
APGC-MS, ASAP-MS, and MAI-MS: Expanding the Horizons of API-MS
 
pH and Soil pH
pH and Soil pHpH and Soil pH
pH and Soil pH
 
Integrated Electrodialysis Membrane Stability Results for Cost-Effective CBM ...
Integrated Electrodialysis Membrane Stability Results for Cost-Effective CBM ...Integrated Electrodialysis Membrane Stability Results for Cost-Effective CBM ...
Integrated Electrodialysis Membrane Stability Results for Cost-Effective CBM ...
 
pH of soil
pH of soilpH of soil
pH of soil
 
Mass transfer coefficient evaluation for lab scale fermenter using sodium sul...
Mass transfer coefficient evaluation for lab scale fermenter using sodium sul...Mass transfer coefficient evaluation for lab scale fermenter using sodium sul...
Mass transfer coefficient evaluation for lab scale fermenter using sodium sul...
 

Similar to ja503603k

Carbon corrosion and platinum nanoparticles ripening under open circuit poten...
Carbon corrosion and platinum nanoparticles ripening under open circuit poten...Carbon corrosion and platinum nanoparticles ripening under open circuit poten...
Carbon corrosion and platinum nanoparticles ripening under open circuit poten...LandimarMendesDuarte
 
Hydrogen Permeation as a Tool for Quantitative Characterization of Oxygen Red...
Hydrogen Permeation as a Tool for Quantitative Characterization of Oxygen Red...Hydrogen Permeation as a Tool for Quantitative Characterization of Oxygen Red...
Hydrogen Permeation as a Tool for Quantitative Characterization of Oxygen Red...Vijayshankar Dandapani, PhD
 
Clase 3.cinetica del proceso corrosivo
Clase 3.cinetica del proceso corrosivoClase 3.cinetica del proceso corrosivo
Clase 3.cinetica del proceso corrosivoCornelioMartinez1
 
lecture 1.pptx
lecture 1.pptxlecture 1.pptx
lecture 1.pptxAhmed43480
 
detailed-scientific-explanations-of-the-electrolysis-of-water-magnetic-effect...
detailed-scientific-explanations-of-the-electrolysis-of-water-magnetic-effect...detailed-scientific-explanations-of-the-electrolysis-of-water-magnetic-effect...
detailed-scientific-explanations-of-the-electrolysis-of-water-magnetic-effect...Daniel Donatelli
 
Cyclic Voltammetry: Principle, Instrumentation & Applications
Cyclic Voltammetry: Principle, Instrumentation & ApplicationsCyclic Voltammetry: Principle, Instrumentation & Applications
Cyclic Voltammetry: Principle, Instrumentation & ApplicationsAnu Radha
 
2010 High density hydrogen storage in nanocavities
2010 High density hydrogen storage in nanocavities2010 High density hydrogen storage in nanocavities
2010 High density hydrogen storage in nanocavitiesJorge Roque de la Puente
 
Electrochemical Characterization of Electrocatalysts .pptx
Electrochemical Characterization of Electrocatalysts .pptxElectrochemical Characterization of Electrocatalysts .pptx
Electrochemical Characterization of Electrocatalysts .pptxMabrook Saleh Amer
 
Recent advancements in tuning the electronic structures of transitional metal...
Recent advancements in tuning the electronic structures of transitional metal...Recent advancements in tuning the electronic structures of transitional metal...
Recent advancements in tuning the electronic structures of transitional metal...Pawan Kumar
 
dynamicchemistryatthecatalyticinterface-190304061810.pdf
dynamicchemistryatthecatalyticinterface-190304061810.pdfdynamicchemistryatthecatalyticinterface-190304061810.pdf
dynamicchemistryatthecatalyticinterface-190304061810.pdfQamarIqbal50
 
Transient Absorption Spectrometry in Photoelectrochemical Splitting of Water
Transient Absorption Spectrometry  in Photoelectrochemical Splitting of Water Transient Absorption Spectrometry  in Photoelectrochemical Splitting of Water
Transient Absorption Spectrometry in Photoelectrochemical Splitting of Water RunjhunDutta
 
Edge-confined under-coordinated Cu atoms on Ru nanosheets enable efficient CH...
Edge-confined under-coordinated Cu atoms on Ru nanosheets enable efficient CH...Edge-confined under-coordinated Cu atoms on Ru nanosheets enable efficient CH...
Edge-confined under-coordinated Cu atoms on Ru nanosheets enable efficient CH...Pawan Kumar
 
Juornal of Physics Condensed Matter - Article I
Juornal of Physics Condensed Matter - Article IJuornal of Physics Condensed Matter - Article I
Juornal of Physics Condensed Matter - Article IRossen Hristov
 
Determination of the hydrogen coefficient diffusion DH in the MmNi3.55Mn0.4Al...
Determination of the hydrogen coefficient diffusion DH in the MmNi3.55Mn0.4Al...Determination of the hydrogen coefficient diffusion DH in the MmNi3.55Mn0.4Al...
Determination of the hydrogen coefficient diffusion DH in the MmNi3.55Mn0.4Al...AI Publications
 

Similar to ja503603k (20)

nchem.2497
nchem.2497nchem.2497
nchem.2497
 
Carbon corrosion and platinum nanoparticles ripening under open circuit poten...
Carbon corrosion and platinum nanoparticles ripening under open circuit poten...Carbon corrosion and platinum nanoparticles ripening under open circuit poten...
Carbon corrosion and platinum nanoparticles ripening under open circuit poten...
 
Hydrogen Permeation as a Tool for Quantitative Characterization of Oxygen Red...
Hydrogen Permeation as a Tool for Quantitative Characterization of Oxygen Red...Hydrogen Permeation as a Tool for Quantitative Characterization of Oxygen Red...
Hydrogen Permeation as a Tool for Quantitative Characterization of Oxygen Red...
 
Clase 3.cinetica del proceso corrosivo
Clase 3.cinetica del proceso corrosivoClase 3.cinetica del proceso corrosivo
Clase 3.cinetica del proceso corrosivo
 
lecture 1.pptx
lecture 1.pptxlecture 1.pptx
lecture 1.pptx
 
Understanding Dynamic chemistry at the Catalytic Interface
Understanding Dynamic chemistry at the Catalytic InterfaceUnderstanding Dynamic chemistry at the Catalytic Interface
Understanding Dynamic chemistry at the Catalytic Interface
 
detailed-scientific-explanations-of-the-electrolysis-of-water-magnetic-effect...
detailed-scientific-explanations-of-the-electrolysis-of-water-magnetic-effect...detailed-scientific-explanations-of-the-electrolysis-of-water-magnetic-effect...
detailed-scientific-explanations-of-the-electrolysis-of-water-magnetic-effect...
 
detailed-scientific-explanations-of-the-electrolysis-of-water-magnetic-effect...
detailed-scientific-explanations-of-the-electrolysis-of-water-magnetic-effect...detailed-scientific-explanations-of-the-electrolysis-of-water-magnetic-effect...
detailed-scientific-explanations-of-the-electrolysis-of-water-magnetic-effect...
 
Cyclic Voltammetry: Principle, Instrumentation & Applications
Cyclic Voltammetry: Principle, Instrumentation & ApplicationsCyclic Voltammetry: Principle, Instrumentation & Applications
Cyclic Voltammetry: Principle, Instrumentation & Applications
 
2010 High density hydrogen storage in nanocavities
2010 High density hydrogen storage in nanocavities2010 High density hydrogen storage in nanocavities
2010 High density hydrogen storage in nanocavities
 
Maryam Bachelor thesis
Maryam Bachelor thesisMaryam Bachelor thesis
Maryam Bachelor thesis
 
Electrochemical Characterization of Electrocatalysts .pptx
Electrochemical Characterization of Electrocatalysts .pptxElectrochemical Characterization of Electrocatalysts .pptx
Electrochemical Characterization of Electrocatalysts .pptx
 
Recent advancements in tuning the electronic structures of transitional metal...
Recent advancements in tuning the electronic structures of transitional metal...Recent advancements in tuning the electronic structures of transitional metal...
Recent advancements in tuning the electronic structures of transitional metal...
 
dynamicchemistryatthecatalyticinterface-190304061810.pdf
dynamicchemistryatthecatalyticinterface-190304061810.pdfdynamicchemistryatthecatalyticinterface-190304061810.pdf
dynamicchemistryatthecatalyticinterface-190304061810.pdf
 
Transient Absorption Spectrometry in Photoelectrochemical Splitting of Water
Transient Absorption Spectrometry  in Photoelectrochemical Splitting of Water Transient Absorption Spectrometry  in Photoelectrochemical Splitting of Water
Transient Absorption Spectrometry in Photoelectrochemical Splitting of Water
 
Cat
CatCat
Cat
 
Edge-confined under-coordinated Cu atoms on Ru nanosheets enable efficient CH...
Edge-confined under-coordinated Cu atoms on Ru nanosheets enable efficient CH...Edge-confined under-coordinated Cu atoms on Ru nanosheets enable efficient CH...
Edge-confined under-coordinated Cu atoms on Ru nanosheets enable efficient CH...
 
Supporting electrolyte
Supporting electrolyteSupporting electrolyte
Supporting electrolyte
 
Juornal of Physics Condensed Matter - Article I
Juornal of Physics Condensed Matter - Article IJuornal of Physics Condensed Matter - Article I
Juornal of Physics Condensed Matter - Article I
 
Determination of the hydrogen coefficient diffusion DH in the MmNi3.55Mn0.4Al...
Determination of the hydrogen coefficient diffusion DH in the MmNi3.55Mn0.4Al...Determination of the hydrogen coefficient diffusion DH in the MmNi3.55Mn0.4Al...
Determination of the hydrogen coefficient diffusion DH in the MmNi3.55Mn0.4Al...
 

ja503603k

  • 1. How Surface Potential Determines the Kinetics of the First Hole Transfer of Photocatalytic Water Oxidation Matthias M. Waegele,† Xihan Chen,† David M. Herlihy,† and Tanja Cuk*,†,‡ † Department of Chemistry, University of California, Berkeley, Berkeley, California 94720, United States ‡ Chemical Sciences Division, Lawrence Berkeley National Laboratory, Berkeley, California 94720, United States *S Supporting Information ABSTRACT: Interfacial hole transfer between n-SrTiO3 and OH− was investigated by surface sensitive transient optical spectroscopy of an in situ photoelectrochemical cell during water oxidation. The kinetics reveal a single rate constant with an exponential dependence on the surface hole potential, spanning time scales from 3 ns to 8 ps over a ≈1 V increase. A voltage- and laser illumination-induced process moves the valence band edge at the n-type semiconductor/water interface to continuously change the surface hole potential. This single step of the water oxidation reaction is assigned to the first hole transfer h+ + OH− → OH• . The kinetics quantify how much a change in the free energy difference driving this first hole transfer reduces the activation barrier. They are also used to extrapolate the kinetic rate due to the activation barrier when that free energy difference is zero, or the Nernstian potential. This is the first time transient spectroscopy has enabled the separation of the first hole transfer from the full four hole transfer cycle and a direct determination of these two quantities. The Nernstian potential for OH− /OH• is also suggested, in rough agreement with gas-phase studies. The observation of a distinct, much longer time scale upon picosecond hole transfer to OH− suggests that a dominant, more stable intermediate of the water oxidation reaction, possibly a surface bound oxo, may result. ■ INTRODUCTION Water oxidation at solid metal oxide photocatalysts of earth abundant metals is a highly selective heterogeneous chemical reaction for O2 evolution whose mechanism is of intense current interest.1−16 The motivation to understand this catalytic process step-by-step is based on the fact that it is an indispensable part of any renewable fuel forming reaction, and solid oxides are particularly active catalyst materials. Insights gained from uncovering elementary charge-transfer processes and how they couple to chemical transformation at the catalyst/water interface are key for the design of more efficient catalysts. As suggested by calibrated photochemical studies, the full cycle involves four hole transfers from the catalyst to water.4,17,18 Under basic conditions, hydroxyl groups are more easily oxidized, such that + → ++ − 4h 4OH O 2H O2 2 (1) The challenge is to follow the kinetics of each hole transfer and the formation and lifetime of the intermediate species of the catalytic cycle that result. In turn, this will identify the hole transfer(s) that limit the reaction rate and the more facile hole transfer(s) that dynamically alter the catalytic surface for the rate limiting step(s). In photochemical or electrochemical studies, the dependence of steady-state product evolution on the free energy difference driving the hole transfer is used to extract activation barriers.6,15 While providing insight into the mechanism, these steady-state studies are highly model dependent for multistep reactions.19,20 Only the transient response of the photodriven water oxidation reaction can directly step through a catalytic cycle. In particular, ultrafast spectroscopy, by following the reaction from time zero can most readily differentiate the kinetics of the disparate physical processes involved. The initial step in the cycle is the first hole transfer and is suggested to involve the following reaction in basic conditions: + →+ − • h OH OH (2) where OH• is a hydroxyl radical that may either be bound to a metal ion at the surface or be free in solution. A more stable metal oxo intermediate is likely to be formed from this unstable radical, as suggested by steady-state electrochemical stud- ies3,6,15,21,22 and the recent millisecond time scale infrared studies that saw the oxo intermediate directly.8,16 Ultrafast transient optical spectroscopy of the photodriven water oxidation reaction at the n-type semiconductor/water interface in principle could follow the kinetics of this first hole transfer. Here, the photogenerated holes are efficiently separated within the semiconductor and sent to the aqueous interface at femtosecond time scales, defining the starting point of the cycle. However, so far, the kinetics that apply to the first hole transfer have not been differentiated from subsequent Received: April 10, 2014 Published: July 16, 2014 Article pubs.acs.org/JACS © 2014 American Chemical Society 10632 dx.doi.org/10.1021/ja503603k | J. Am. Chem. Soc. 2014, 136, 10632−10639
  • 2. kinetic steps. Transient optical spectroscopy has assigned a range of interfacial hole transfer time constants from 500 ps1,2 to hundreds of ms4,7 at the n-TiO2 and n-Fe3O4 aqueous interfaces. Many of these studies were conducted under conditions where the quantum efficiency of O2 evolution is low (0.1% to 5%),4,10 such that the true interfacial kinetics is difficult to separate from electron−hole recombination kinetics within the semiconductor. Further, these studies were conducted at a single surface hole potential, determined by the valence band edge at the aqueous interface.23−27 Therefore, the kinetics could not be followed as a function of the free energy difference between the reactants and products. This prevents attributing the kinetics to a single step of the reaction and understanding its activation barrier through a tunable free energy. Herein we report on transient optical spectroscopy of n- SrTiO3 in an in situ electrochemical cell under conditions of high quantum efficiency (>75%) and surface sensitivity (≈25 nm) that reveals the kinetics of interfacial hole transfer as a function of the surface hole potential. n-SrTiO3 is a representative transition metal oxide-based photoanode and is ideally suited for time-resolved pump−probe spectroscopy due to its high-quantum efficiency for O2 evolution with 300 nm excitation. Continuous tuning of the surface hole potential on the electrochemical cell is achieved by a voltage- and laser- induced process26,28 that moves the position of the valence band edge at the aqueous interface with the applied potential on the electrochemical cell. The kinetics reveal a single rate constant with an exponential dependence on the surface hole potential, spanning time scales from 3 ns to 8 ps over a ≈1 V increase. This indicates that we are mapping an activation barrier for a single step of the water oxidation reaction, differentiating the first hole transfer from the rest. The activation barrier for this first hole transfer, suggested to be the OH− /OH• reaction, is quantified by a hole transfer coefficient, α, that determines how efficiently increasing the free energy difference reduces the activation barrier and by a rate constant, k0, that relates to its magnitude when the free energy difference is zero, or the Nernstian potential. Further, the data also suggest a Nernstian potential for the OH− /OH• reaction in solution that is in rough agreement with gas-phase studies in a hydrated environment, supporting the assignment of reaction 2 to the initial step of the water oxidation reaction and to the kinetics being probed here. Following the first hole transfer, the kinetics reveal a much longer time scale, possibly related to the formation of a metal oxo intermediate and further showing that multiple steps of the cycle can be differentiated. ■ EXPERIMENTAL PROCEDURES The 0.7% and 0.08% Nb-doped SrTiO3 by weight (henceforth referred to as 0.7% and 0.1%, respectively) single crystals with crystallographic orientation (100) were obtained from MTI Corp. (Richmond, CA). The crystals were 0.5 mm thick with polished front sides (Ra < 5 Å) and unpolished back sides. All spectroscopic measurements were performed on the polished front sides. The optical constants of Nb-doped SrTiO3 were derived from spectroscopic ellipsometry measurements recorded on a Horiba Jobin- Yvon UVISEL Ellipsometer (Horiba, Edison, NJ). The spectra were taken in reflection mode in air at a 70° angle of incidence. All spectroelectrochemical measurements were performed in a Teflon electrochemical cell with CaF2 optical windows (3 mm thick). The electrolyte was a ≈0.1 M aqueous solution of sodium hydroxide for all experiments, unless otherwise noted. To avoid formation of laser-induced air bubbles during pump−probe experiments, electrolyte solutions were briefly degassed under vacuum before commencing experimental measurements. The amount of laser light was insufficient to generate a macroscopically observable O2 bubble. Bubble formation was solely due to above-band gap excitation of SrTiO3, which heated the solution in the vicinity of the semiconductor/electrolyte interface, thereby liberating dissolved gases. The electrolyte was in contact with the atmosphere during measurements. The potential of the n-SrTiO3 working electrode with respect to an Ag/AgCl reference electrode (MF-2052; Basi, West Lafayette, IN) was controlled by a CHI1140B Potentiostat (CH Instruments, Austin, TX). A Pt wire served as the counter electrode. Ohmic contact between the unpolished n-SrTiO3 back side and copper wire was established using silver paste (Electron Microscopy Sciences, Hatfield, PA). For the transient reflectance experiments, an insulating lacquer covered all surfaces except the polished front side of the crystal. The exposed front surface areas of the 0.1% and 0.7% Nb-doped samples were ≈25 and ≈50 mm2 , respectively. For differential capacitance measurements, the exposed front side area was matched to the Gaussian laser spot size of ≈1 mm2 (fwhm). Differential capacitance measurements were carried out using ac voltammetry. The dc potential was swept from positive to negative applied potentials. The ac amplitude and frequency were 0.025 V and 100 Hz, respectively. For the transient reflectance experiments, the pump and probe beams were derived from a regeneratively amplified Ti:sapphire laser system (Coherent Legend; Coherent, Inc., Santa Clara, CA) producing output pulses with a center wavelength of 800 nm and ≈150 fs temporal width at a 1 kHz repetition rate. Part of the amplifier output was directed into an optical parametric amplifier (OPerA-SOLO; Light Conversion, Vilnius, Lithuania) for generation of laser pump pulses at 300 nm. The s-polarized 800 nm probe beam was directed onto the sample at a 45° incident angle. The pump beam, perpendicularly polarized to the probe beam, was incident normal to the sample surface. After the sample, the reflected probe beam was focused into an optical fiber, which was coupled to a CCD array spectrometer (CAM- VIS-3; Ultrafast Systems, LLC, Sarasota, FL). In all experiments, the pump beam was modulated by a mechanical chopper (3501; Newport, Inc., Irvine, CA) at a frequency of 500 Hz. The detector output was interfaced with a personal computer, which provided automated control over an optical pump−probe delay stage (MTM250CC1; Newport, Inc., Irvine, CA). Typical pump-induced reflectance changes (ΔR/R) were on the order of 0.8 mOD. The typical incident pump fluence was about 0.045 mJ cm−2 , corresponding to carrier densities on the order of 1019 cm−3 . The excitation beam spot size was ≈500 μm (fwhm). Under conditions of 150 fs pulsed laser excitation and current flow, the sample damages. The damage was investigated by scanning electron microscopy (Figure S1, Supporting Information). While otherwise displaying the flat surface of the single crystal sample, the images show pits in the sample on the order of 5−10 μm in diameter covering about 15% of the surface. These randomly located pits indicate ablation of the material. The most commonly reported cause of such laser-induced material ablation is Coulomb explosion.29,30 In this process, enough charge is deposited in the material such that bonds are broken. In our experimental conditions, each laser pulse produces ≈1019 holes/cm3 in the depletion layer that could cause bond breaking if the same area is traversed by subsequent pulses and the water oxidation reaction has not yet depleted the stored charge. To minimize this damage, the transient experiments were performed on a moving sample at each time point at open circuit conditions, where no damage took place, and closed circuit conditions of current flow, where damage did take place. The overall voltammogram did not appreciably change during the course of the experiment, indicating that the catalyst was chemically stable and further signifying that the damage was caused by a physical process in which microscopic pieces of materials are explosively removed, and not due to a progressive chemical reaction consuming the electrode material. Indeed, previous experiments on n-SrTiO3 with high current densities performed over many hours do not exhibit chemical photocorrosion in basic conditions.31,32 Journal of the American Chemical Society Article dx.doi.org/10.1021/ja503603k | J. Am. Chem. Soc. 2014, 136, 10632−1063910633
  • 3. ■ RESULTS Steady-State Current: O2 Evolution. n-SrTiO3 is a model system for studying the kinetics of O2 evolution by transient optical spectroscopy. It exhibits a near ideal photoinduced current for an n-type semiconductor and a very high quantum efficiency for the reaction. Since the kinetic measurements herein focus on 0.1% Nb-doped SrTiO3, we primarily report on that sample and use 0.7% Nb-doped SrTiO3 to verify the trends in the data. Figure 1a shows the results of steady-state current measure- ments with n-SrTiO3 as the photoanode in an electrochemical cell in the dark and with 500 Hz, 150 fs laser excitation at 300 nm. The current versus voltage curve exhibits an ideal diode- like behavior. For cathodic voltages more negative than −0.8 V the n-type semiconductor is in a forward bias regime where the surface electric field that separates the electron−hole pairs (depletion layer) decreases in width and the current exponentially decays to zero. Under anodic voltages, the semiconductor is largely in a reverse-bias regime where the width of the depletion layer is maximized and the anodic current is largely potential-independent. Both the shape of this curve and the quantum efficiency of the photocurrent (>75%), defined as the ratio of the photocurrent to the absorbed light flux, are similar to that obtained with a continuous xenon lamp source (Figure 1b and Figure S2, Supporting Information). The photocurrent measurements are conducted in a regime of high pH (11− 14), where the steady-state current is independent of pH and not considered mass diffusion limited (Figure S3, Supporting Information).19 The high quantum efficiency is achieved by ensuring that the excitation absorption depth, d = λ/4πκ, where λ is the excitation wavelength and κ is the imaginary part of the refractive index, is smaller than or equal to the width of the depletion layer. As shown in Figure 1b, where the quantum efficiency is plotted together with the index of refraction as a function of wavelength, the quantum efficiency closely follows κ. Using the Schottky approximation for the n-type semi- conductor/liquid interface, the depletion width is given according to27 = ϵϵ | | − | | ⎛ ⎝ ⎜ ⎞ ⎠ ⎟W e N U k T e 2 0 0 d SC B 0 (3) where Nd, ϵ0, ϵ, e0, kB, and T represent the doping density, the vacuum permittivity, the dielectric constant of the semi- conductor, the electronic charge, the Boltzmann constant, and the absolute temperature, respectively. Using a value of 0.85 V for the voltage drop in the semiconductor (USC) determined by photovoltage measurements described below, the depletion width is calculated to be ≈25 nm and matches the absorption depth, d, of 300 nm light. Helmholtz Voltage: Valence Band Edge Motion. At the solid/liquid interface of an n-type semiconductor, any voltage drop across the interface is distributed across both the semiconductor depletion layer (USC) and the Helmholtz layer (UH) as shown in Figure 2.23−27 The Helmholtz layer comes from negative ions in the liquid screening the positive charge in the semiconductor,23−25 forming a very thin parallel plate capacitor at the interface. UH is therefore defined to be the voltage drop between the valence band edge potential at the interface and the solution potential. In an electrochemical cell, the voltage drop comes from both the applied voltage (Uappl) and the flatband voltage determined by equilibration of the chemical potentials of the semiconductor and the liquid (Ufb), leading to the following equation:24,25 − = +U U U Uappl fb H SC (4) How the voltage is distributed across the semiconductor depletion region and the Helmholtz layer will depend on the capacitances associated with each (CSC, CH). Whenever UH changes, the position of the valence band edge moves and changes the surface hole potential. Here, we find UH for the Figure 1. (a) Current−voltage curves of n-SrTiO3 with and without laser irradiation. The blue arrows indicate the voltages at which transient kinetics were measured. The inset shows the quantum efficiency under laser irradiation. (b) Imaginary (κ) and real (n) parts of the complex index of refraction of n-SrTiO3. The open circles show the quantum efficiency (Q.E.) of the photocurrent at Uappl = 0 V. The output of a monochromatized xenon lamp was used as an excitation source. The arrows indicate the excitation wavelength (300 nm) and probe wavelength (800 nm) employed in the time-resolved experiments. Figure 2. Diagram of the distribution of voltage between the Helmholtz capacitance (CH) and semiconductor (depletion layer) capacitance (CSC). Journal of the American Chemical Society Article dx.doi.org/10.1021/ja503603k | J. Am. Chem. Soc. 2014, 136, 10632−1063910634
  • 4. electrochemical conditions that apply to the in situ transient spectroscopy, namely a variable Uappl and high laser intensity. At equilibrium, where Uappl = 0 V, and in the dark, UH can be determined experimentally. As shown in Figure S4, Supporting Information, Mott−Schottky plots of the capacitance determine Ufb to be −1.52 V and photovoltage measurements determine USC to be 0.85 V. Together with eq 4, these measurements determine UH to be 0.67 V. A detailed description of the methods used to determine these quantities are provided in the Supporting Information. Similar assessments have recently been made for another n-type semiconductor, Fe2O3.33 Intense light excitation alters the distribution of the voltage drop across CSC and CH. This is shown by the fact that the capacitance changes dramatically upon light excitation (Figure S5, Supporting Information). Rather than simply decreasing as the applied anodic voltage becomes less negative, as it does in the dark, the capacitance starts increasing beyond an anodic voltage intermediate between the flatband voltage (−1.52 V) and the photocurrent onset (−0.85 V, see Figure 1a). A detailed description of these measurements are provided in the Supporting Information. As depicted in Figure 3a, there are two types of surface charge densities (holes/cm2 ) that contribute to the voltage-dependent capacitance in the semiconductor: qSC, the hole density in the depletion layer dependent on USC, and qPHOTO, induced by the laser pulse. Under laser excitation, the voltage drop that is present in the semiconductor under dark conditions is zeroed out by qPHOTO, i.e., the semiconductor bands are flattened under illumination. As shown by the fast saturation of the photovoltage (Figure S4b, Supporting Information), very small laser fluences completely flatten the bands. This measurement indicates that only a small fraction of the photoinduced charge annihilates the voltage drop in the semiconductor, while most of the holes end up creating a thin, p-type layer at the interface that increases UH. This carrier inversion process has been seen previously to move the valence band edge either as a result of a large number of surface defects34 or under illumination,28 as observed here. Given the significant effect of these excess holes at the interface, UH is a result of both qPHOTO and qSC screened by negatively charged ions in solution: = +U q q C( )/H SC PHOTO H (5) This construction has been applied successfully previ- ously23,35 for excess surface states and assumes a voltage- independent capacitance CH. Here, qPHOTO is obtained from the absorbed laser fluence and qSC is given within the Schottky approximation by = ϵϵ | | − | | ⎛ ⎝ ⎜ ⎞ ⎠ ⎟q e N U k T e 2SC 0 0 d SC B 0 (6) UH can be self-consistently calculated from eqs 4, 5, and 6 for a variable Uappl and qPHOTO to match the conditions of the in situ transient spectroscopy. CH was determined from the equilibrium measurements in the dark, when Uappl and qPHOTO are both zero. A USC = 0.85 V and UH = 0.67 V give a CH of 21 μF/cm2 . A detailed description of the methods used to determine these quantities is provided in the Supporting Information. Figure 3b shows the results of the calculation for the 0.1% doped sample (2.66 × 10¹⁹ carriers/cm3 ) at Uappl = 0 V and a variable qPHOTO. At low qPHOTO, the distribution across UH and USC is essentially the same as in the dark at equilibrium. However, beyond a certain qPHOTO, UH increases substantially while USC concomitantly lowers. At the absorbed fluence used in the transient spectroscopy, 0.045 mJ/cm2 , ≈70% of the total Ufb drops across UH. Figure 4a shows how the magnitude of UH changes as a function of Uappl for this laser fluence, at a somewhat higher laser fluence, and in the dark. While UH increases roughly linearly with Uappl in the dark as well as under illumination, UH is substantially higher and increases more strongly with Uappl under illumination. The two laser fluences show that variations in qPHOTO in this fluence regime have only a moderate effect on how UH depends on Uappl. Figure 4b depicts the motion of the valence band edge with UH(Uappl). UH(Uappl) will be used to map how changes in the surface hole potential modulate the kinetics in the transient spectroscopy experiments. In addition to showing how the valence band edge moves with Uappl, UH(Uappl) itself can be interpreted as the reaction free energy of reaction 2, as will be discussed further below. With the absolute potential of the valence band edge at equilibrium as a reference,36 UH(Uappl) determines the free energy difference between interfacial holes and O2 evolution, or the overpotential η as described in the Supporting Information. As shown in Figure 4a, the over- potential ranges from ≈1.3 to 2.1 V for the laser fluences and applied potentials used in the in situ transient spectroscopy. This range is accessed by many n-type semiconductors used for photocatalytic water oxidation, characterized by low lying valence bands36 with respect to the water oxidation potential, whether excited by UV or visible light.33 Open Circuit Kinetics of Interfacial Hole Transfer. The transient optical spectroscopy reported here was made sensitive to interfacial hole transfer by operating under conditions where Figure 3. (a) Band diagram showing light-induced carrier inversion at the n-SrTiO3 surface where photogenerated holes change n-SrTiO3 to p- SrTiO3. (b) Calculated Helmholtz voltage (UH) and semiconductor (depletion layer) voltage (USC) as a function of photogenerated charges at the interface at Uappl = 0 V for n-SrTiO3. Journal of the American Chemical Society Article dx.doi.org/10.1021/ja503603k | J. Am. Chem. Soc. 2014, 136, 10632−1063910635
  • 5. (1) essentially all excited electron−hole pairs are separated within the depletion layer and (2) the probe is only sensitive to carrier dynamics within the depletion layer width. The high quantum efficiency (>75%) for photocurrent for excitation wavelengths shorter than 300 nm is indicative of the first condition. To meet the latter condition, the experiments were performed in reflectance with a 45° incident angle. In such a reflectance geometry, the chosen near-infrared probe wave- length (800 nm), sensitive to free carrier excitation, only penetrates ≈25 nm from the surface according to37 d = λ/4πn and the measured index of refraction at 800 nm (Figure 1b). This penetration depth is equivalent to the depletion width for reverse bias conditions. Figure 5a shows that the experimental conditions are in fact sensitive to interfacial charge transfer in 0.1% Nb-doped SrTiO3 by comparing the transient response in aqueous electrolyte (NaOH) and in aqueous NaSCN electrolyte at open circuit. In both cases, we observe negative transient reflectance changes (ΔR) associated with an increase in the absorption of the material following photoexcitation of the semiconductor. Such an increase in absorption at optical frequencies corresponding to energies significantly lower than the band gap is typically assigned to the generation of free carriers, as has been done in SrTiO3 previously.38 Holes are the predominant free carrier generated within the depletion width by the excitation since the electrons are injected into the bulk of the semiconductor by the surface electric field faster than a few picoseconds (Supporting Information). The decrease in absorbance with time is then indicative of free holes leaving the semiconductor through the aqueous interface. As shown by single exponential fits to the kinetics, the transient response in the aqueous NaSCN-electrolyte is three times faster than in the basic aqueous solution. The faster response in the NaSCN-electrolyte is attributed to the lower Nernstian potential for hole transfer to SCN− ,39 a well-known hole scavenger. The significantly faster response in the NaSCN- electrolyte indicates that the interfacial charge transfer of free holes is preferentially being probed in our geometry where the depletion width, the excitation penetration depth, and the probe penetration depth are all matched to 25 nm. When the depletion width is smaller and not matched to the incoming light, as in the case for the 0.7% Nb-doped sample with a depletion width of 9 nm calculated by eq 3, the transient response (Figure 5b) does not change based on the solution potential. The open circuit kinetics in Figure 5 are measured with no leads connecting the counter electrode to the anode. However, this does not imply that a voltage is not applied. From the photovoltage measurements, the pump excitation drops an equivalent of −0.85 V across the semiconductor, zeroing out the equilibrium USC in the dark and flattening the bands. This suggests another way to measure the open circuit kinetics, namely by applying −0.85 V when the circuit is closed. As long as this leads to USC = 0 V, the surface hole potential will be equivalent and guided by UH. UH(Uappl = −0.85 V) is taken from the calculated UH under illumination (Figure 4a) and consistently gives USC = 0 V according to eq 4. This shows that the true open circuit configuration and the circuit that applies −0.85 V between reference and working electrodes have equivalent surface hole potentials. These two circuit config- Figure 4. (a) Calculated Helmholtz voltage (UH) as a function of applied potential with and without laser irradiation. The right-hand axis shows the corresponding overpotential (η) for water oxidation. (b) Graphical definition of interfacial potentials. ϕʼs represent absolute potentials with respect to a reference electrode and Uʼs represent potential differences, or voltage drops. The area shaded in blue indicates the Helmholtz layer. Figure 5. Normalized changes in reflectance, attributed to the decay of photogenerated holes, probed at 800 nm under open circuit conditions. The red lines represent single exponential fits to the data. Zero time delay between pump and probe was shifted to ≈1 ps for display of the data on a logarithmic time scale. Journal of the American Chemical Society Article dx.doi.org/10.1021/ja503603k | J. Am. Chem. Soc. 2014, 136, 10632−1063910636
  • 6. urations yield the same transient response (Figure S6, Supporting Information), which means that the measured kinetics are truly dictated by the surface hole potential. Kinetics of Interfacial Hole Transfer as a Function of Overpotential. We now turn to investigating these interfacial hole transfer kinetics as a function of changes in the surface hole potential due to valence band edge motion. As discussed in the Introduction, we consider the first hole transfer, namely the initial step in the cycle of water oxidation: + →+ − • h OH OH (7) Figure 6 shows the transient response (ΔR) for several representative applied potentials. Additional traces are provided in Figures S7 and S8, Supporting Information. The selected voltages are taken at points where the photocurrent onsets exponentially in the forward bias regime and where the photocurrent becomes potential-independent in the reverse bias regime (Figure 1a). For each voltage, the data could be nicely fit with a single exponential for negative ΔR, attributed to the decay of free holes. Such an exponential time dependence suggests a first order dependence of the above reaction on the concentration of holes. The time constant changes from 3 ns to 8 ps for applied voltages spanning −0.9 to 0.7 V. Figure 6f displays how the logarithm of the rate constant depends on the applied voltage. As shown by the clear linear fit to log(kf), the rate constant exponentially depends on the applied potential and demonstrates that we are measuring the rate of interfacial hole transfer as a function of surface hole potential, tuned by Uappl. The plot can be written in the form of an Arrhenius equation describing the activation barrier to this interfacial hole transfer:19 α= −k k F U U RTexp( ( )/ )f OC appl OC (8) where R is the gas constant, F is the Faraday constant, and α is the phenomenological parameter that describes the shape of the activation barrier. kOC is assigned to the kinetics at open circuit and UOC is the equivalent applied voltage at open circuit conditions or −0.85 V as described in the previous section. As a check to analyzing the data in this way, we use the slope and the intercept of the plot (Uappl = 0 V) in Figure 6f, along with the kinetics measured at open circuit, to independently pull out UOC using the transient kinetics alone. We find that the value agrees with UOC = −0.85 V. This shows that the measured kinetics are truly tied to a potential tuned by the electro- chemical cell in a manner that obeys the Arrhenius law. Figure 6. (a−e) Normalized transient reflectance changes, attributed to the decay of photogenerated holes, probed at 800 nm at the specified Uappl. The red lines are single exponential fits to the data. Zero time delay between pump and probe was shifted to ≈1 ps for display of the data on a logarithmic time scale. (f) Plot of log(kf) vs Uappl. The red line is a linear fit to the data. Figure 7. (a) Plot of log(kf) vs Helmholtz voltage (UH). UH was calculated using an excitation fluence of 0.045 mJ cm−2 as described in the text. The red line is a linear fit to the data. The extracted transfer coefficient (α) is 0.24. (b) Diagram showing the free energy profile of the reaction. Journal of the American Chemical Society Article dx.doi.org/10.1021/ja503603k | J. Am. Chem. Soc. 2014, 136, 10632−1063910637
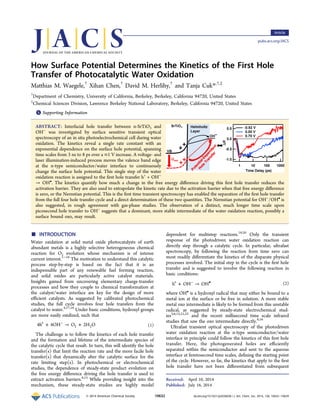
  • 7. While log(kf) is linear with Uappl, the true potential at the surface changes with UH. To obtain a physically meaningful measurement of α, we rescaled the voltage axis in Figure 6f with UH(Uappl) in Figure 4a that determines the surface hole potential. The error in this rescaling of Uappl to UH(Uappl) comes primarily from the error in the measurement of absorbed fluence. The rescaling is therefore done at two absorbed laser fluences, 0.045 mJ/cm2 and 0.065 mJ/cm2 , where the actual absorbed laser fluence is estimated to fall between these two values. Here, the coefficient of the Arrhenius equation is set to be the equilibrium hole transfer rate at UH = 0 V (k0): α=k k FU RTexp( / )f 0 H (9) While k0 is not relevant to the determination of the slope and therefore α, it is an important parameter describing the activation barrier and will be discussed further below. The results are shown in Figure 7a at a laser fluence of 0.045 mJ/cm2 and give an α of 0.24. The results for the laser fluence of 0.065 mJ/cm2 are shown in Figure S9, Supporting Information and give an α of 0.19. Given the uncertainty in the absorbed laser fluence, we report α = 0.20 ± 0.05. This means that only about 20% of the increase in surface hole potential is reflected in a decrease of the activation barrier for the reaction. Such an analysis leads to the asymmetric free energy diagram for interfacial charge transfer shown in Figure 7b. While α is commonly assumed to be 0.5, Marcus theory predicts a value different from 0.5, depending on the relative magnitude of overpotential and solvent reorganizational energy per molecule of reactant at the solid/electrolyte interface.19 While a more detailed interpretation of α on a molecular level is left for future theoretical work, the value of α found here shows the strongly uphill free energy posed by transferring holes from a delocalized, O 2p valence band in the semiconductor to a localized OH− ion at the aqueous interface. We note that the measured kinetics are obtained in a regime of high over- potential for the water oxidation reaction, covering ≈1.3 to 2.1 V (Figure 4a). In this regime, the initial hole transfer is not rate- limiting since changing the surface hole potential does not increase the photoinduced, steady-state current (Figure 1a). In using the calculated UH to determine α from the transient kinetics, only changes in UH coming from the motion of the valence band edge are important. Therefore, α is independent of an assignment of the reaction taking place (reaction 7) and the magnitude of UH. However, such a reaction is suggested by the fast picosecond time scales for hole transfer and the very basic conditions. Since the Helmholtz layer derives from OH− screening the positive charge in the semiconductor, UH is then interpreted as the free energy difference driving the OH− /OH• reaction. Here, the OH− ions are thought of as being located at the outer Helmholtz plane, rather than the inner plane describing directly absorbed species.23 Using a reference for the valence band edge,36 the data imply an absolute Nernstian potential for the OH− /OH• reaction of +1.21 V vs normal hydrogen electrode (NHE) at pH = 13. This value can be compared with that obtained by gas-phase photoemission for the OH− /OH• reaction 1.41 V vs NHE at pH = 1340 as well as the range of values given by Hoare.41 The similarity in these two values supports our assignment of reaction 7 to the measured kinetics. Further, the free energy difference driving the OH− /OH• reaction at equilibrium conditions (Uappl = 0 V) in the dark was calculated for the TiO2 (110) surface to be 0.57 V.42 This can be compared with UH = 0.67 V found experimentally here at equivalent conditions (Figure 4a). It is important to note, however, that the calculation assumes the OH species to be directly bound to the surface. Indeed, it is difficult to determine to what extent the inner Helmholtz rather than the outer Helmholtz layer is the potential difference responsible for the free energy difference, and we leave that as an open question. In interpreting UH as the free energy difference for the OH− / OH• reaction, another parameter can be pulled out from the kinetic data, namely the kinetics of charge transfer at the Nernstian potential of the reaction or UH = 0 V. This entails finding the x-intercept of Figure 7a and gives a value of (6.76 ± 1.50) × 10−7 ps−1 for k0. While α determines the shape of the activation barrier, k0 relates to its magnitude. This value is critical to defining the current of a single step in the water oxidation reaction and would be essential to any model of the full O2 evolving current. To our knowledge, there are no other direct measurements of this value in the literature, likely due to the fact that transient experiments on electrode reactions are scarce. Note, however, that extrapolating the intercept of the linear fit to our data assumes that eq 9 applies at low overpotentials for the water oxidation reaction, not directly accessible in these experiments. The high overpotential range of water oxidation leading to fast, single exponential kinetics at early time scales has allowed for the observation of clear multicomponent kinetics within a short time window. The very fast component (below 2 ps) in the traces at applied potentials higher than 0.2 V (Figure 6) is tentatively attributed to hot hole transfer. At longer time scales, as shown in Figure 6 and in Figure S10, Supporting Information, ΔR changes sign indicating a new physical component to the kinetic response. This kinetic component is characterized by much longer time scales and does not show appreciable decay out to 1.5 ns. The results indicate that we are clearly resolving at least two kinetic components of the multifaceted water oxidation reaction. The observation of a single rate constant exponentially dependent on the surface hole potential that is followed by a second, much longer time scale suggests that a dominant new intermediate of the water oxidation reaction is formed upon picosecond hole transfer to OH− within the Helmholtz layer. One possible intermediate is the surface oxo (O) measured by steady-state infrared and Raman experiments previously.9,16 Recently two types of oxo species, measured at millisecond time scales have been observed on cobalt oxide with transient FTIR spectroscopy.16 Transient optical spectroscopy at ms time scales also indicates the formation of longer lived intermediates.4,7 Future work will apply ultrafast infrared spectroscopy to this system to discover the appearance of the new intermediate that results from the disappearance of holes measured optically and at picosecond time scales here. Here, we observed the kinetics of the first step of the water oxidation reaction in basic conditions, namely picosecond hole transfer to form a hydroxyl radical followed by the formation of a more stable intermediate. For the OH− /OH• reaction, we have quantified for the first time the symmetry of the activation barrier through α and its magnitude through k0 using an Arrhenius equation. We consistently derived a Nernstian potential for the reaction. Such a quantification informs electronic structure calculations that investigate the activation barriers and Nernstian potentials of each hole transfer of the water oxidation cycle.11,13,14,43,44 Journal of the American Chemical Society Article dx.doi.org/10.1021/ja503603k | J. Am. Chem. Soc. 2014, 136, 10632−1063910638
  • 8. ■ ASSOCIATED CONTENT *S Supporting Information SEM images showing laser-induced damage on 0.1% Nb doped SrTiO3. Cyclic voltammograms of 0.1% Nb-doped SrTiO3 in NaOH with and without irradiation by a xenon lamp. Steady- state photocurrent of 0.1% Nb-doped SrTiO3 as a function of electrolyte pH. Mott−Schottky plots of 0.1% Nb-doped and 0.7% Nb-doped SrTiO3 in the dark. Photovoltage measure- ments of 0.1% Nb-doped and 0.7% Nb-doped SrTiO3 as a function of laser fluence. Differential capacitances measure- ments of 0.1% Nb-doped and 0.7% Nb-doped SrTiO3 in 0.1 M Na2SO4 with and without laser irradiation. Kinetics traces for 0.1% Nb-doped SrTiO3 under open circuit condition and with an applied bias of −0.85 V. Additional kinetics traces at various applied potentials. Plot of log(kf) vs Helmholtz potential drop (UH) for a higher fluence. Kinetic traces plotted on a linear time scale. Descriptions of methods used to determine the potential distribution at the semiconductor/liquid interface, the differ- ential capacitance measurements under light excitation, and the determination of overpotentials. Estimation of the drift velocity of holes in the depletion layer. This material is available free of charge via the Internet at http://pubs.acs.org. ■ AUTHOR INFORMATION Corresponding Author tanjacuk@berkeley.edu Notes The authors declare no competing financial interest. ■ ACKNOWLEDGMENTS This material is based upon work supported by the Air Force Office of Scientific Research under AFOSR award no. FA9550- 12-1-0337 and by the Department of Energy Office of Basic Energy Sciences, under the CPIMS program KC030102 (FWP no. CH12CUK1). Work (ellipsometry measurement) at the Molecular Foundry was supported by the Office of Science, Office of Basic Energy Sciences, of the U.S. Department of Energy under contract no. DE-AC02-05CH11231. We thank Adam Schwartzberg for helping us with the ellipsometry measurements. We thank Heinz Frei, Steven Leone, and Gabor Somorjai for critically reading the manuscript and Dunwei Wang for helpful comments on our steady-state measurements. ■ REFERENCES (1) Kasinski, J. J.; Gomez-Jahn, L. A.; Faran, K. J.; Gracewski, S. M.; Miller, R. J. D. J. Chem. Phys. 1989, 90, 1253−1269. (2) Lantz, J. M.; Corn, R. M. J. Phys. Chem. 1994, 98, 9387−9390. (3) Nakamura, R.; Nakato, Y. J. Am. Chem. Soc. 2004, 126, 1290− 1298. (4) Tang, J.; Durrant, J. R.; Klug, D. R. J. Am. Chem. Soc. 2008, 130, 13885−13891. (5) McAlpin, J. G.; Surendranath, Y.; Dincă, M.; Stich, T. A.; Stoian, S. A.; Casey, W. H.; Nocera, D. G.; Britt, R. D. J. Am. Chem. Soc. 2010, 132, 6882−6883. (6) Surendranath, Y.; Kanan, M. W.; Nocera, D. G. J. Am. Chem. Soc. 2010, 132, 16501−16509. (7) Cowan, A. J.; Barnett, C. J.; Pendlebury, S. R.; Barroso, M.; Sivula, K.; Grätzel, M.; Durrant, J. R.; Klug, D. R. J. Am. Chem. Soc. 2011, 133, 10134−10140. (8) Sivasankar, N.; Weare, W. W.; Frei, H. J. Am. Chem. Soc. 2011, 133, 12976−12979. (9) Yeo, B. S.; Bell, A. T. J. Am. Chem. Soc. 2011, 133, 5587−5593. (10) Huang, Z.; Lin, Y.; Xiang, X.; Rodrguez-Córdoba, W.; McDonald, K. J.; Hagen, K. S.; Choi, K.-S.; Brunschwig, B. S.; Musaev, D. G.; Hill, C. L.; Wang, D.; Lian, T. Energy Environ. Sci. 2012, 5, 8923−8926. (11) Su, H.-Y.; Gorlin, Y.; Man, I. C.; Calle-Vallejo, F.; Nørskov, J. K.; Jaramillo, T. F.; Rossmeisl, J. Phys. Chem. Chem. Phys. 2012, 14, 14010−14022. (12) Cooper, J. K.; Ling, Y.; Longo, C.; Li, Y.; Zhang, J. Z. J. Phys. Chem. C 2012, 116, 17360−17368. (13) Liao, P.; Keith, J. A.; Carter, E. A. J. Am. Chem. Soc. 2012, 134, 13296−13309. (14) Bajdich, M.; García-Mota, M.; Vojvodic, A.; Nørskov, J. K.; Bell, A. T. J. Am. Chem. Soc. 2013, 135, 13521−13530. (15) Bediako, D. K.; Surendranath, Y.; Nocera, D. G. J. Am. Chem. Soc. 2013, 135, 3662−3674. (16) Zhang, M.; de Respinis, M.; Frei, H. Nat. Chem. 2014, 6, 362− 367. (17) Harriman, A.; Pickering, I. J.; Thomas, J. M.; Christensen, P. A. J. Chem. Soc., Faraday Trans. 1 1988, 84, 2795−2806. (18) Lin, X.; Hu, X.; Concepcion, J. J.; Chen, Z.; Liu, S.; Meyer, T. J.; Yang, W. Proc. Natl. Acad. Sci. U.S.A. 2012, 109, 15669−15672. (19) Bard, A. J.; Faulkner, L. R. Electrochemical Methods: Fundamentals and Applications, 2nd ed.; Wiley: Hoboken, NJ, 2000. (20) Newman, J.; Thomas-Alyea, K. E. Electrochemical Systems, 3rd ed.; Wiley: Hoboken, NJ, 2004. (21) Jaeger, C. D.; Bard, A. J. J. Phys. Chem. 1979, 83, 3146−3152. (22) Norton, A. P.; Bernasek, S. L.; Bocarsly, A. B. J. Phys. Chem. 1988, 92, 6009−6016. (23) Green, M. J. Chem. Phys. 1959, 31, 200−203. (24) De Gryse, R.; Gomes, W. P.; Cardon, F.; Vennik, J. J. Electrochem. Soc. 1975, 122, 711−712. (25) Uosaki, K.; Kita, H. J. Electrochem. Soc. 1983, 130, 895−897. (26) Cooper, G.; Turner, J. A.; Parkinson, B. A.; Nozik, A. J. J. Appl. Phys. 1983, 54, 6463−6473. (27) van de Krol, R.; Grätzel, M. Photoelectrochemical Hydrogen Production; Springer: New York, NY, 2012; Vol. 102, pp 13−67. (28) Turner, J. A.; Manassen, J.; Nozik, A. J. Appl. Phys. Lett. 1980, 37, 488−491. (29) Stoian, R.; Rosenfeld, A.; Ashkenasi, D.; Hertel, I. V.; Bulgakova, N. M.; Campbell, E. E. B. Phys. Rev. Lett. 2002, 88, 097603. (30) Roeterdink, W. G.; Juurlink, L. B. F.; Vaughan, O. P. H.; Diez, J. D.; Bonn, M.; Kleyn, A. W. Appl. Phys. Lett. 2003, 82, 4190. (31) de Kreuk, C.; de Groot, J.; Mackor, A. Sol. Energy Mater. 1981, 5, 437−444. (32) Bocarsly, A. B.; Bolts, J. M.; Cummins, P. G.; Wrighton, M. S. Appl. Phys. Lett. 1977, 31, 568. (33) Du, C.; Yang, X.; Mayer, M. T.; Hoyt, H.; Xie, J.; McMahon, G.; Bischoping, G.; Wang, D. Angew. Chem., Int. Ed. 2013, 52, 12692− 12695. (34) Bard, A. J.; Bocarsly, A. B.; Fan, F. R. F.; Walton, E. G.; Wrighton, M. S. J. Am. Chem. Soc. 1980, 102, 3671−3677. (35) Bockris, J. O. M.; Khan, S. U. M. Surface Electrochemistry,;- Springer: New York, NY, 1993; Chpt. 2, pp 59−202. (36) Xu, Y.; Schoonen, M. A. A. Am. Mineral. 2000, 85, 543−556. (37) Fishman, I. M.; Marshall, C. D.; Meth, J. S.; Fayer, M. D. J. Opt. Soc. Am. B 1991, 8, 1880−1888. (38) Yamada, Y.; Yasuda, H.; Tayagaki, T.; Kanemitsu, Y. Appl. Phys. Lett. 2009, 95, 121112. (39) Wardman, P. J. Phys. Chem. Ref. Data 1989, 18, 1637−1755. (40) Koppenol, W. H.; Liebman, J. F. J. Phys. Chem. 1984, 88, 99− 101. (41) Hoare, J. P. Standard Potentials in Acqueous Solution; Bard, A. J., Parsons, R., Eds.; IUPAC: New York, NY, 1985; pp 49−63. (42) Cheng, J.; Sulpizi, M.; VandeVondele, J.; Sprik, M. ChemCatChem 2012, 4, 636−640. (43) Liu, F.; Concepcion, J. J.; Jurss, J. W.; Cardolaccia, T.; Templeton, J. L.; Meyer, T. J. Inorg. Chem. 2008, 47, 1727−1752. (44) Alibabaei, L.; Brennaman, M. K.; Norris, M. R.; Kalanyan, B.; Song, W.; Losego, M. D.; Concepcion, J. J.; Binstead, R. A.; Parsons, G. N.; Meyer, T. J. Proc. Natl. Acad. Sci. U.S.A. 2013, 110, 20008− 20013. Journal of the American Chemical Society Article dx.doi.org/10.1021/ja503603k | J. Am. Chem. Soc. 2014, 136, 10632−1063910639