
Recommended
More Related Content
What's hot
Viewers also liked
Viewers also liked (12)
Similar to 2 of 2 UCB Income Statement Projections BUS 63 Viltz, Wren 12:10:15
Similar to 2 of 2 UCB Income Statement Projections BUS 63 Viltz, Wren 12:10:15 (20)
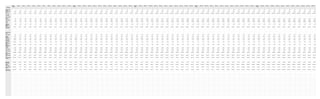
2 of 2 UCB Income Statement Projections BUS 63 Viltz, Wren 12:10:15
- 1. REVENUE Month 1 (2016) Month 2 Month 3 Month 4 Month 5 Month 6 Month 7 Month 8 Month 9 Month 10 Month 11 Month 12 Month 13 2017 Month 14 Month 15 Month 16 Month 17 Month 18 Month 19 Month 20 Month 21 Month 22 Month 23 Month 24 Month 25 2018 Month 26 Month 27 Month 28 Month 29 Month 30 Month 31 Month 32 Month 33 Month 34 Month 35 Month 36 Month 37 2019 Month 38 Month 39 Month 40 Month 41 Month 42 Month 43 Month 44 Month 45 Month 46 Month 47 Month 48 Month 49 2020 Month 50 Month 51 Month 52 Month 53 Month 54 Month 55 Month 56 Month 57 Month 58 Month 59 Month 60 Product sales in units average price / unit total sales EXPENSES cost of goods sold Materials components Labor Facility Storage & distribution (FBA) Total cost of goods sold Administrative costs Office Space Utilities (portion) Equipment Advertising/ Promotion Professional Video Production Office Equipment & Supplies Website WiFi & Phone Miscellaneous Total Administrative Costs Cost of goods sold Total Operating Expense (Expenses) Outgoing $ (Sales) Incoming $ NET PROFIT or LOSS Cumulative Profit or LOSS 1 2 3 4 5 6 7 8 9 10 11 12 13 14 15 16 17 18 19 20 21 22 23 24 30 35 40 45 50 55 60 65 70 75 80 85 90 95 100 105 110 115 120 125 130 135 140 145 150 150 150 150 150 150 150 150 150 150 150 150 19.99 19.99 19.99 19.99 19.99 19.99 19.99 19.99 19.99 19.99 19.99 19.99 19.99 19.99 19.99 19.99 19.99 19.99 19.99 19.99 19.99 19.99 19.99 19.99 19.99 19.99 19.99 19.99 19.99 19.99 19.99 19.99 19.99 19.99 19.99 19.99 19.99 19.99 19.99 19.99 19.99 19.99 19.99 19.99 19.99 19.99 19.99 19.99 19.99 19.99 19.99 19.99 19.99 19.99 19.99 19.99 19.99 19.99 19.99 19.99 $19.99 $39.98 $59.97 $79.96 $99.95 $119.94 $139.93 $159.92 $179.91 $199.90 $219.89 $239.88 $259.87 $279.86 $299.85 $319.84 $339.83 $359.82 $379.81 $399.80 $419.79 $439.78 $459.77 $479.76 $599.70 $699.65 $799.60 $899.55 $999.50 $1,099.45 $1,199.40 $1,299.35 $1,399.30 $1,499.25 $1,599.20 $1,699.15 $1,799.10 $1,899.05 $1,999.00 $2,098.95 $2,198.90 $2,298.85 $2,398.80 $2,498.75 $2,598.70 $2,698.65 $2,798.60 $2,898.55 $2,998.50 $2,998.50 $2,998.50 $2,998.50 $2,998.50 $2,998.50 $2,998.50 $2,998.50 $2,998.50 $2,998.50 $2,998.50 $2,998.50 1.00 2.00 3.00 4.00 5.00 6.00 7.00 8.00 9.00 10.00 11.00 12.00 13.00 14.00 15.00 16.00 17.00 18.00 19.00 20.00 21.00 22.00 23.00 24.00 22.50 26.25 30.00 33.75 37.50 41.25 45.00 48.75 52.50 56.25 60.00 63.75 67.50 71.25 75.00 78.75 82.50 86.25 90.00 93.75 97.50 101.25 105.00 108.75 97.50 97.50 97.50 97.50 97.50 97.50 97.50 97.50 97.50 97.50 97.50 97.50 1.50 3.00 4.50 6.00 7.50 9.00 10.50 12.00 13.50 15.00 16.50 18.00 19.50 21.00 22.50 24.00 25.50 27.00 28.50 30.00 31.50 33.00 34.50 36.00 37.50 43.75 50.00 56.25 62.50 68.75 75.00 81.25 87.50 93.75 100.00 106.25 90.00 95.00 100.00 105.00 110.00 115.00 120.00 125.00 130.00 135.00 140.00 145.00 142.50 142.50 142.50 142.50 142.50 142.50 142.50 142.50 142.50 142.50 142.50 142.50 2.50 5.00 7.50 10.00 12.50 15.00 17.50 20.00 22.50 25.00 27.50 30.00 32.50 35.00 37.50 40.00 42.50 45.00 47.50 50.00 52.50 55.00 57.50 60.00 75.00 87.50 100 112.50 125.00 137.50 150.00 162.50 175.00 187.50 200.00 212.50 225.00 213.75 225.00 236.25 247.50 258.75 270.00 281.25 292.50 303.75 315.00 326.25 300.00 300.00 300.00 300.00 300.00 300.00 300.00 300.00 300.00 300.00 300.00 300.00 0 0 0 0 0 0 0 0 0 0 0 0 0 0 0 0 0 0 0 0 0 0 0 0 0 0 0 0 0 0 0 0 0 0 0 0 0 0 0 0 0 0 0 0 0 0 0 0 0 0 0 0 0 0 0 0 0 0 0 0 5.00 5.00 5.00 5.00 5.00 5.00 5.00 5.00 5.00 5.00 5.00 5.00 5.00 5.00 5.00 5.00 5.00 5.00 5.00 5.00 5.00 5.00 5.00 5.00 5.00 5.00 5.00 5.00 5.00 5.00 5.00 5.00 5.00 5.00 5.00 5.00 5.00 5.00 5.00 5.00 5.00 5.00 5.00 5.00 5.00 5.00 5.00 5.00 5.00 5.00 5.00 5.00 5.00 5.00 5.00 5.00 5.00 5.00 5.00 5.00 $10.00 $15.00 $20.00 $25.00 $30.00 $35.00 $40.00 $45.00 $50.00 $55.00 $60.00 $65.00 $70.00 $75.00 $80.00 $85.00 $90.00 $95.00 $100.00 $105.00 $110.00 $115.00 $120.00 $125.00 $140.00 $162.50 $185.00 $207.50 $230.00 $252.50 $275.00 $297.50 $320.00 $342.50 $365.00 $387.50 $387.50 $385.00 $405.00 $425.00 $445.00 $465.00 $485.00 $505.00 $525.00 $545.00 $565.00 $585.00 $545.00 $545.00 $545.00 $545.00 $545.00 $545.00 $545.00 $545.00 $545.00 $545.00 $545.00 $545.00 0.00 0.00 0.00 0.00 0.00 0.00 0.00 0.00 0.00 0.00 0.00 0.00 0.00 0.00 0.00 0.00 0.00 0.00 0.00 0.00 0.00 0.00 0.00 0.00 0.00 0.00 0.00 0.00 0.00 0.00 0.00 0.00 0.00 0.00 0.00 0.00 0.00 0.00 0.00 0.00 0.00 0.00 0.00 0.00 0.00 0.00 0.00 0.00 0.00 0.00 0.00 0.00 0.00 0.00 0.00 0.00 0.00 0.00 0.00 0.00 50.00 50.00 50.00 50.00 50.00 50.00 60.00 60.00 60.00 60.00 60.00 60.00 70.00 70.00 70.00 70.00 70.00 70.00 80.00 80.00 80.00 80.00 80.00 80.00 80.00 80.00 80.00 80.00 80.00 80.00 80.00 80.00 80.00 80.00 80.00 80.00 80.00 90.00 90.00 90.00 90.00 90.00 90.00 90.00 90.00 90.00 90.00 90.00 100.00 100.00 100.00 100.00 100.00 100.00 100.00 100.00 100.00 100.00 100.00 100.00 700.00 0.00 0.00 0.00 0.00 0.00 0.00 0.00 0.00 0.00 0.00 0.00 250.00 0.00 0.00 0.00 0.00 0.00 0.00 0.00 0.00 0.00 0.00 0.00 0.00 350.00 0.00 0.00 0.00 0.00 0.00 0.00 0.00 0.00 0.00 0.00 300.00 0.00 0.00 0.00 0.00 0.00 0.00 0.00 0.00 0.00 0.00 0.00 350.00 0.00 0.00 0.00 0.00 0.00 0.00 0.00 0.00 0.00 0.00 0.00 200.00 50.00 50.00 50.00 50.00 100.00 50.00 50.00 50.00 50.00 50.00 50.00 100.00 50.00 50.00 50.00 50.00 50.00 50.00 100.00 50.00 50.00 50.00 50.00 50.00 50.00 100.00 50.00 50.00 50.00 50.00 50.00 50.00 100.00 50.00 50.00 50.00 50.00 50.00 50.00 100.00 50.00 50.00 50.00 50.00 50.00 50.00 100.00 50.00 50.00 50.00 50.00 50.00 50.00 100.00 50.00 50.00 50.00 50.00 50.00 2,800.00 0.00 0.00 0.00 0.00 0.00 0.00 0.00 0.00 0.00 0.00 0.00 0.00 0.00 0.00 0.00 0.00 0.00 0.00 0.00 0.00 0.00 0.00 0.00 0.00 0.00 0.00 0.00 0.00 0.00 0.00 0.00 0.00 0.00 0.00 0.00 0.00 0.00 0.00 0.00 0.00 0.00 0.00 0.00 0.00 0.00 0.00 0.00 0.00 0.00 0.00 0.00 0.00 0.00 0.00 0.00 0.00 0.00 0.00 0.00 2,500.00 1,000.00 0.00 0.00 0.00 60.00 0.00 0.00 0.00 0.00 0.00 50.00 0.00 0.00 0.00 0.00 60.00 0.00 0.00 0.00 0.00 0.00 50.00 0.00 0.00 0.00 0.00 0.00 60.00 0.00 0.00 0.00 0.00 0.00 75.00 0.00 0.00 0.00 0.00 0.00 50.00 0.00 0.00 0.00 0.00 0.00 0.00 60.00 0.00 0.00 0.00 0.00 0.00 60.00 0.00 0.00 0.00 0.00 0.00 50.00 39.99 39.99 39.99 39.99 39.99 39.99 39.99 39.99 39.99 39.99 39.99 39.99 39.99 39.99 39.99 39.99 39.99 39.99 39.99 39.99 39.99 39.99 39.99 39.99 39.99 39.99 39.99 39.99 39.99 39.99 39.99 39.99 39.99 39.99 39.99 39.99 49.99 49.99 49.99 49.99 49.99 49.99 49.99 49.99 49.99 49.99 49.99 49.99 49.99 49.99 49.99 49.99 49.99 49.99 49.99 49.99 49.99 49.99 49.99 49.99 50.00 50.00 50.00 50.00 50.00 50.00 50.00 50.00 50.00 50.00 50.00 50.00 50.00 50.00 50.00 50.00 50.00 50.00 50.00 50.00 50.00 50.00 50.00 50.00 50.00 50.00 50.00 50.00 50.00 50.00 50.00 50.00 50.00 50.00 50.00 50.00 50.00 50.00 50.00 50.00 50.00 50.00 50.00 50.00 50.00 50.00 50.00 50.00 50.00 50.00 50.00 50.00 50.00 50.00 50.00 50.00 50.00 50.00 50.00 50.00 10.00 20.00 30.00 10.00 20.00 30.00 10.00 20.00 30.00 10.00 20.00 30.00 10.00 20.00 30.00 15.00 30.00 45.00 15.00 30.00 45.00 15.00 25.00 50.00 35.00 10.00 45.00 30.00 20.00 25.00 15.00 20.00 45.00 50.00 15.00 20.00 25.00 30.00 35.00 40.00 45.00 50.00 55.00 60.00 15.00 20.00 0.00 20.00 25.00 30.00 35.00 40.00 50.00 15.00 45.00 0.00 75.00 25.00 55.00 15.00 $6,349.99 $1,209.99 $219.99 $199.99 $209.99 $329.99 $209.99 $219.99 $229.99 $209.99 $219.99 $279.99 $519.99 $229.99 $239.99 $224.99 $299.99 $254.99 $234.99 $299.99 $264.99 $234.99 $294.99 $269.99 $254.99 $579.99 $314.99 $249.99 $299.99 $244.99 $234.99 $239.99 $264.99 $319.99 $309.99 $239.99 $554.99 $269.99 $274.99 $279.99 $384.99 $289.99 $294.99 $299.99 $254.99 $259.99 $239.99 $369.99 $624.99 $279.99 $284.99 $289.99 $299.99 $324.99 $344.99 $249.99 $324.99 $274.99 $304.99 $314.99 $10.00 $15.00 $20.00 $25.00 $30.00 $35.00 $40.00 $45.00 $50.00 $55.00 $60.00 $65.00 $70.00 $75.00 $80.00 $85.00 $90.00 $95.00 $100.00 $105.00 $110.00 $115.00 $120.00 $125.00 $140.00 $162.50 $185.00 $207.50 $230.00 $252.50 $275.00 $297.50 $320.00 $342.50 $365.00 $387.50 $387.50 $385.00 $405.00 $425.00 $445.00 $465.00 $485.00 $505.00 $525.00 $545.00 $565.00 $585.00 $545.00 $545.00 $545.00 $545.00 $545.00 $545.00 $545.00 $545.00 $545.00 $545.00 $545.00 $545.00 $6,359.99 $1,224.99 $239.99 $224.99 $239.99 $364.99 $249.99 $264.99 $279.99 $264.99 $279.99 $344.99 $589.99 $304.99 $319.99 $309.99 $389.99 $349.99 $334.99 $404.99 $374.99 $349.99 $414.99 $394.99 $394.99 $742.49 $499.99 $457.49 $529.99 $497.49 $509.99 $537.49 $584.99 $662.49 $674.99 $627.49 $942.49 $654.99 $679.99 $704.99 $829.99 $754.99 $779.99 $804.99 $779.99 $804.99 $804.99 $954.99 $1,169.99 $824.99 $829.99 $834.99 $844.99 $869.99 $889.99 $794.99 $869.99 $819.99 $849.99 $859.99 -$6,359.99 -1,224.99 -239.99 -224.99 -239.99 -364.99 -249.99 -264.99 -279.99 -264.99 -279.99 -344.99 -589.99 -304.99 -319.99 -309.99 -389.99 -349.99 -334.99 -404.99 -374.99 -349.99 -414.99 -394.99 -394.99 -742.49 -499.99 -457.49 -529.99 -497.49 -509.99 -537.49 -584.99 -662.49 -674.99 -627.49 -942.49 -654.99 -679.99 -704.99 -829.99 -754.99 -779.99 -804.99 -779.99 -804.99 -804.99 -954.99 -1169.99 -824.99 -829.99 -834.99 -844.99 -869.99 -889.99 -794.99 -869.99 -819.99 -849.99 -859.99 $19.99 $39.99 $59.97 $79.96 $99.95 $119.94 $139.93 $159.92 $179.91 $199.90 $219.89 $239.88 $259.87 $279.86 $299.85 $319.84 $339.83 $359.82 $379.81 $399.80 $419.79 $439.78 $459.77 $479.76 $599.70 $699.65 $799.60 $899.55 $999.50 $1,099.45 $1,199.40 $1,299.35 $1,399.30 $1,499.25 $1,599.20 $1,699.15 $1,799.10 $1,899.05 $1,999.00 $2,098.95 $2,198.90 $2,298.85 $2,398.80 $2,498.75 $2,598.70 $2,698.65 $2,798.60 $2,898.55 $2,998.50 $2,998.50 $2,998.50 $2,998.50 $2,998.50 $2,998.50 $2,998.50 $2,998.50 $2,998.50 $2,998.50 $2,998.50 $2,998.50 -$6,340.00 -1,185 -180.02 -145.03 -140.04 -245.05 -110.06 -105.07 -100.08 -65.09 -60.1 -105.11 -330.12 -25.13 -20.14 9.85 -50.16 9.83 44.82 -5.19 44.8 89.79 44.78 84.77 204.71 -42.84 299.61 442.06 469.51 601.96 689.41 761.86 814.31 836.76 924.21 1,071.66 856.61 1,244.06 1,319.01 1,393.96 1,368.91 1,543.86 1,618.81 1,693.76 1,818.71 1,893.66 1,993.61 1,943.56 1,828.51 2,173.51 2,168.51 2,163.51 2,153.51 2,128.51 2,108.51 2,203.51 2,128.51 2,178.51 2,148.51 2,138.51 -$6,340.00 -7,525 -7,705.02 -7,850.05 -7,990.09 -8,235.14 -8,345.2 -8,450.27 -8,550.35 -8,615.44 -8,675.54 -8,780.65 -9,110.77 -9,135.9 -9,156.04 -9,146.19 -9,196.35 -9,186.52 -9,141.7 -9,146.89 -9,102.09 -9,012.3 -8,967.52 -8,882.75 -8,678.04 -8,720.88 -8,421.27 -7,979.21 -7,509.7 -6,907.74 -6,218.33 -5,456.47 -4,642.16 -3,805.4 -2,881.19 -1,809.53 -952.92 291.14 1,610.15 3,004.11 4,373.02 5,916.88 7,535.69 9,229.45 11,048.16 12,941.82 14,935.43 16,878.99 18,707.5 20,881.01 23,049.52 25,213.03 27,366.54 29,495.05 31,603.56 33,807.07 35,935.58 38,114.09 40,262.6 42,401.11