What will youlearn?
Analyze and interpret data in
pie charts to answer questions.
3.
What is piechart?
• A circle is divided into parts to show
the information.
• Used to show the relation of the
parts to the whole and to each
other.
• The parts vary in size according to
the information presented.
2/5
2/5
1/5
Book Collection
Comic BooksStory Books Mystery Books
Book
Collection
Fraction
Comic
2
5
Story
2
5
Mystery
1
5
2
5
+
2
5
+
1
5
= 1
The whole circle represents 1
8.
Favorite Sports
Soccer BasketSwim Others
The pie chart shows student’s
favorite sports.
There are 30 students in the class.
a. How many students choose
soccer as their favorite sports?
b. How many students choose
basket as their favorite
sports?
1
3
1
3
1
6
1
6
9.
1
6
x 30 =5 students
a. Soccer
There are 5 students choose soccer as their favorite
sports.
b. Basket
1
3
x 30 = 10 students
There are 10 students choose basket as their favorite
sports.
10.
50%
25%
15%
Car Motorcycle BusOn Foot
The pie chart shows how students
travel to school.
a. What percentage of the students
travel to school by bus?
b. What fraction of the students
travel to school by foot?
c. 50 students travel to school by
motorcycle. How many students
are there in the school?
11.
a. What percentageof the students travel to school by
bus?
50%
25%
15%
Car Motorcycle Bus On Foot
100% - 50% - 25% - 15% = 10%
b. What fraction of the students travel
to school by foot?
Percentage of students travel by
foot = 15%
Convert percentage to fractions
15 % =
15
100
=
3
20
10% of students travel to school
by bus.
3
20
of the students travel to school by foot.
12.
50%
25%
15%
Car Motorcycle BusOn Foot
c. 50 students travel to school by motorcycle. How many
students are there in the school?
25% → 50 𝑠𝑡𝑢𝑑𝑒𝑛𝑡𝑠
1% → 50 ÷ 25
= 2
𝑇ℎ𝑒 𝑤ℎ𝑜𝑙𝑒 𝑐𝑖𝑟𝑐𝑙𝑒 = 100%
100% = 1% 𝑥 100
= 2 𝑥 100
= 200
There are 200 students in the school
13.
Pupil’s Book page61
Work in pairs.
1. 30 pupils liked swimming. Find the number of pupils
whose favorite sport is as follow:
a. Badminton
b. Soccer
c. Table tennis
Soccer Swimming
Badminton
Table
tennis
7
20
Pupil’s Book page61
Work in pairs.
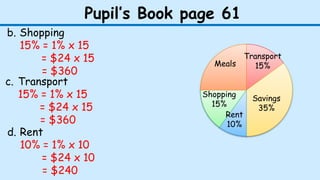
2.The pie chart show how Mr. Yeo spends his monthly
salary. Mr. Yeo saves $840 a month, find the amount of
money he spend on each of the following.
a. Meals
b. Shopping
c. Transport
d. Rent
Meals
Transport
15%
Savings
35%
Rent
10%
Shopping
15%
Pupil’s Book page61
Meals
Transport
15%
Savings
35%
Rent
10%
Shopping
15%
b. Shopping
15% = 1% x 15
= $24 x 15
= $360
c. Transport
15% = 1% x 15
= $24 x 15
= $360
d. Rent
10% = 1% x 10
= $24 x 10
= $240
18.
Practice
Do pupil’s bookpage 62
Pie chart about fiction books in a library.
Try to answer 2a, b, and c.