Child development classTopic Divorce Impact and Conseque
Apple Inc
1. Apple Inc. (APPL)
Analysts: Weifeng Liang, Bowen Wu
Sector: Technology Current Price: $109.83 Div Yield: 2.01%
Market cap: 591.81B Target Price: $147 Beta: 1.55
Investment Thesis 1: Market’s Overreaction to Recent Negative News is creating a Better Buy-in Opportunity
Apple’s stock price has been suffering Since Apple’s Q4 report of 2016 was announced; Q4 revenue from Greater China
dropped 30% compared to Q4 2015; It is the first year that Apple’s total revenue has stopped growing since 2001. Because
of such disappointing performance, the market doubted whether Apple is starting to decline. All the disappointments and
doubts in market made some investors sell Apple’s stock and the stock price quickly dropped from $118.25 to $109.83 per
share. Such market overreaction is creating a better buy-in opportunity as taking advantage of this mispricing can bring
higher return to investors.
Investment Thesis 2: iPhone 7/Plus sales potential and Samsung Note 7’s recall
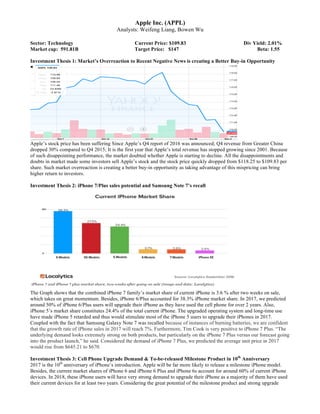
The Graph shows that the combined iPhone 7 family’s market share of current iPhone is 3.6 % after two weeks on sale,
which takes on great momentum. Besides, iPhone 6/Plus accounted for 38.3% iPhone market share. In 2017, we predicted
around 50% of iPhone 6/Plus users will upgrade their iPhone as they have used the cell phone for over 2 years. Also,
iPhone 5’s market share constitutes 24.4% of the total current iPhone. The upgraded operating system and long-time use
have made iPhone 5 retarded and thus would stimulate most of the iPhone 5 users to upgrade their iPhones in 2017.
Coupled with the fact that Samsung Galaxy Note 7 was recalled because of instances of burning batteries, we are confident
that the growth rate of iPhone sales in 2017 will reach 7%. Furthermore, Tim Cook is very positive to iPhone 7 Plus. “The
underlying demand looks extremely strong on both products, but particularly on the iPhone 7 Plus versus our forecast going
into the product launch,” he said. Considered the demand of iPhone 7 Plus, we predicted the average unit price in 2017
would rise from $645.21 to $670.
Investment Thesis 3: Cell Phone Upgrade Demand & To-be-released Milestone Product in 10th
Anniversary
2017 is the 10th
anniversary of iPhone’s introduction. Apple will be far more likely to release a milestone iPhone model.
Besides, the current market shares of iPhone 6 and iPhone 6 Plus and iPhone 6s account for around 60% of current iPhone
devices. In 2018, these iPhone users will have very strong demand to upgrade their iPhone as a majority of them have used
their current devices for at least two years. Considering the great potential of the milestone product and strong upgrade
2. demand, we forecasted that the sales volume of iPhone in 2018 would be at least 291million iPhones, which is 25%
increase compared with the sales volume of 2017. Plus, we think the average unit price would go up to $690.
Investment Thesis 4: Long-term Sales Growth in China is going to Be Driven by Blooming Mid-Class
According to McKinsey’s report, from 2002 to 2022, the number of households of upper mid-class in China will increase
by 188 million, the mass mid-class will rise by 66 million, and the affluent will go up by 29 million, respectively. The total
population of all the three groups is 1.13 billion assuming that there are four people in each household.
Let’s take iPhone sales as an example. Assuming that iPhone’s target customers include affluent people, upper mid-class
and 50% of mass mid-class, the population of the target group is 1 billion. Therefore, the average incremental population
during the 20 years is 50 million. For a given 15% iPhone market share in China, the incremental iPhone sales units are 7.5
million per year. Here is a scenario. If Apple’s future revenue growth rate is 7%, iPhone sales units have to increase by 4.2%
because iPhone revenue accounts for at least 60% of total revenue. 4.2% incremental sales units are approximately 10
million. Based on above calculation, China’s booming target groups can contribute to 75% of iPhone sales target.
All in all, 7% growth rate can be easily achieved if apple can fully exploit China’s blooming target groups.
DCF Analysis
In order to calculate the intrinsic value accurately, we predicted the revenue growth rate in 2017 and 2018 individually by
performing breakdown analysis to each component of revenue.
1. iPhone
Sales Units 2015 2016 2017 2018
iPhone 231,218,000 211,870,000 226,700,900 283,376,125
YOY% 7% 25%
Revenue
(in millions)
2017 2018
iPhone $670/unit $151,900.00 $690/unit $195,542.00
According to the Thesis 2 and 3, we predicted the iPhone sales units would be 211.87 and 226.72 millions in 2017 and
2018 respectively. Also, the average unit price would be $670 in 2017, and $690 in 2018. Therefore, the iPhone revenue
would be $151,900 millions in 2017 and $195,542 in 2018.
2. iPad
Sales Units 2014 2015 2016 2017 2018
iPad 67,977,000 54,856,000 45,590,000 37,339,666 30,582,378
-19.30% -16.89% -18.10% -18.10%
Revenue
(in millions)
2017 2018
iPad $452.47/unit $16,895.00 $452.47/unit $13,838.00
Since the iPad sales showed an obvious downward trend from 2015 to 2016, we took the average of the growth rates for
these two years as the growth rate in 2017 and 2018, which would be -18.10%. We got 37.34 million sales units for 2017
3. and 30.58 million for 2018. Assuming that the average unit price will be as same as the price of 2016, $452.47, we got iPad
revenues in 2017 and 2018, $16895 million and $13838 million respectively.
3.Macintosh
Since the historical Macintosh sales fluctuated a lot, we took the average YOY% from 2012 to 2016 as the growth rate for
2017 and 2018, which is 2.57%. Finally, we got 18.96 million and 19.45 million sales units for 2017 and 2018 respectively.
Given that Apple announced new series of MacBook whose prices are higher than previous versions, we predicted the
average unit price for the coming two years would increase from $1235.18 for 2016 to around $1400.
Totally, Macintosh revenue would be $26544 million in 2017 and $27227 million in 2018.
4. Services & Other products
Regarding these two segments, we averaged the previous 5 years’ revenue growth rates and ultimately got the 21.42% for
Services and 21.70% for Other Products in the coming two years. For the Services revenue, 2017 would be $29563.19
million, and 2018 would be $35895.44 million. Besides, the revenue of Other Products would be $13547.32 million in 2017
and $16486.89 million in 2018.
5. Total
Revenue (in millions) 2017 2018
iPhone $670/unit $151,900.00 $690/unit $195,542.00
iPad $452.47/unit $16,895.00 $452.47/unit $13,838.00
Macintosh $1400/unit $26,544.00 $1400/unit $27,227.00
Services N/A $29,563.19 N/A $35,895.44
Other Products N/A $13,547.32 N/A $16,486.69
Total $238,449.51 $288,989.13
YOY% 11% 21%
Based on above breakdown analysis, the total revenue in 2017 would be$238,449.51 million and the total revenue in 2018
would be $288,989.13 million. The YOY% would be 11% and 21% respectively.
DCF Results
Since we don’t have enough reliable information after 2018, we are going to assume a same growth rate from 2019 to 2015,
which is 7%. For the given 11% revenue growth rate in 2017, 21% in 2018, 7% from 2019 and 2025, 3% constant growth
rate and 11% discount rate, we computed the intrinsic value of Apple, which is $147. The margin of safety is 25.29%.
Additionally, we performed sensitivity analysis as below:
WACC
Growth Rate
6% 6.50% 7% 7.50% 8%
10.00% $160.00 $164.00 $168.00 $173.00 $177.00
10.50% $150.00 $153.00 $157.00 $161.00 $165.00
11.00% $140.00 $143.00 $147.00 $150.00 $154.00
11.50% $132.00 $135.00 $138.00 $141.00 $145.00
12.00% $124.00 $127.00 $130.00 $133.00 $136.00
Sales
Units 2011 2012 2013 2014 2015 2016 2017 2018
Macintosh 16,735,000 18,158,000 16,341,000 18,906,000 20,587,000 18,484,000 18,959,757 19,447,759
YOY% 8.50% -10.01% 15.70% 8.89% -10.22% 2.57% 2.57%
Revenue
(in millions)
2017 2018
Macintosh $1400/unit $26,544.00 $1400/unit $27,227.00
Revenue
(in
millions)
2011 2012 2013 2014 2015 2016 2017 2018
Services 9,373.00 12,890.0 16,051.0 18,063.0 19,909.0 24,348.00 29563.18758 35895.43535
YOY% 37.52% 24.52% 12.54% 10.22% 22.30% 21.42% 21.42%
Other
Products
4,474.0 5,145.0 5,706.0 6,093.0 10,067.0 11,132.00 13547.31885 16486.69134
YOY% 15.00% 10.90% 6.78% 65.22% 10.58% 21.70% 21.70%
4. Relative Valuation
1. Key Ratios Comparison
P/E
FY2015
P/B
FY2015
ROE
FY2015
ROA
FY2015
Finl Lev
FY2015
Revenue
FY2015
(in million)
Profit
Margin
FY2015
Gross
Profit
Margin
FY2015
Apple 13.65 4.69 46.30% 20.47% 1.41 $233,715.01 23.10% 40.10%
Samsung 9.98 0.93 9.75% 7.91% 2.26 $177,404.21 9.32% 38.46%
Industry Average 23.70 3.44 15.22% 8.02% 2.87 $72,224.81 10.92% 38.73%
We can see from the table that Apple outperformed its largest competitor Samsung and industry average in terms of gross
profit margin, profit margin, financial leverage, ROA, ROE and Revenue. Considering Apple’s probability, Apple’s P/E
and P/B are still relatively low. All in all, Apple’s stock price still has room to grow in a long run.
2. Regression Analysis
P/B P/E Beta ROA Log Revenue
Apple 3.6721 19.9444 1.0301 14.83172 11.33262
Industry 3.337909 11.58833 1.088756 7.460472 10.34025
The regression analysis also supports the above analysis. The intrinsic P/E of Apple is higher than its current P/E.
Therefore; we concluded that apple is underestimated.
3. Precedent Transactions
Scenario Median Multiple Implied Price Margin of Safety
Price/Free Cash Flow 14.0376681 138.27 0.192955811
EV/EBITDA 11.98141098 146.86 0.240160697
Price/Sales 2.181178093 87.26 -0.278821912
Median Implied Price 138.27 0.192955811
As the table shows above, Apple is around 20% underestimated by using the multiple of P/FCF and EV/EBITDA. The
median implied price by using Precedent Transactions Method is $138.27, 19% underestimated compared with current
price.
Risk and Apple’s Hedging Strategy
1. China’s Regulatory risk
Apple’s iBooks Store and iTunes Movies were shut down in China this April. This kind of regulatory risk will frequently
occur as Chinese government put more emphasis on improvement of cyberspace and content quality management, and on
supporting domestic emerging Internet companies such as Alibaba, Huawei, Tencent, Didi, etc. To shore up relationship
with government, Apple invested $1 Billion to Didi and promised to share its experience on Internet with Chinese Internet
companies to drive the development of the whole industry.
2. Apple faces a flattening innovation curve
Apple is facing great competition in terms of mobile phones’ innovation. Gadget experts said it is experiencing a flattening
innovation curve. However, we wouldn’t worry about this so-called “bottleneck” as swiping tech breakthrough requires a
long time. It is too demanding to ask Apple to make very innovative products every year. Besides, Apple’s heavy
investment in R&D and the best mobile phone designer make me very confident that the risk regarding innovation is not a
real concern.
3. Services Revenues Are Tied to Device Sales
Apple’s service revenue is tied up to device sales. This risk will be problematic if the sales volume decreased. However,
with the recovered growth rate for iPhone sales volume and the change of customers’ behavior in emerging markets,
recurring revenues from services would be dominant.