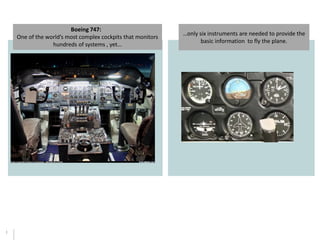
SlideShare a Scribd company logo
1 of 5
Download to read offline
1
Boeing 747:
One of the world’s most complex cockpits that monitors
hundreds of systems , yet…
…only six instruments are needed to provide the
basic information to fly the plane.
2
Quality & Risk AND Scale & Efficiency
There are a number of drivers that can be used to gain insight on processes…
…but a subset of dual use metrics provides the basic information to understand how
processes are operating and where to delve further.
Scale & Efficiency Outcomes
Quality & Risk Outcomes
Dual Use Indicators
STP /
Automation
FPA
Deliverable
Timeliness
Proficiency &
Cross Training
Task
Timeliness
Deliverable
Quality
Unit Cost
Units / FTE
Incidents
Incidents / 100 Accounts
Quality
& Risk
Scale &
Efficiency
Two Sides of the
Same Coin
3
Dual Use Rationale
Metric Category Quality & Risk
Use
Scale & Efficiency
Use
STP / Automation Rate Leading / Infrastructure Assuming system logic is correct,
provides for a volume of
transactions that should be 100%
accurate.
Primary: Indication of what relative %
of new volumes can be absorbed
without added headcount (scale)
Secondary: Insight into supplier
quality.
Associate Proficiency &
Cross Training
Leading / Infrastructure Indication of whether fully trained
individuals are available to
execute the processes.
Indication of whether fungible
resources are available to absorb
temporary spikes in demand.
Task Timeliness Current / Process In regards to late tasks, indication
of stress in the system and
potential opportunities for rushed
/ inadequate reviews
Indication of excess or insufficient
capacity required to execute processes
First Pass Accuracy Current / Process Indication of the level of processor
proficiency as well as the relative
volume of errors that must be
caught before release.
Indication of the level of “hidden” and
uncounted unit volume transactions
that must be reprocessed , adversely
impacting efficiency and units/FTE.
Deliverable Timeliness Lagging / Deliverable Indication of stress in the system
that might create situations
where rushed reviews result in
missed errors. In some cases
timeliness is mandated.
Indication of inefficient use of
resources (too early) or inability to
handle volumes based upon current
staffing model (lack of scale).
Deliverable Quality Lagging / Deliverable Indication of the impact of an
incidents across the body of
deliverables. Often one issue can
impact multiple deliverables
Indication of the level of reprocessing
and management time that must be
expended due to deliverable quality
issues
4
Quality Drivers…
5
Scale & Efficiency Drivers…

More Related Content

Viewers also liked

for publication IDA 2011
for publication IDA 2011for publication IDA 2011
for publication IDA 2011shahid shafiq
 
3 prevencion de accidentes
3 prevencion de accidentes3 prevencion de accidentes
3 prevencion de accidentespatu27
 
Función personal
Función personalFunción personal
Función personalpoetaneruda
 
Paz xiomy
Paz xiomyPaz xiomy
Paz xiomycandyx
 
Sena institucional
Sena institucionalSena institucional
Sena institucionalvsutaq
 

Viewers also liked (8)

for publication IDA 2011
for publication IDA 2011for publication IDA 2011
for publication IDA 2011
 
Tarea 1 web 2
Tarea 1 web 2Tarea 1 web 2
Tarea 1 web 2
 
3 prevencion de accidentes
3 prevencion de accidentes3 prevencion de accidentes
3 prevencion de accidentes
 
Elección presidencial en los EE.UU
Elección presidencial  en los EE.UUElección presidencial  en los EE.UU
Elección presidencial en los EE.UU
 
Función personal
Función personalFunción personal
Función personal
 
Paz xiomy
Paz xiomyPaz xiomy
Paz xiomy
 
Sena institucional
Sena institucionalSena institucional
Sena institucional
 
Presentación1
Presentación1Presentación1
Presentación1
 

Similar to Metric Six Pack II-2

AFITC 2018 - Using Process Maturity and Agile to Strengthen Cyber Security
AFITC 2018 - Using Process Maturity and Agile to Strengthen Cyber SecurityAFITC 2018 - Using Process Maturity and Agile to Strengthen Cyber Security
AFITC 2018 - Using Process Maturity and Agile to Strengthen Cyber SecurityDjindo Lee
 
Workforce Management & BPM Integration
Workforce Management & BPM IntegrationWorkforce Management & BPM Integration
Workforce Management & BPM IntegrationNathaniel Palmer
 
Workforce Management & BPM Integration
Workforce Management & BPM IntegrationWorkforce Management & BPM Integration
Workforce Management & BPM IntegrationNathaniel Palmer
 
DTS_Standardized Manufacturing (New Template) Rev 4
DTS_Standardized Manufacturing (New Template) Rev 4DTS_Standardized Manufacturing (New Template) Rev 4
DTS_Standardized Manufacturing (New Template) Rev 4Larry Thompson, MfgT.
 
T3 Consortium's Performance Center of Excellence
T3 Consortium's Performance Center of ExcellenceT3 Consortium's Performance Center of Excellence
T3 Consortium's Performance Center of Excellenceveehikle
 
CH6 6.1 PROCESS THINKING Process thinking is the point o.docx
CH6 6.1 PROCESS THINKING Process thinking is the point o.docxCH6 6.1 PROCESS THINKING Process thinking is the point o.docx
CH6 6.1 PROCESS THINKING Process thinking is the point o.docxsleeperharwell
 
Automation Best Practices.pptx
Automation Best Practices.pptxAutomation Best Practices.pptx
Automation Best Practices.pptxpavelpopov43
 
S.R.E - create ultra-scalable and highly reliable systems
S.R.E - create ultra-scalable and highly reliable systemsS.R.E - create ultra-scalable and highly reliable systems
S.R.E - create ultra-scalable and highly reliable systemsRicardo Amaro
 
Total Quality Management Principles
Total Quality Management PrinciplesTotal Quality Management Principles
Total Quality Management PrinciplesAmmar Mubarak
 
Building continuous auditing capabilities
Building continuous auditing capabilitiesBuilding continuous auditing capabilities
Building continuous auditing capabilitiesWafaa N. AbuSadah
 
Debs 2011 tutorial on non functional properties of event processing
Debs 2011 tutorial  on non functional properties of event processingDebs 2011 tutorial  on non functional properties of event processing
Debs 2011 tutorial on non functional properties of event processingOpher Etzion
 
From testing to quality governance and problem resolution.pdf
From testing to quality governance and problem resolution.pdfFrom testing to quality governance and problem resolution.pdf
From testing to quality governance and problem resolution.pdfXavier Escudero Sabadell
 
Business Process Automation A Productivity Lever
Business Process Automation A Productivity LeverBusiness Process Automation A Productivity Lever
Business Process Automation A Productivity LeverKnoldus Inc.
 
DevOps Approach (Point of View by Ravi Tadwalkar)
DevOps Approach (Point of View by Ravi Tadwalkar)DevOps Approach (Point of View by Ravi Tadwalkar)
DevOps Approach (Point of View by Ravi Tadwalkar)Ravi Tadwalkar
 
Engineering DevOps to meet Business Goals
 Engineering DevOps to meet Business Goals Engineering DevOps to meet Business Goals
Engineering DevOps to meet Business GoalsMarc Hornbeek
 

Similar to Metric Six Pack II-2 (20)

AFITC 2018 - Using Process Maturity and Agile to Strengthen Cyber Security
AFITC 2018 - Using Process Maturity and Agile to Strengthen Cyber SecurityAFITC 2018 - Using Process Maturity and Agile to Strengthen Cyber Security
AFITC 2018 - Using Process Maturity and Agile to Strengthen Cyber Security
 
Software Performance
Software Performance Software Performance
Software Performance
 
Workforce Management & BPM Integration
Workforce Management & BPM IntegrationWorkforce Management & BPM Integration
Workforce Management & BPM Integration
 
Workforce Management & BPM Integration
Workforce Management & BPM IntegrationWorkforce Management & BPM Integration
Workforce Management & BPM Integration
 
DTS_Standardized Manufacturing (New Template) Rev 4
DTS_Standardized Manufacturing (New Template) Rev 4DTS_Standardized Manufacturing (New Template) Rev 4
DTS_Standardized Manufacturing (New Template) Rev 4
 
T3 Consortium's Performance Center of Excellence
T3 Consortium's Performance Center of ExcellenceT3 Consortium's Performance Center of Excellence
T3 Consortium's Performance Center of Excellence
 
CH6 6.1 PROCESS THINKING Process thinking is the point o.docx
CH6 6.1 PROCESS THINKING Process thinking is the point o.docxCH6 6.1 PROCESS THINKING Process thinking is the point o.docx
CH6 6.1 PROCESS THINKING Process thinking is the point o.docx
 
Automation Best Practices.pptx
Automation Best Practices.pptxAutomation Best Practices.pptx
Automation Best Practices.pptx
 
S.R.E - create ultra-scalable and highly reliable systems
S.R.E - create ultra-scalable and highly reliable systemsS.R.E - create ultra-scalable and highly reliable systems
S.R.E - create ultra-scalable and highly reliable systems
 
Test Automation for QTP
Test Automation for QTPTest Automation for QTP
Test Automation for QTP
 
Test Automation
Test AutomationTest Automation
Test Automation
 
Sda 3
Sda   3Sda   3
Sda 3
 
Total Quality Management Principles
Total Quality Management PrinciplesTotal Quality Management Principles
Total Quality Management Principles
 
Building continuous auditing capabilities
Building continuous auditing capabilitiesBuilding continuous auditing capabilities
Building continuous auditing capabilities
 
Debs 2011 tutorial on non functional properties of event processing
Debs 2011 tutorial  on non functional properties of event processingDebs 2011 tutorial  on non functional properties of event processing
Debs 2011 tutorial on non functional properties of event processing
 
VSM – Current & Future
VSM – Current & FutureVSM – Current & Future
VSM – Current & Future
 
From testing to quality governance and problem resolution.pdf
From testing to quality governance and problem resolution.pdfFrom testing to quality governance and problem resolution.pdf
From testing to quality governance and problem resolution.pdf
 
Business Process Automation A Productivity Lever
Business Process Automation A Productivity LeverBusiness Process Automation A Productivity Lever
Business Process Automation A Productivity Lever
 
DevOps Approach (Point of View by Ravi Tadwalkar)
DevOps Approach (Point of View by Ravi Tadwalkar)DevOps Approach (Point of View by Ravi Tadwalkar)
DevOps Approach (Point of View by Ravi Tadwalkar)
 
Engineering DevOps to meet Business Goals
 Engineering DevOps to meet Business Goals Engineering DevOps to meet Business Goals
Engineering DevOps to meet Business Goals
 

Metric Six Pack II-2

  • 1. 1 Boeing 747: One of the world’s most complex cockpits that monitors hundreds of systems , yet… …only six instruments are needed to provide the basic information to fly the plane.
  • 2. 2 Quality & Risk AND Scale & Efficiency There are a number of drivers that can be used to gain insight on processes… …but a subset of dual use metrics provides the basic information to understand how processes are operating and where to delve further. Scale & Efficiency Outcomes Quality & Risk Outcomes Dual Use Indicators STP / Automation FPA Deliverable Timeliness Proficiency & Cross Training Task Timeliness Deliverable Quality Unit Cost Units / FTE Incidents Incidents / 100 Accounts Quality & Risk Scale & Efficiency Two Sides of the Same Coin
  • 3. 3 Dual Use Rationale Metric Category Quality & Risk Use Scale & Efficiency Use STP / Automation Rate Leading / Infrastructure Assuming system logic is correct, provides for a volume of transactions that should be 100% accurate. Primary: Indication of what relative % of new volumes can be absorbed without added headcount (scale) Secondary: Insight into supplier quality. Associate Proficiency & Cross Training Leading / Infrastructure Indication of whether fully trained individuals are available to execute the processes. Indication of whether fungible resources are available to absorb temporary spikes in demand. Task Timeliness Current / Process In regards to late tasks, indication of stress in the system and potential opportunities for rushed / inadequate reviews Indication of excess or insufficient capacity required to execute processes First Pass Accuracy Current / Process Indication of the level of processor proficiency as well as the relative volume of errors that must be caught before release. Indication of the level of “hidden” and uncounted unit volume transactions that must be reprocessed , adversely impacting efficiency and units/FTE. Deliverable Timeliness Lagging / Deliverable Indication of stress in the system that might create situations where rushed reviews result in missed errors. In some cases timeliness is mandated. Indication of inefficient use of resources (too early) or inability to handle volumes based upon current staffing model (lack of scale). Deliverable Quality Lagging / Deliverable Indication of the impact of an incidents across the body of deliverables. Often one issue can impact multiple deliverables Indication of the level of reprocessing and management time that must be expended due to deliverable quality issues
  • 5. 5 Scale & Efficiency Drivers…